Get Indexology® Blog updates via email.

In This List

Income Is Expensive but Don’t Wait for a Free Lunch

Can SDGs Shape the Future of Corporate Disclosure?

What Are Large-Cap Active Managers Up To? A Decomposition of Their Active Sector and Factor Bets (Part I)

As Markets Await Fed Chair Nomination, U.S. Treasury Curve Continues to Flatten

S&P STRIDE Target Date Funds: Making STRIDEs in Evaluating the Performance of Retirement Solutions

Income Is Expensive but Don’t Wait for a Free Lunch

Contributor Image
Philip Murphy

Former Managing Director, Global Head of Index Governance

S&P Dow Jones Indices

Those looking to convert risky assets into predictable income streams by purchasing bonds or annuities may be disappointed to learn how relatively little income they can acquire with a given level of wealth.  However, it is more constructive to accept capital market conditions for what they are rather than looking at this as an insurmountable problem.  While low rates equate to expensive income, the other side of the same coin is rich valuation of the stock market (driven by a number of factors but perhaps mainly due to low rates).  It is historically rare to have the free lunch of buying relatively cheap income with relatively high-valued stocks.  From around 1949 to 1966, capital markets did offer that precise bargain.  Stock valuations, as measured by Robert Shiller’s CAPE ratio, increased from between 9-10 in 1949 to a peak of over 24 in early 1966 (see Exhibit 1).  The 10-year Treasury rates moved from about 2.30% to about 4.75% over the same period.  Those who retired around  1965 who planned ahead and began buying income a little at a time, say 15 years before retirement, would have converted increasingly valued equites into increasingly cheaper (and therefore larger) predictable cash flows.

Unfortunately, free lunches are a rare treat.  Most of the time, stock valuations have been high when interest rates were low, and vice versa.  For example, in the early 1980s when rates hit all-time highs, the CAPE ratio sank well below 10.  You could have bought a lot of income with a given wealth level, but if your wealth was in stocks it was not a great time to sell.
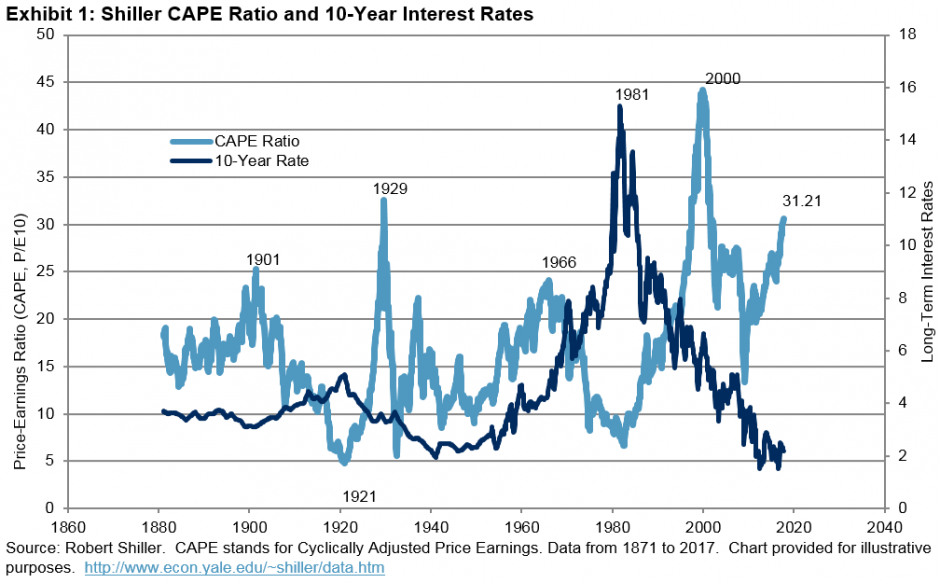
Looking ahead, higher rates may coincide with lower stock valuations.  For those approaching retirement, timing income acquisition may be just as fraught as timing stocks.  On the other hand, buying expensive income with expensive equities may not be as poor a tradeoff as it first seems—particularly if implemented a little at a time through a methodical program.  Dollar cost averaging is a time-tested approach to wealth accumulation; why not apply the same technique to other long-term financial challenges like providing retirement income?

S&P Dow Jones Indices has an index series that represents a strategy of doing just that—dollar cost averaging into assets that mitigate the risk of future inflation-adjusted income.  It is called the S&P STRIDE Index Series, but the strategy it measures is not the only way to accomplish the same goal.  Bond laddering is another, and there are insurance-based solutions like annuities and guaranteed minimum withdrawal programs.  For 401(k) savers, laddering is not feasible and insurance products are not widely available.  However, many retirement plan sponsors are actively looking for solutions to facilitate an income goal as the ultimate mission of their plans.  If you are fortunate enough to have a retirement plan, that is half the battle.  If you have a plan but do not have income options, speak to your benefits department to encourage them to begin considering how to offer a retirement income program within the plan.

The posts on this blog are opinions, not advice. Please read our Disclaimers.

Can SDGs Shape the Future of Corporate Disclosure?

Contributor Image
Libby Bernick

Global Head of Corporate Business

Trucost, part of S&P Dow Jones Indices

Businesses are showing increasing interest in using the Sustainable Development Goals (SDGs) to inform and enhance their social and environmental programs and ultimately their business strategies.  The SDGs were adopted by the United Nations in 2015 and include 17 ambitious goals and 169 targets aimed at ending poverty, protecting the planet, and ensuring prosperity for all.

The appeal of the SDGs for companies and financial institutions is that they harmonize the social, environmental, and economic aspects of sustainable development and—perhaps most importantly—provide a clear vision of what the international community wants to achieve.  They give meaning and purpose, not just to corporate sustainability programs, but to an organization’s business objectives.

There are also pragmatic business reasons for pursuing the SDGs.  Achieving the goals could create over USD 12 trillion per year in business value in clean and efficient energy, affordable housing and access to healthcare, and material efficiency and waste management.

But there are challenges with the SDGs.  Although three-quarters of companies under the UN Global Compact say they are taking action to meet the SDGs, this is often for a single goal—usually ones pertaining to creating good jobs, economic growth, health, and well-being.  Moreover, some of these companies only choose to report against goals that correspond to existing environmental or social targets.

A few multi-stakeholder organizations have developed SDG reporting frameworks to help companies and financial institutions, including the Cambridge Institute for Sustainable Leadership, the Dutch SDG Investing Agenda, the GRI and UN Global Compact, Earth Security Group with HSBC, and the Sustainable Development Investment framework.  Although they are a great first step, some are too generic and lacking in precise metrics, while others are more detailed but struggle to address global goals or the need to create business value.

Building on almost 20 years of experience working with companies and financial institutions on measuring ESG performance and integrating it into business and investment decisions, Trucost considers that a successful SDG framework should be based on the following best practice principles.

  • Total value creation: incorporate financial, social, and environmental value creation to assess materiality and quantify impacts.
  • Material: focus on SDGs that are financially relevant and where the business has potential to make the most significant positive or negative impact.
  • Quantifiable outcomes: include specific metrics that can be measured so that companies and investors can quantify impacts and track performance over time.
  • Measurable against targets: focus on contributing toward specific SDGs, taking into account geographic differences.
  • Market context: relatable to current responsible investment and ESG reporting frameworks already in use in different sectors.
  • Value chain: consider the full range of positive and negative activities across a corporate value chain from supplies of raw materials to manufacturing operations and the use and disposal of products and services.
  • Comparable: allow investors and other stakeholders to compare performance within and across industry sectors as well as assets classes.

Trucost believes that an SDG framework based on these principles would strike the right balance between being applicable to a wide range of sectors, yet adaptable to sector-specific issues; holistic to incorporate social, environmental, and economic aspects of sustainable development, yet focused to capture the most significant impacts for a business; idealistic to inspire business leaders and employees, yet pragmatic to make good business sense.

Trucost will set out its thinking on SDGs in more detail in a forthcoming discussion paper entitled Moving Forward with SDGs: Metrics for Action.  Go to www.trucost.com for more information.

The posts on this blog are opinions, not advice. Please read our Disclaimers.

What Are Large-Cap Active Managers Up To? A Decomposition of Their Active Sector and Factor Bets (Part I)

Contributor Image
Aye Soe

Former Managing Director, Global Head of Core and Multi-Asset Product Management

S&P Dow Jones Indices

The SPIVA U.S. Mid-Year 2017 Scorecard shows that the relative performance of actively managed domestic equities funds across large-, mid-, and small-cap segments has improved in recent months.  For example, only 56.56% of large-cap equity managers underperformed the S&P 500® for the one-year period, whereas 84.62% underperformed the benchmark at mid-year 2016.[1]  More importantly, when measured on an asset-weighted basis using all the share classes in the large-cap universe, the one-year composite return of active large-cap managers (19.43%) actually outpaced the S&P 500 return (17.90%), leading to an excess return of 1.53% (see Exhibit 1).

Large-cap equity is an asset class that is typically considered to be highly efficient and has historically been difficult for active managers to outperform.  The asset-weighted composite of large-cap active managers outperforming the benchmark over the one-year period has led us to closely examine the sources of (or detractors from) active returns.  Using the holding of actively managed large-cap funds, we look at the traditional sources of long-only active management alpha—sector allocation decisions, security selection, and factor bets—to conduct the performance attribution analysis.

Allocation effect – the decision to overweight and underweight outperforming sectors relative to the benchmark—is a key component of active managers’ value proposition.  To determine allocation effect, we compare the average weight in each of the 11 GICS® sectors held by active large-cap managers relative to the S&P 500 during the measurement period, and the sector contribution to benchmark return as well as the portfolio return.[2]

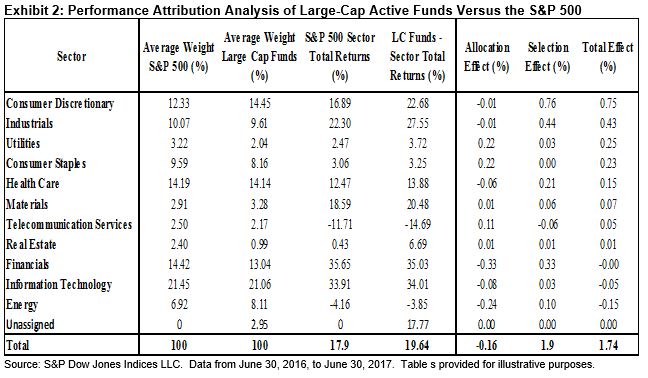
Over the one-year period, information technology was the largest and best-performing sector in the S&P 500, thereby making it the biggest contributor to benchmark return.  It is almost too convenient to assume that improvement in the relative performance of large-cap active managers stems from overweighting that sector.  However, the data shows that, on average, large-cap managers have been maintaining neutral to slight underweight relative to the S&P 500 in information technology (see Exhibit 2).  In fact, the slight underweight in the sector has detracted from managers’ excess returns, as shown by the negative allocation and total effects.

Moreover, in the five sectors that contributed the most to the benchmark returns, large-cap active managers had higher returns than the benchmark, indicating that stock selection skills were at work.  An attribution analysis confirmed that in fact most of the excess return came from selection effect,[3] in which active managers demonstrated their ability to pick winning stocks within each sector.  The 1.74% excess return over the S&P 500[4] came exclusively from stock selection, given that the allocation effect was slightly negative.

In a follow-up blog, we will provide additional framework through which active factor bets taken by large-cap active managers are evaluated.  Similar to the sector attribution analysis, we will use the holdings of large-cap active managers to decompose their risk factor exposures relative the S&P 500.  Together, this series of blogs allow us to better understand the drivers behind the improvement in relative performance of large-cap managers over the past year.

[1] The SPIVA methodology calls for the inclusion of the largest share class per fund in the universe to avoid double counting.

[2] The relationship is mathematically expressed as Allocation Effect = , where W = average weight, p = aggregated average large-cap portfolio, b = benchmark, R = returns, and i =  selected sector or grouping.

[3] The relationship can be mathematically expressed as Selection Effect =  .  We assume that managers are basing their security selection process from the ground up, and therefore we grouped the interaction effect part of the attribution together with the selection effect.

[4] It should be noted that the attribution analysis is conducted from the ground up using the holdings, and the effects are compounded daily; the excess return from the attribution analysis of 1.74% differs from the composi   te level excess return of 1.53%.

The posts on this blog are opinions, not advice. Please read our Disclaimers.

As Markets Await Fed Chair Nomination, U.S. Treasury Curve Continues to Flatten

Contributor Image
Jason Giordano

Director, Fixed Income, Product Management

S&P Dow Jones Indices

President Trump said he will make an announcement during the week of Oct. 30, 2017, regarding his nomination for who will replace Chairwoman Janet Yellen when her term ends in January 2018.  Most reports suggest current Fed Governor Jerome Powell will get the nod over Stanford University economics Professor John Taylor.  Mr. Taylor could still be named to the role of vice chair; however, an announcement on that position is weeks away.  While Mr. Taylor would most likely provide a more hawkish influence, Mr. Powell offers a status quo approach from a monetary policy perspective.  The FOMC continues to communicate its intentions to gradually raise interest rates and normalize its balance sheet while working in a low unemployment, low inflationary environment.

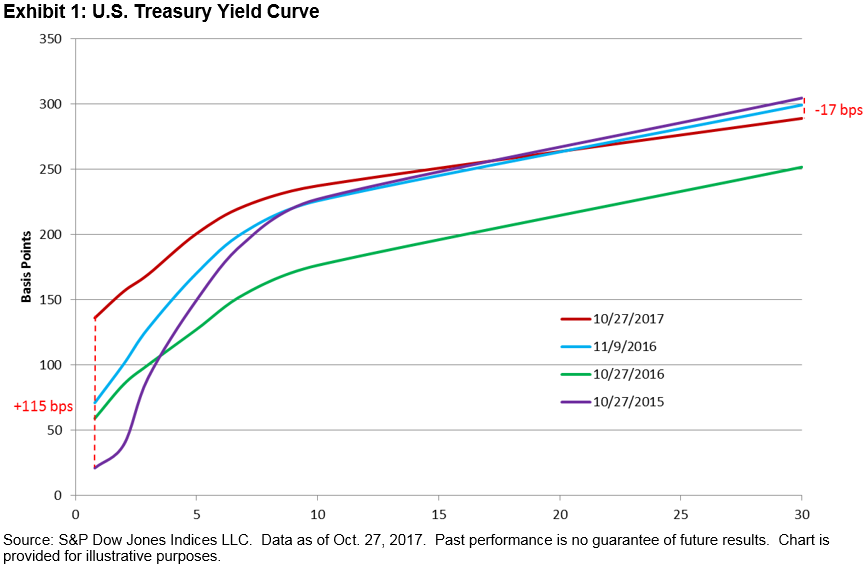
Nearly two years into the current (albeit slow) tightening cycle, the bond market continues to question the prospects for long-term growth.  On Dec. 15, 2015, the Fed raised its rates for the first time since 2005.  Since then, there have been three more rate hikes, for a total of 100 bps.  The two-year yield has increased 115 bps (see Exhibit 1), however the long end of the curve has fallen, producing a much flatter yield curve.  The yield on the 30-year on-the-run bond is actually 17 bps tighter than it was in October 2015 despite the lift in short-term rates.

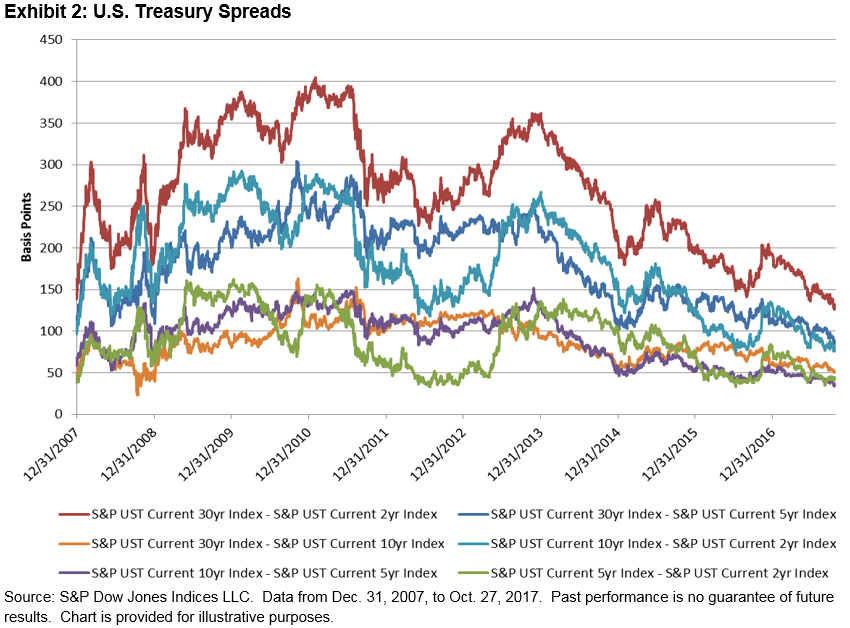
Using the series of S&P U.S. Treasury Bond Current Indices, which is a series of security indices that seek to measure the most recently issued bond for each maturity, we can view yield spreads between key maturity ranges of the yield curve (see Exhibit 2).  In normal economic times, spreads between longer-dated maturities and shorter-dated maturities should be positive, representing a combination of positive growth expectations, positive inflation expectations and, in general, an indication of stable or improving economic conditions.  Conversely, spreads that are contracting may indicate market anticipation of slowing growth, slowing inflation, or worsening economic conditions.

Almost every segment of the yield curve is flatter now than at any time over the past 10-year period (see Exhibit 2).  The 2/30 spread, which represents the majority of the total yield curve, has experienced the greatest amount of flattening and was 270 bps tighter as of October 2017 than its high point in January 2011.

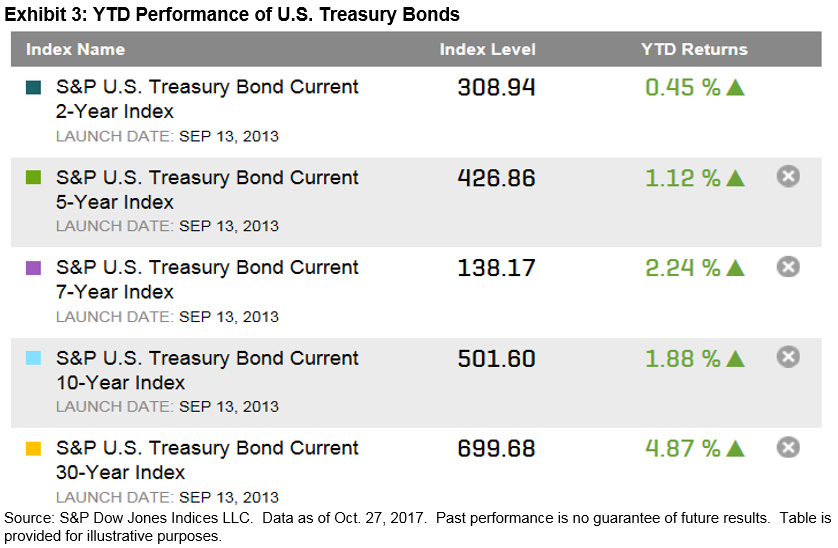
As a result of the overall flattening, U.S. Treasury bonds have performed well in 2017 (see Exhibit 3).  Each of the 2-, 5-, 7-, 10-, and 30-year current indices had positive YTD performance, with the S&P U.S. Treasury Bond Current 30-Year Index returning 4.87% as of Oct. 27, 2017.

The posts on this blog are opinions, not advice. Please read our Disclaimers.

S&P STRIDE Target Date Funds: Making STRIDEs in Evaluating the Performance of Retirement Solutions

Contributor Image
Jack Towarnicky

Executive Director

Plan Sponsor Council of America

Back in the Great Recession of 2008-2009, participants experienced a dramatic stock market decline.  The S&P 500 index had a “peak-to-trough” decline of 51 percent! Coincidentally, many retirees and near-retirees were gaining their initial experience with something called a Qualified Default Investment Alternative (QDIA). The QDIA is a “safe harbor” (Department of Labor Regulation 29 CFR §2550.404c-5, 72 FR 60452 (Oct. 24, 2007) for plan sponsors allowing an investment allocation even if a participant does not provide direction. QDIAs became much more prevalent after plan sponsors took advantage of provisions added by the Pension Protection Act of 2006 (Pub. L. 109-280) and the associated Treasury Regulations §§ 1.401(k)-1(j), (k) (proposed in 2007 and finalized in 2009) to adopt automatic features. Concurrently, on October 24, 2007, the Department of Labor provided regulatory relief to fiduciaries in selecting a QDIA (Department of Labor Regulation 29 CFR §2550.404c-5 (see above).

The most prevalent QDIA is a Target Date Fund (TDF). A TDF automatically rebalances its asset allocation to follow a predetermined pattern known as a glide path to ensure the participant’s account is allocated in an ever more conservative fashion.  When used as a QDIA, a plan sponsor will typically select a TDF of the year ending in 0 or 5 that is closest to a participant’s 65th birthday. For example, someone born in 1960 might have a Target Date 2025. The TDF investment allocation is structured to anticipate benefit commencement in that target year or soon thereafter.

In 2008-2009, most participants at or near age 65 had a Target Date of 2010.

It turned out that every TDF had its own definition of more conservative, or what constitutes a lower-risk allocation. At that time, Morningstar found short-dated funds, like 2010 target date funds, had the widest range of allocations to equity investments that: “… span a startling range of equity allocations – from 72 percent to 26 percent. Unsurprisingly, series that had higher equity weightings typically trailed the more conservative offerings in 2008.” (See Morningstar, Inc. Target date Series Research Paper, 2009 Industry Survey, September 9, 2009)

The importance of such distinctions was often lost on plan sponsors, fiduciaries, and participants. Certainly, during the 2008-2009 Great Recession, Target Date 2010 fund performance varied dramatically from participant expectations, triggering hearings in the U.S. Senate Special Committee on Aging, and expert testimony to the Department of Labor, the Securities & Exchange Commission, plus representatives from the Senate Special Committee on Aging, June 18, 2009. Retirees and near retirees had experienced a drastic, abrupt decline in their account balance, sometimes in excess of 50 percent. That decline translated into a significant reduction in retirees’ and near retirees’ expectations about retirement income and consumption.

That dramatic result also helped expose a significant concern: To what extent can retirees or soon-to-retire workers rely on their Target Date Fund to be properly positioned for generating income (financing consumption)?

Since then, mutual fund providers have been analyzing alternatives that might reduce the volatility in retirement income/consumption. For example, S&P Dow Jones Indices and Dimensional Fund Advisors (Dimensional) completed a study that considered how many TDF strategies compare with a new index—STRIDE (Shift to Retirement Income and DEcumulation) Index Series. The study found that the index series is a fitting benchmark for TDF strategies that are designed to be used throughout both the accumulation and decumulation period, and that focus on reducing fluctuations in expected retirement income and consumption. STRIDE was compared against the average of 2010 Target Date funds. The period studied was 2003 – 2016, which includes the market decline during the Great Recession. Researchers identified the three main investment risks that drive uncertainty around future consumption in retirement: market risk, interest rate risk, and inflation.

These indices use a glide path that transitions from growth-seeking assets (40 years prior to the projected target date) to assets that can support a more stable level of inflation-adjusted, in-retirement income (for a 25-year period after the target date). The goal is to identify a retirement investment solution that manages uncertainty about how much in-retirement income a saver’s balance can generate.

STRIDE’s structure varies noticeably from that of the average 2010 TDF. The STRIDE glide path reduces equity allocations starting 20 years prior to the target date, where the goal allocation at the target date is 75 percent Treasury Inflation Protection Securities and 25 percent equities. Other Target Date fund allocations vary significantly, in part based on a fund’s strategy of either “to” or “through” retirement. Some TDFs have a “to” goal reflecting a higher degree of safety and liquidity – participants in these funds might use the funds to purchase an annuity.  Other TDFs have a “through” goal anticipating investors will hold onto assets after age 65, reflecting a longer time horizon.

In regards to a “to” or “through” glide path – S&P Dow Jones Indices and Dimensional found that a STRIDE structure where the target date matches the anticipated commencement of payouts may result in less volatility in a participant’s expected income/consumption in retirement. Studies show a majority of plans now use TDFs (see above (GAO), see also: ICI Factbook, Figure 7.14 ). Alternatives that may avoid wide swings in estimated retirement income/consumption may be of interest to plan sponsors as more and more participants are leaving assets in the plan following separation/retirement.

The posts on this blog are opinions, not advice. Please read our Disclaimers.