Get Indexology® Blog updates via email.

In This List

Winners and Losers in Trump’s Electoral Surprise

Why Consistency of Dividend Growth Matters

The Making of a Passivist

Is Passive Growing Actively?

Examining Sector and Factor Performance in the Third Quarter of 2016

Winners and Losers in Trump’s Electoral Surprise

Contributor Image
Tim Edwards

Managing Director, Index Investment Strategy

S&P Dow Jones Indices

Donald Trump’s unexpected success initially threatened to send the U.S. equity markets into steep decline.  Yet as I write, the S&P 500 has moved very little since yesterday’s close (it is up a little), while the VIX has fallen dramatically.

So why (or how) has volatility remained so low this morning when everyone expected it to rise?  One reason may be that stock-level volatility has risen, but correlations have dramatically fallen.

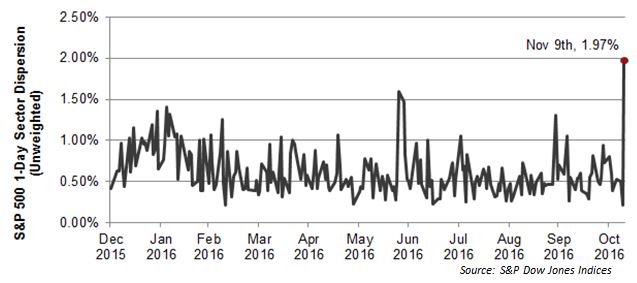
A quick calculation using sector data suggests the higher dispersion in stock-level returns.  The chart shows the standard deviation among the 11 sectoral daily returns, So far today (as of 1pm EST) it is at the highest level this year.  There is volatility, but the winners are cancelling out the losers.

sp

Higher dispersion – which was already rising in advance of the election, means a greater difference between winners and losers.  Today’s increase in dispersion – which may well prove temporary – is an indication of the degree to which Trump’s presidential victory, and continued Republican control of the Senate, were not appreciated by yesterday’s market consensus.

The posts on this blog are opinions, not advice. Please read our Disclaimers.

Why Consistency of Dividend Growth Matters

Contributor Image
Kieran Kirwan

Director, Investment Strategy

ProShares

With anemic global economic growth, investors have become leery about U.S. companies’ ability to grow earnings and increase dividends.

Indeed, S&P 500 earnings declined for the fifth consecutive period in the second quarter of 2016 and even if the third quarter results are positive, the growth rate is likely to be very small. A potential consequence of this “earnings recession” is that future dividends could be at risk. Earnings are an essential driver of dividends, and ultimately returns, so there is good reason for concern.

But there’s an exclusive group of companies that may provide an answer. The S&P 500 Dividend Aristocrats® Index includes high quality companies that have increased their dividends every year for at least 25 consecutive years. How are these companies able to continually grow dividends? One answer is by delivering earnings growth. The S&P 500 Dividend Aristocrats have delivered positive annual earnings growth for the first two quarters of 2016 in amounts that were substantially higher than the broad market.

capture

Source: Morningstar, ProShares, May 2, 2005–June 30, 2016. Index performance is for illustrative purposes only and does not reflect any management fees, transaction costs or expenses. Indexes are unmanaged and one cannot invest in an index. Past performance does not guarantee future results.

The Take Away
Historically, the Dividend Aristocrats have grown their dividends on a more consistent basis and at a higher compound rate than the broad market, underscoring their quality and potential for strong performance. Since inception of the index, the Aristocrats have delivered higher returns with lower volatility than the S&P 500.

The posts on this blog are opinions, not advice. Please read our Disclaimers.

The Making of a Passivist

Contributor Image
Craig Lazzara

Former Managing Director, Index Investment Strategy

S&P Dow Jones Indices

I have few memories of my school French, but one of the fondest is of Moliere’s Monsieur Jourdain, who was delighted to learn in middle age that he had been speaking prose for the last 40 years.  Similarly, I did not realize until recently that I was a “passivist,” as the Wall Street Journal has now anointed the advocates of passive investment.

Upon reflection, I’ve concluded that passivists are made, not born, and they’re made not by theoretical argument but rather by a series of empirical observations.  The first of these is that most active managers fail most of the time, at least if we define “success” as active outperformance of passive benchmarks.  This is powerfully illustrated by our SPIVA scorecards, but the observation that most active managers underperform is not new and is hardly original to us.  Charles Ellis identified active management as a “loser’s game” more than 40 years ago, and more than 40 years before that, Alfred Cowles made a similar argument.

Second, when active success occurs, it tends not to persist.  Our persistence scorecards demonstrate that an investor has a better change of flipping a coin and getting four heads in a row than he does of identifying a fund manager who will be above average four years in a row.  This observation about the population of active managers does not mean that individual managers cannot be exceptions; famous examples like Warren Buffett and Peter Lynch come immediately to mind.  But Buffett and Lynch are famous precisely because they are exceptional.  If most active managers could outperform consistently, we wouldn’t know the names of the handful that do.

Third, a new generation of index products makes it possible to indicize strategies which were formerly the exclusive preserve of active managers.  Smart beta or factor indices provide exposure to a wide range of additional factors which investors may find attractive.  Importantly, factor indices make life more challenging for active managers.  Consider, e.g., an active manager who historically has tilted away from his cap-weighted benchmark in a systematic way (perhaps by emphasizing value, or small size, or low volatility).  The manager’s clients have had no way of disentangling how much of his performance is attributable to factor tilts and how much is attributable to stock selection beyond the factor.  Now, factor indices make it possible for the client to obtain access to the factor itself, without the manager’s stock selection, and to do so transparently and at low cost.

These observations mean that the ranks of the passivists are likely to continue growing.

The posts on this blog are opinions, not advice. Please read our Disclaimers.

Is Passive Growing Actively?

Contributor Image
Koel Ghosh

Former Head of South Asia

S&P Dow Jones Indices

Global events this year have been transitional in nature, signaling change.  Examples of significant developments include the result of the Brexit vote, with the UK officially set to leave the EU and the new Prime Minister, Theresa May, preparing for upcoming changes, as well as the 58th U.S. Presidential election, which is empowering electors to choose their 45th president.

We are witnessing changes in passive investing as well.  Q3 2016 reached a record high USD 3.408 trillion in ETF/ETP assets listed globally.  Third quarter statistics showed the global industry at 6,526 ETFs/ETPs, with 12,386 listings from 284 providers listed on 65 exchanges in 53 countries.[i]

This growth in passive investing has been fueled by a number of factors, including technology, regulation, costs, and doubts about the persistence of active fund manager performance.  Economies of scale and advanced technology have put fees under pressure.  Increased transparency and regulation have also set the ball in motion.  There appears to be a growing realization of the scope of products and options that passive routes can provide, along with growing popularity of smart beta and factor investing.

ETFs are an innovation that potentially lower costs as a result of fewer intermediaries, reduced administration expenses, lower marketing costs due to the availability of online platforms, and a move toward increased automation.  Robo-advisory has also become more prominent, and index-based investing may be the greatest beneficiary.

Pure passive strategies are now being challenged with lower a cost, which aids the implementation of core-satellite strategies.  Many market participants use this strategy to manage their investment strategy, either keeping their core passive and satellites active or vice versa.

In India, the trend of passive investing is growing.  Although market conditions are still offering alpha to active fund managers, some market participants are moving toward index-based investing. We are seeing this shift if they are interested in market beta or a passive approach, to apply certain investment selection factors in order to offer differential options.

The growing scope of passive investing could increase the smart beta space.  Global assets in smart beta have seen growth of nearly 40% from 2010 to 2015.[ii]  Smart beta investing, simplistically defined as investment strategies that consider factors such as low volatility, quality, momentum, value, etc., may provide low cost and transparent, easy access to return that was previously believed to be available from active management only.

So can we expect an actively growing passive space?  Let us wait and watch.

[i]   etfgi.com

[ii]   etfgi.com

The posts on this blog are opinions, not advice. Please read our Disclaimers.

Examining Sector and Factor Performance in the Third Quarter of 2016

Contributor Image
Nick Kalivas

Senior Equity Product Strategist

Invesco

High beta, value factors among the star performers, while low volatility lags amid heightened appetite for risk

The high beta, value and size factors outperformed the broad-market S&P 500 Index by a sizeable margin during the third quarter, with the S&P 500 High Beta Index gaining 12.18% during the three-month period – outpacing all other factor indexes. The S&P 500 Index rose a healthy 3.85%, but 14 smart beta strategies and two smaller-cap indices – the S&P SmallCap 600 Index and S&P MidCap 400 Index – all outperformed the broader market.

There was a nearly 14.70% total return gap between the best-performing factor (high beta) and the poorest-performing factor (low volatility) during the third quarter. This dispersion was greater than the second quarter’s performance gap, but less than that of the first quarter, which saw significant market volatility. Year-to-date, there has been an even wider performance chasm from top to bottom, with the Nasdaq Dividend Achievers 50 Index up 22.6% and the Russell Top 200 Pure Growth Index down 0.22%. This dispersion underscores the differentiated return streams of factor-based strategies.

 capture

As you can see from the performance table above, some of the worst performers in the first quarter of the year turned out to be the best performers in the third quarter. Conversely, some of the best performers in the first quarter lagged in the third quarter. This is not unusual and again speaks to the diversification potential of factor-based strategies.

During the third quarter, the high beta factor benefited from heavy exposure to financials and energy stocks and limited exposure to utilities and consumer staples. Value-based strategies, represented by the Russell 2000 Pure Value Index and the Russell Top 200 Pure Value Index, also had significant exposure to financial and energy stocks, which boosted their returns.

High beta and value strategies were also buoyed by an improved economic backdrop. The ISM Index, considered a barometer of US industrial activity, jumped from 52.7 in May to 56.1 in June – its highest level since October 2015. Moreover, non-farm payrolls rose by more by than 270,000 in both June and July.

Narrowing credit spreads hint at increased risk tolerance
The improved outlook for economic growth led to a drop in high yield credit spreads during the quarter. The BarCap U.S. Corporate High Yield-to-Worst 10-year Treasury spread fell from 5.81 to 4.58, while the US 10-year Treasury yield bottomed out at 1.32% on July 6.1 Volatility, in the form of VIX, eased during the third quarter, falling from 15.63 to 13.20.1 Although the economy appeared less vibrant in September, a bias toward higher interest rates, a downward slant in high yield spreads and benign volatility were all favorable for investor risk taking.

Macro factors may not completely explain the favorable impact of energy exposure on value stocks and high beta based indices; stock selection was also important to energy sector returns. The 12-month Bloomberg Nymex Crude Oil Strip 12-Month Strip Futures Price Index finished the quarter at $50.46 – down marginally from Q2, but still above $50 for the second consecutive quarter. The rebound in oil prices coincided with OPEC’s decision to cut production in late September.1

Year-to-date, the Nasdaq Dividend Achievers Index has been the strongest performer – driven by energy and utilities and solid stock selection in financials, staples and industrials. The combination of dividend growth and yield was positive during the first half of 2016, and led to only slight underperformance in the third quarter.

What’s behind the performance of high beta stocks?
The strong quarterly performance of high beta stocks makes sense when you consider that high beta can outpace low volatility during periods of rising 10-year Treasury yields and stronger economic growth, when investor demand for defensive stocks may ease. The charts below depict this relationship.

capture

capture


The posts on this blog are opinions, not advice. Please read our Disclaimers.