Get Indexology® Blog updates via email.

In This List

$60 Trillion – Yes, Trillion – Committed to Investing This Way

The Worst of Both Worlds

Rieger Report: "Belly of the Curve" Good for Muni & Corporate Bonds

Rieger Report: High Yield Domination

Commodities Post Best September in Six Years

$60 Trillion – Yes, Trillion – Committed to Investing This Way

Contributor Image
Reid Steadman

Former Managing Director, Global Head of ESG & Innovation

S&P Dow Jones Indices

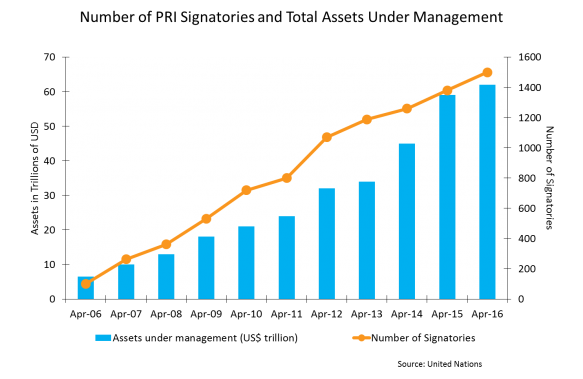
Index providers often work with large pensions and asset managers, so it’s difficult to surprise us with big numbers. Recently, though, I saw a chart with some staggering sums. I am pasting it below.
pri

What is the PRI?
This chart shows the investment world’s adoption of the “PRI”, the Principles for Responsible Investment. In 2006, the United Nations, under the leadership of Kofi Annan, established six principles to serve as standards for how to invest. These are:

  1. Incorporate ESG issues into investment analysis and decision-making processes.
  2. Be active owners and incorporate ESG issues into our ownership policies and practices.
  3. Seek appropriate disclosure on ESG issues by the entities in which we invest.
  4. Promote acceptance and implementation of the Principles within the investment industry.
  5. Work together to enhance our effectiveness in implementing the Principles.
  6. Report on our activities and progress towards implementing the Principles.

The term “ESG” refers to “environmental, social, and governance” issues. These have developed into major themes in the investment and corporate world, and the PRI has become a leading initiative defining what these concepts mean.

As the chart shows, the PRI has been a remarkable success by certain measures. Companies managing over $60 trillion have signed the PRI. A full list of signatories can be found here. It’s possible that the company you work for has signed.

Criticisms and Support
Support for the PRI has been nearly universal. When companies sign up, they typically issue an announcement to congratulate themselves and to publicly support the project (see here and here and here). But the Principles have some critics. In 2013, some large Danish investors backed out of the PRI, for – ironically – lack of good governance by the entity overseeing the project.

Other criticisms I have heard at conferences and in other settings are that the principles are (a) too broad, (b) don’t require sufficient accountability, and (c) don’t actually result in change. The large number of signatories also raises this question. If 1,500 institutions with $60 trillion in assets can quickly sign up, how demanding can these principles be?

Moving Forward
These criticisms shouldn’t be dismissed, but they shouldn’t make us turn our backs on these Principles either. As Harvard noted when it joined, the Principles for Responsible Investment are part of an evolution, a “step” in the right direction that will result in professional investors striving to do a little better.


The posts on this blog are opinions, not advice. Please read our Disclaimers.

The Worst of Both Worlds

Contributor Image
Craig Lazzara

Former Managing Director, Index Investment Strategy

S&P Dow Jones Indices

For active managers, investment results are partly a function of skill and partly a function of the environment in which that skill is exercised.  Even perfect foresight has only conditional value.  Imagine, for example, a manager who can always identify the top quintile of performers in a given market.  If the top quintile outperforms the index as a whole by 20%, that will make for spectacular value added.  If its outperformance is only 2%, the results are much less inspiring — but the manager’s skill is the same in both cases.

The value of a manager’s skill is influenced by the dynamics of the market within which he works — specifically, by the universe’s dispersion and correlation.  Correlation is a measure of timing.   Loosely stated, if correlations are high, it means that the components of an index are moving up and down at the same time; if correlations are low, gains in some stocks are being offset by losses in others.  Dispersion, in contrast, is a measure of magnitude.  If dispersion is high, it means that the gap between the best-performing stocks and the laggards is wide; if dispersion is low, it means that the gap between the best and worst performers is narrow.

Neither correlation nor dispersion tells us anything about a manager’s stock selection skill — but dispersion, in particular, has an important influence on the value of that skill.  When dispersion is high, good stock pickers can outdistance their less-talented or less-lucky competitors.  When dispersion is low, the gap between the best and worst managers narrows, and generating excess returns for clients becomes more difficult.  Correlation helps us to understand the benefits of diversification, but as a gauge of stock selection strategies, it is less important than dispersion.  Other things equal, however, lower correlation is better for active managers than higher correlation — especially for a strategy with rapid turnover.

In September, dispersion fell to below-average levels in every market we follow.  Correlations, though not terribly elevated in absolute terms, were typically well above average.  Neither of these developments is auspicious for active managers.  Unless the dispersion-correlation map changes, active alpha should continue to be elusive.


The posts on this blog are opinions, not advice. Please read our Disclaimers.

Rieger Report: "Belly of the Curve" Good for Muni & Corporate Bonds

Contributor Image
J.R. Rieger

Former Head of Fixed Income Indices

S&P Dow Jones Indices

Through October 3rd, the S&P Municipal Bond Index has returned 4.23% year-to-date and the S&P 500 Bond Index has returned 8.97%.  The 7 – 10 year maturity range has outpaced the overall benchmarks in both cases.

The average yield of bonds in the S&P 500 7-10 Year Investment Grade Corporate Bond Index has fallen by 94bps since year end as the yield thirsty market place has hunted yield oriented products.  As a result, the index has seen a year-to-date total return of 9.15%.

The 7 – 10 year range of the municipal bond market has kept pace with U.S. Treasury bonds and nominal yields remain comparable to U.S. Treasury bonds.  Meanwhile, taxable equivalent yields of the non-callable municipal bonds in that maturity range remain significantly higher and more in line with U.S. corporate bonds.  Municipal bonds are sensitive to new issue supply and retail investor sentiment which can change the yield relationships between municipals and other asset classes.

Table 1) Select indices, their year-to-date returns and yields as of October 3rd, 2016:

*Taxable Equivalent Yield assumes a 39.6% tax rate. Source: S&P Dow Jones Indices, LLC. Data as of October 3rd, 2016. Table is provided for illustrative purposes. It is not possible to invest directly in an index. Past performance is no guarantee of future results.

The posts on this blog are opinions, not advice. Please read our Disclaimers.

Rieger Report: High Yield Domination

Contributor Image
J.R. Rieger

Former Head of Fixed Income Indices

S&P Dow Jones Indices

High yield bonds have been marching along and putting up returns that are dominating the investment grade bond markets.

U.S. junk bonds continue to have no stink to them as demand for yield far outweighs the supply and seemingly the credit risks associated with these bonds.   The bonds of larger entities tracked in the S&P 500 High Yield Corporate Bond Index have returned 15.57% year-to-date modestly out performing the broader S&P U.S. High Yield Corporate Bond Index.  The S&P 500 High Yield Corporate Bond Index tracks the junk bonds of issuers of the S&P 500 and as the yields indicate, on average, they tend to be better quality than the bonds in the broader index.

Floating rate senior loans, as tracked by the S&P/LSTA U.S. Leveraged Loan 100 Index have returned over 8.5% year-to-date and are yielding just 110bps lower than fixed rate high yield bonds. Demand for yield combined with the benefits of floating rate interest payments and better security provisions than fixed rate junk bonds all helps to draw attention to this asset class.

High yield municipal bonds have also been in demand and also have benefited from a rally in Puerto Rico bonds. The S&P Municipal Bond High Yield Index, which includes Puerto Rico bonds has returned just about 9.5% year-to-date.  Without Puerto Rico bonds the index would have returned 8.19% year-to-date.

Table 1) Select indices, their year-to-date returns, yields and total market value as of September 30th, 2016:

Source: S&P Dow Jones Indices, LLC. Data as of September 30th, 2016. Table is provided for illustrative purposes. It is not possible to invest directly in an index. Past performance is no guarantee of future results.

The posts on this blog are opinions, not advice. Please read our Disclaimers.

Commodities Post Best September in Six Years

Contributor Image
Jodie Gunzberg

Former Managing Director, Head of U.S. Equities

S&P Dow Jones Indices

The S&P GSCI Total Return gained 4.1% in Sep., cutting the loss in the 3rd quarter to 4.2% and bring its year-to-date performance to 5.3%.  19 of 24 commodities were positive in Sep., from just 8 in Jul., the most to turn from negative to positive in two months since Jul. 2012. Energy gained 6.1%, making it the best performing sector and livestock performed worst of the sectors, losing 12.1%. The winning single commodity in Sep. was unleaded gasoline, gaining 11.4% and lean hogs lost 22.1%, the most of any commodity.

While the overall month was positive, the index was filled with extremes. Lean hogs and feeder cattle are having their 2nd worst months in history, the worst since Dec. 2003 and Aug. 2002, respectively.  This drove livestock to return its 7th worst month ever since Dec. 2003 when it lost 15.8%.  On the other hand, sugar and lead each posted 11.3% gains this month.

Adjusting for seasonality by looking only at historical months of Sep., while feeder cattle and lean hogs had their worst Sep. yet, it was the 3rd best ever for lead, 4th best for nickel and 5th best for aluminum, brent crude, gasoil, Kansas wheat and unleaded gasoline. It was also a strong Sep. in history for two sectors, agriculture posted its 6th best Sep. and industrial metals posted its 8th best Sep. Overall the S&P GSCI gained its first positive and best total return in Sep. since 2010, when it gained 8.5%.

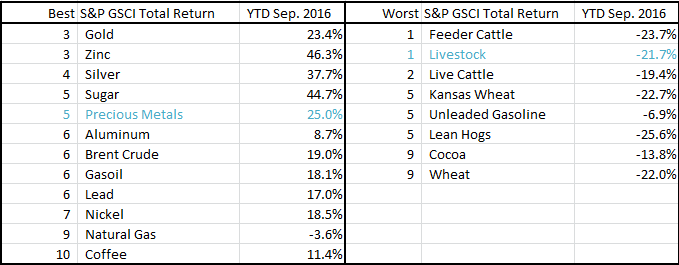
Commodities are on pace to have several big winners and losers this year.  Thus far gold and zinc are set to have their 3rd best years in history while feeder cattle is set to post its worst year.  Below is a table of commodities that are closest to be on pace for record setting years. Although natural gas is having one of its best years, it is still negative – it has only ever been positive six times through the year at this point.

Source: S&P Dow Jones Indices

The S&P GSCI loses 74 basis points on average historically in the 4th quarter that is has been the worst performing quarter and is the only quarter that loses on average.  Energy is known to have its worst quarter at the end of the year but some commodities in industrial metals and agriculture perform at their best in the last quarter.  Since energy holds more weight and tends to drag other commodities down with it, only time (and fundamentals) will tell if commodities will end positive for the first year since 2012.

Source: S&P Dow Jones Indices


The posts on this blog are opinions, not advice. Please read our Disclaimers.