Similar to the Venn diagram in which the overlapping section of circles is the focus, the S&P U.S. High Quality Preferred Stock Index is designed to measure preferred securities that are constituents of both the fixed-rate and investment-grade preferred stock indices.
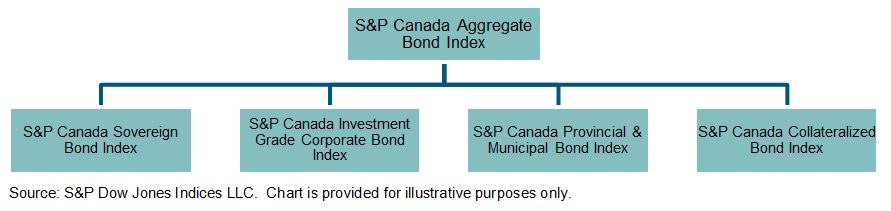
Exhibit 1: S&P U.S. Preferred Stock Indices Hierarchy
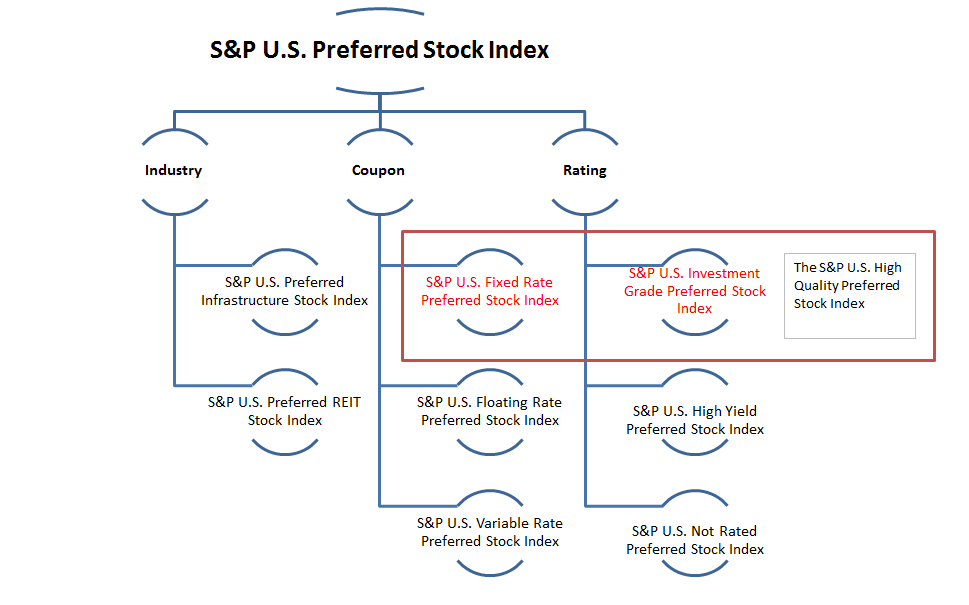
The weight of cumulative preferred stocks is set at 75%, while the weight of the non-cumulative category is set at 25%, subject to issuer limit. Within each category, securities are equally weighted. To reduce concentration risk, the maximum weight of each issuer is capped at 22.5% at each quarterly rebalancing.
As of June 17, 2016, the S&P U.S. High Quality Preferred Stock Index had returned 1.40% YTD, while the broader . The high-quality index includes investment-grade constituents only, whereas 44% of the broader preferred index includes speculative-grade stocks and another 14% is not rated. Similar to corporate bonds, preferred stocks are sensitive to changes in interest rates, however, also similar to equity, preferred stocks exhibit more volatility than most fixed income asset classes.
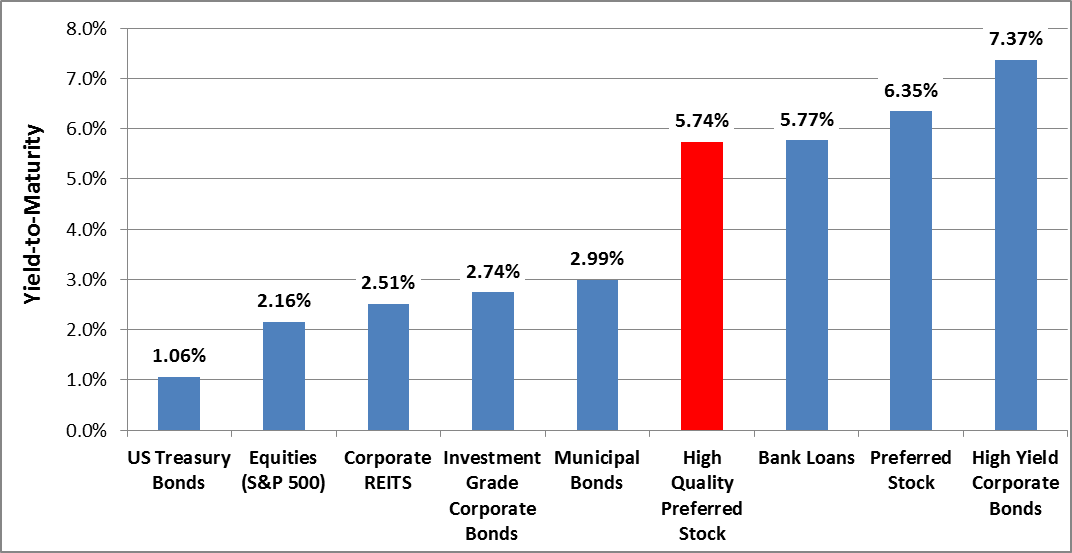
Along with portfolio diversification, preferred stocks can enhance overall yield. Current yields, as of June 17, 2016, are almost three times higher than those of equities.
Exhibit 2: Multi-Asset Yield Comparison
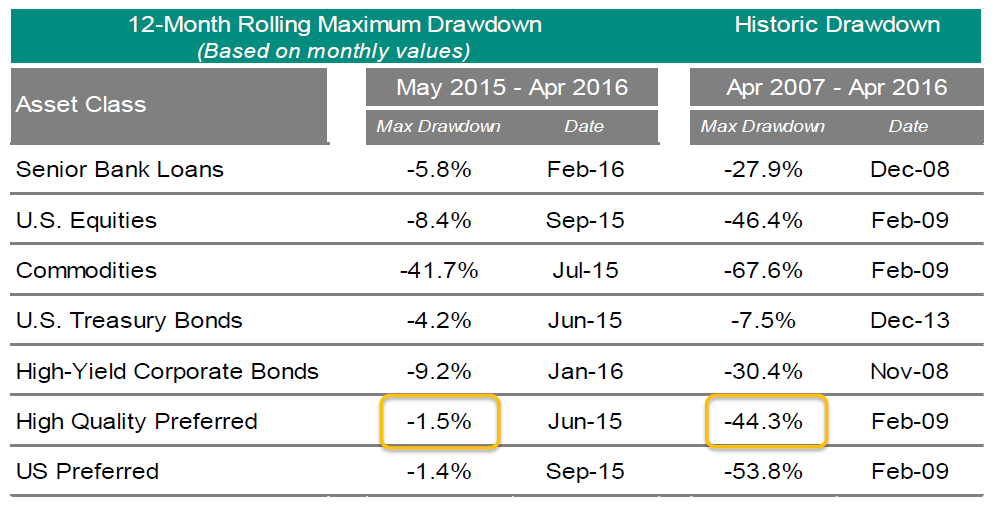
According to Graham Day, the Senior Vice President at Elkhorn, “investment grade and cumulative preferreds have historically provided lower drawdowns compared with the broader preferred market.”[1]
Exhibit 3: Historic Drawdown Table
[1] Bill Conboy, May 24, 2016, “Elkhorn Launches the First High Quality Preferred ETF (BATS: EPRF).”
The posts on this blog are opinions, not advice. Please read our Disclaimers.
 Source: S&P Dow Jones Indices LLC. Data as of June 13, 2016. Chart is provided for illustrative purposes.
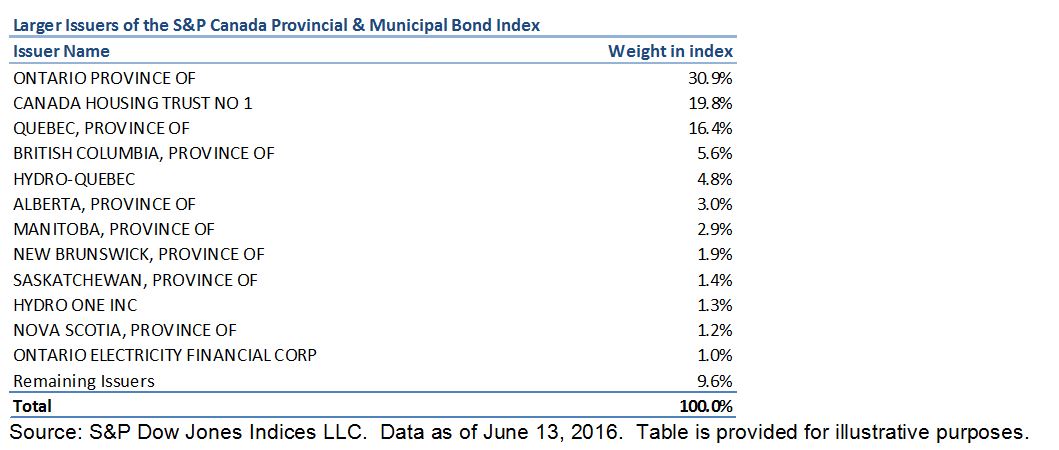 The
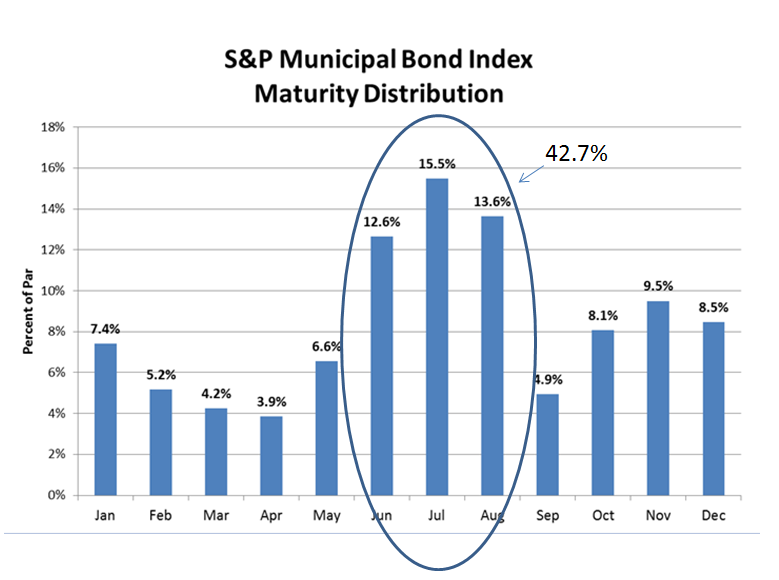
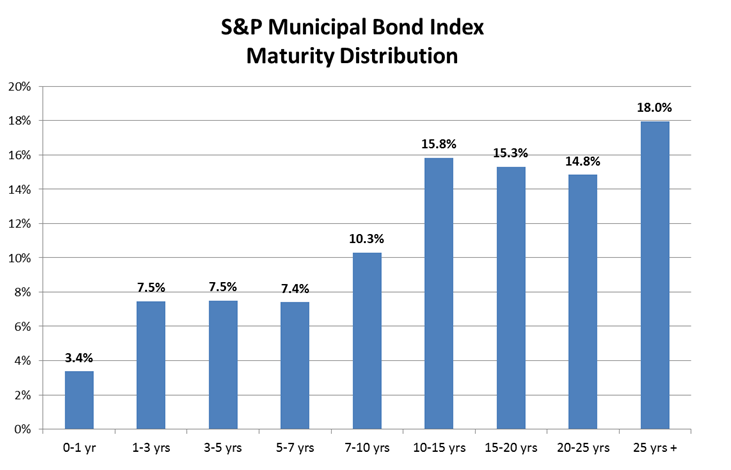
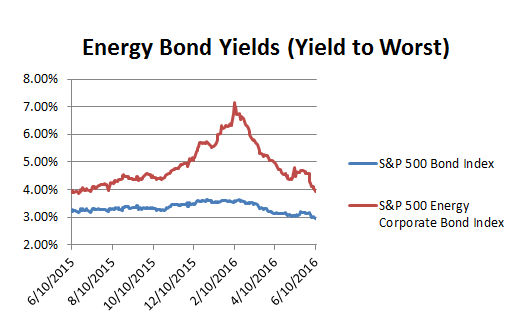
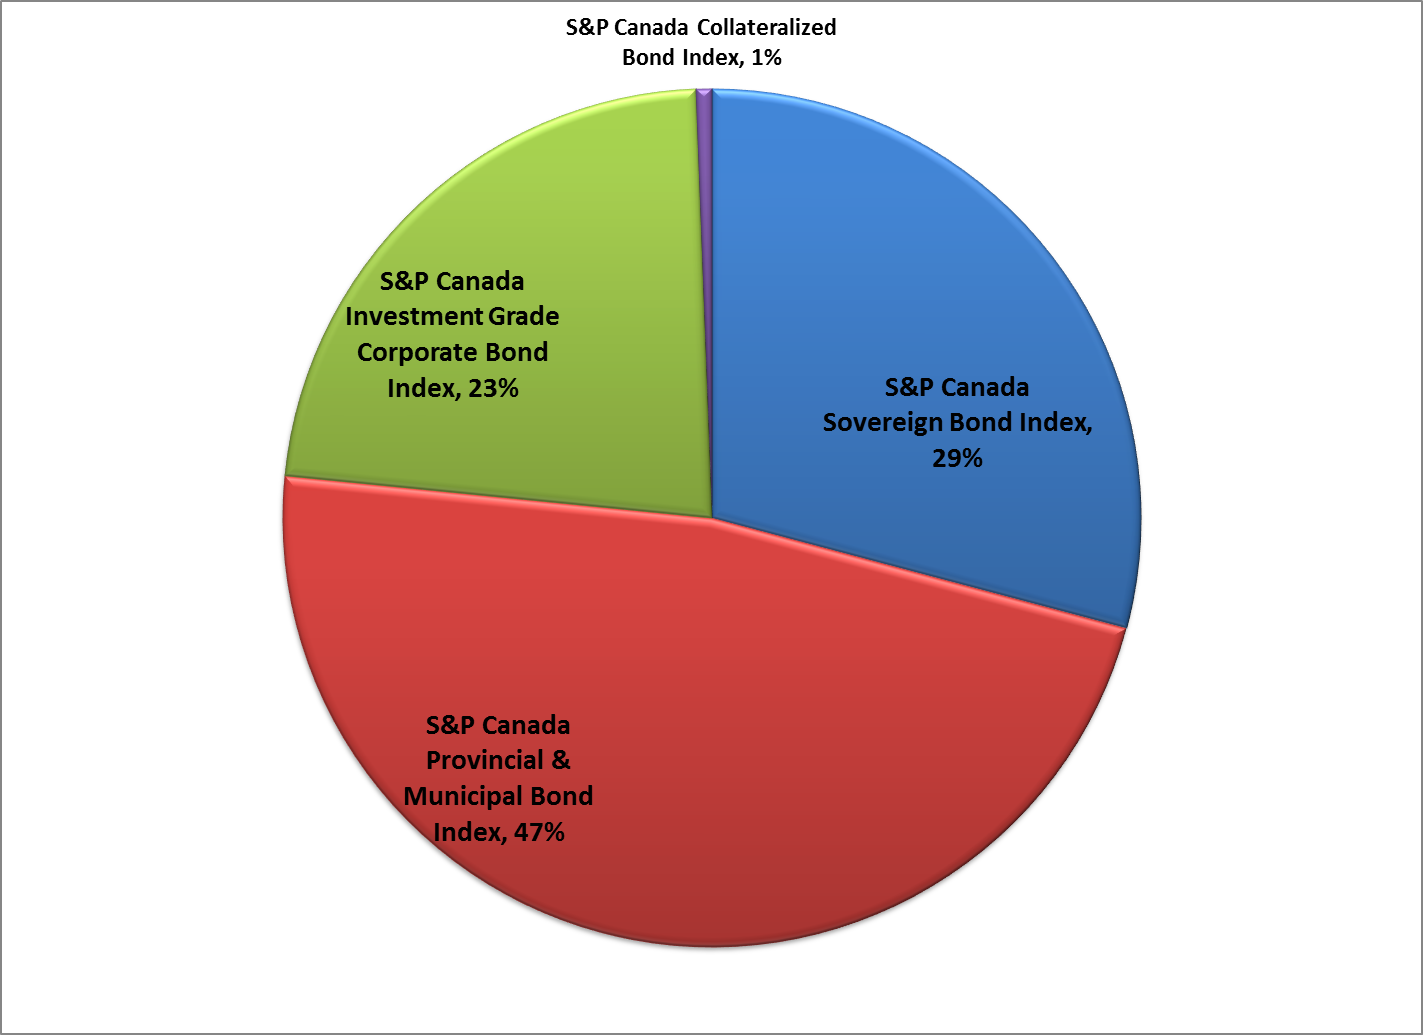
The 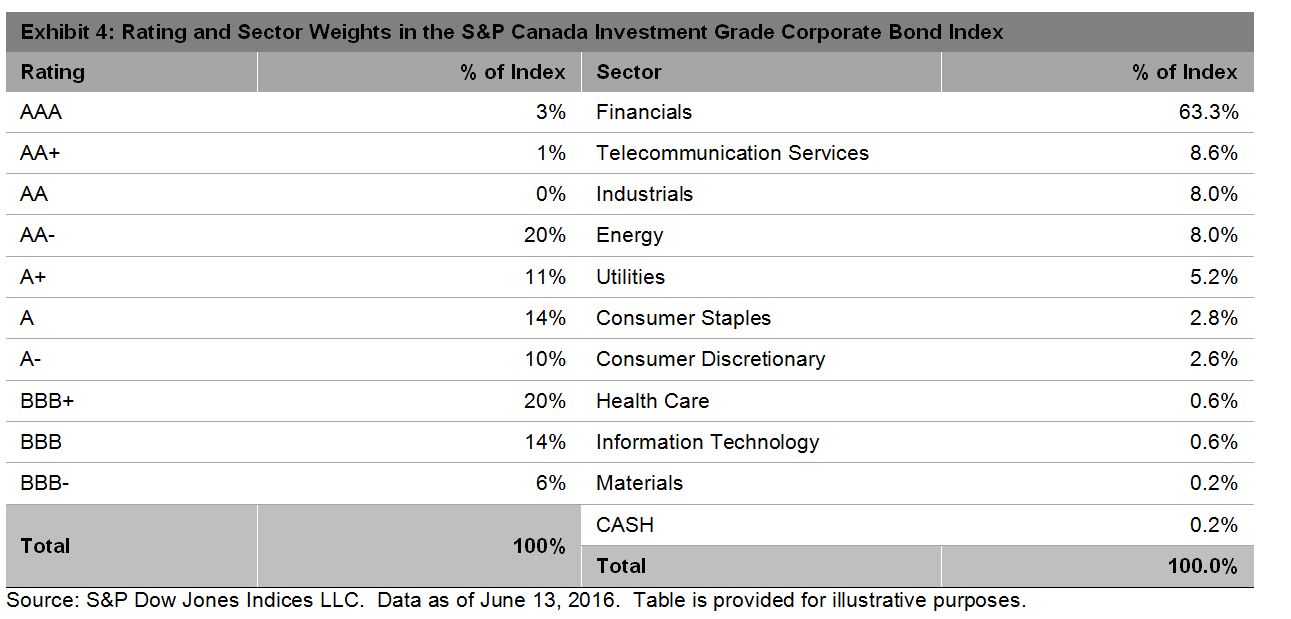 The collateralized sector of the market accounts for a small percentage of the index, less than 1%. The