Get Indexology® Blog updates via email.

In This List

Asian Fixed Income: A Quest for High-Quality Chinese Corporate Bonds

Rieger Report: Consumer Driven Economy? Uh Oh

Rieger Report: Oil State Municipal Bonds Doing Fine

Eurozone Corporates Gets an ECB Kickstart

Safe Spread Alternative: The S&P 500® Corporate Bond Index

Asian Fixed Income: A Quest for High-Quality Chinese Corporate Bonds

Contributor Image
Michele Leung

Former Director, Fixed Income Indices

S&P Dow Jones Indices

In a previous piece, we highlighted the emerging credit risk in Chinese corporates. Nevertheless, a recent survey reinforced the belief in the long-term future of China’s onshore bond market and pointed to an expected increase in exposure to Chinese bonds.[1]  As China’s bond market continues to grow, it may be important for market participants to identify high-quality corporate bonds.

Traditionally, market participants have used credit ratings to assess the creditworthiness of the borrower and as consistent standards so they could make comparisons across geographies and sectors. However, Chinese onshore corporate bonds are not typically rated by international rating agencies at the bond level; only selective issuer-level ratings are available.

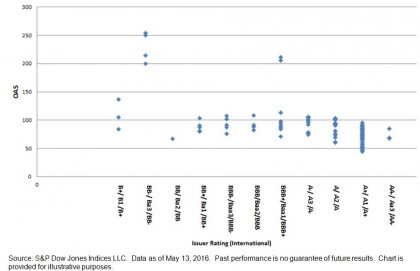
Using the S&P China Industrials Bond Index as an example, around 30% of the bonds that the index seeks to track is rated ‘AAA’ by one of the domestic rating agencies, and among those, only 22% are rated by international rating agencies on the issuer level.  Looking at the industrial bonds that got both ‘AAA’ domestic ratings (bond level) and international ratings (issuer level), the credit quality observed varies largely; i.e., the international ratings ranges from ‘B+’/‘B1’ to ‘AA-’/‘Aa3.’  Exhibit 1 shows the range of option-adjusted spreads (OAS) across the international ratings (issuer level) for those industrial bonds, which further illustrates the broad diversity within the ‘AAA’ domestic rating band.  In comparison, while Yanzhou Coal and China Shenhua both have ‘AAA’ domestic ratings and from the energy sector, Yanzhou Coal is rated ‘BB-’ by an international rating agency (issuer level) with an OAS around 250, and China Shenhua has an international rating (issuer level) of ‘AA-’/‘Aa3’ with an OAS of 70.

In response to concern related to the discrepancies between Chinese domestic and international ratings, we launched the S&P China High Quality Corporate Bond 3-7 Year Index, which is designed to measure higher-quality corporate bonds.  In search of higher quality, we adopted a two-tier screening approach in our index design.  First, issuers must be rated investment grade by at least one of the international rating agencies, and second, securities must be rated ‘AAA’ by at least one of the local Chinese rating agencies.  Interestingly, the one-year total return of the S&P China High Quality Corporate Bond 3-7 Year Index was 6.61% as of May 16, 2016, outperforming its benchmark, the S&P China Corporate Bond Index, which returned 6.18% over the same period.

[1]   Asian Bond Investor Survey from Finance Asia, June 2016.

Exhibit 1: S&P China Industrials Bond Index–International Rating (Issuer Level) Profile for ‘AAA’ Domestic Rating (Bond Level)20160516

The posts on this blog are opinions, not advice. Please read our Disclaimers.

Rieger Report: Consumer Driven Economy? Uh Oh

Contributor Image
J.R. Rieger

Former Head of Fixed Income Indices

S&P Dow Jones Indices

The credit default swap (CDS) market is beginning to show spreads widening for consumer discretionary entities which is a bad signal for the economy.  Credit spreads between the consumer discretionary sector and high grade bonds have jumped wider in recent weeks to end last week at 84bps.  The bonds of these entities haven’t reacted too much as they closely match the performance of the high grade corporate bond market tracked by the S&P 500 Bond Index.  This could in part be driven by the demand for investment grade bonds.  Consumer discretionary equities have seen a negative 1% quarter to date return.

Table 1: Select indices and quarter to date returns:

Source: S&P Dow Jones Indices, LLC. Data as of May 13th 2016. Chart is provided for illustrative purposes. It is not possible to invest directly in an index. Past performance is no guarantee of future results.

Why watch credit default spreads?  They can be an early warning sign of trouble ahead.  As recently as mid March the spread differential between the S&P/ISDA CDS U.S. Consumer Discretionary Select 20 Index and the S&P/ISDA U.S. 150 Credit Spread Index was only 29bps.  That spread has widened to 84bps is a few short weeks.  The S&P/ISDA U.S. 150 Credit Spread Index tracks the CDS of the largest borrowers in the S&P 500 Index.

Chart 1: Select Credit Default Swap indices and their spreads:

Source: S&P Dow Jones Indices, LLC. Data as of May 13th 2016. Chart is provided for illustrative purposes. It is not possible to invest directly in an index. Past performance is no guarantee of future results.

Table 2: Constituents of the S&P/ISDA CDS U.S. Consumer Discretionary Select 20 Index:

Source: S&P Dow Jones Indices, LLC. Data as of May 13th 2016. Table is provided for illustrative purposes. It is not possible to invest directly in an index.

The posts on this blog are opinions, not advice. Please read our Disclaimers.

Rieger Report: Oil State Municipal Bonds Doing Fine

Contributor Image
J.R. Rieger

Former Head of Fixed Income Indices

S&P Dow Jones Indices

The municipal bond market has been buffeted by pension shortfalls, Puerto Rico, Chicago, Detroit and other news worthy events.  Oil, however, is not yet one of the major forces impacting the municipal bond market.  In February 2016 oil dependent states and their municipal bonds were showing signs of weakening as the price of oil continued its plummet.  (February 2016 post can be found here) Now, nearly three months later those bonds with the exception of North Dakota have shown resilience and have performed similarly to the overall municipal bond market.

Table 1: Select municipal bond indices, their yields and total returns year-to-date:

Source: S&P Dow Jones Indices, LLC.  Data as of May 13th 2016. Chart is provided for illustrative purposes and reflects hypothetical historical performance. It is not possible to invest directly in an index. Past performance is no guarantee of future results.
Source: S&P Dow Jones Indices, LLC. Data as of May 13th 2016. Table is provided for illustrative purposes. It is not possible to invest directly in an index. Past performance is no guarantee of future results.

The posts on this blog are opinions, not advice. Please read our Disclaimers.

Eurozone Corporates Gets an ECB Kickstart

Contributor Image
Kevin Horan

Former Director, Fixed Income Indices

S&P Dow Jones Indices

The impact of the ECB announcement on March 10, 2016, continues to play out in the bond markets.  The governing council decided to establish a new program (the Corporate Sector Purchase Program, or CSPP), which will purchase investment-grade, euro-denominated bonds issued by non-bank corporations established in the eurozone.  The goal of the action is to further stimulate the economy.  The CSPP will be added to the existing Asset Purchase Program and will be included in the combined monthly purchases, which are to start toward the end of the second quarter of 2016.

Needless to say, this additional program has made an impact: eurozone corporate bonds, as measured by the S&P Eurozone Investment Grade Corporate Bond Index, have returned 0.39% for the month and 2.84% YTD as of May 12, 2016.  The S&P Eurozone Quasi & Foreign Government Bond Index has returned 0.59% for the month and 2.26% YTD, while the S&P Eurozone Sovereign Bond Index has returned 0.71% for the month and 2.73% YTD as of the same date.

The best-performing sector by far for the month has been financials, which makes up 60% of the index and has returned 0.20% as of the same date, though 31% are banks that do not participate in the CSPP.

Source: S&P Dow Jones Indices LLC. Data as of May 11, 2016. Past performance is no guarantee of future results. Table is provided for illustrative purposes.

Spreads of the S&P Eurozone Investment Grade Corporate Bond Index by rating category show that since mid-February 2016, the Option Adjusted Spreads (OAS) are significantly tighter for the AA, A, and BBB categories.  The BBB category has seen the most movement, tightening by 48 bps between Feb. 15, 2016, and May 11, 2016.

Exhibit-2: Eurozone Investment-Grade Corporate Bond OAS by Rating Category

Source: S&P Dow Jones Indices LLC. Data as of May 11, 2016. Past performance is no guarantee of future results. Chart is provided for illustrative purposes.


The posts on this blog are opinions, not advice. Please read our Disclaimers.

Safe Spread Alternative: The S&P 500® Corporate Bond Index

Contributor Image
Dennis Badlyans

Former Associate Director, Global Research & Design

S&P Dow Jones Indices

  • The May 2016 IIF Portfolio Allocation Trends report confirms the generally defensive tone among market participants, with investors balancing between higher quality and higher yield.
  • The S&P 500 Corporate Bond Index is the corporate bond counterpart to the market bellwether, the S&P 500 equity index.
  • With an average option-adjusted spread (OAS) of approximately 425 bps, the S&P 500 High Yield Corporate Bond Index presents a unique credit alternative, bridging the gap between investment grade (approximately 150 bps) and traditional high yield (approximately 650 bps).

Directional Uncertainty Driving Decisions

Portfolio flow data reveals that market participants have generally been favoring fixed income over equity, favoring emerging markets over developed markets, and favoring emerging market high grade over emerging market high yield.  Since the strong rally starting in mid-February 2016, appetite for risky assets appears to have increased, but market participants have been differentiating more on quality.  This demand pattern may be a reflection of a defensive tone of market participants who want exposure to higher yields but lack conviction in directionality of the market in the coming months.

One way for market participants to express this is to incorporate exposure to the S&P 500 High Yield Corporate Bond Index which can enhance yields with quality in mind.

The S&P 500 Corporate Bond Index is designed to measure the performance of the debt issued by the companies that constitute the S&P 500.  The index tracks both investment-grade and high-yield issuers.  Generally speaking, the constituents are of higher quality than those of traditional corporate indices such as the S&P U.S. Investment Grade Corporate Bond Index and the S&P U.S. High Yield Corporate Bond Index.

The S&P 500 High Yield Corporate Bond Index presents a unique credit alternative to bridge the gap between existing investment grade, which offers spread levels of around 150 bps, and high-yield corporate credit, which offers north of 600 bps in spread.  Returns on the S&P 500 High Yield Corporate Bond Index have a high correlation to the S&P U.S. High Yield Corporate Bond Index as well as other peer indices while the constituents of the index have had a lower instance of default historically.

Capture

Recent Performance

The weighted average of OAS of the S&P 500 High Yield Corporate Bond Index is 438 bps, which sits roughly halfway between traditional investment-grade indices, with OAS of 134 bps, and the traditional, broad high-yield corporate index, with OAS of 636 bps.  Since the peak levels seen on Feb. 11, 2016, U.S. dollar credit spreads have tightened dramatically, with the high yield indices registering returns of over 10% since.

Capture

The posts on this blog are opinions, not advice. Please read our Disclaimers.