Get Indexology® Blog updates via email.

In This List

The Rieger Report: Energy bonds - $25 billion gone in 5 months

The Rieger Report: 500 Index Sectors - stocks vs. bonds

The Rieger Report: Puerto Rico's 2015 Impact- $7.5 billion

The Rieger Report: Junk Bond Risk Realized as Credit Spreads Jump

The Rieger Report: S&P 500 Has Outperformed S&P 500 Bond Index 7 of last 9 Years

The Rieger Report: Energy bonds - $25 billion gone in 5 months

Contributor Image
J.R. Rieger

Former Head of Fixed Income Indices

S&P Dow Jones Indices

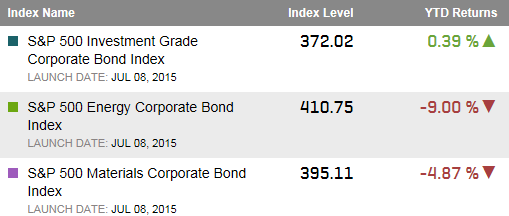
The decline in the energy sector has impacted the total market value of bonds in the S&P 500 Energy Corporate Bond Index by over $25 billion since July 31st.   The index has recorded a total return of -8.05% during these 5 months and -8.61% year-to-date.

What is even more worrisome is the cost of buying default protection on debt of issuers in the S&P/ISDA CDS U.S. Energy Select 10 Index has doubled during that time. This indicates an increase in defaults is expected in this sector.

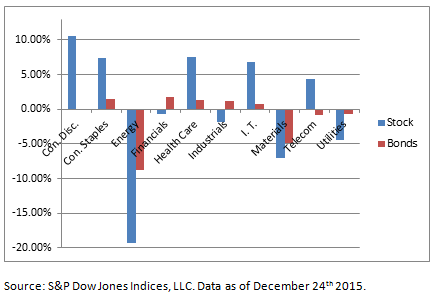
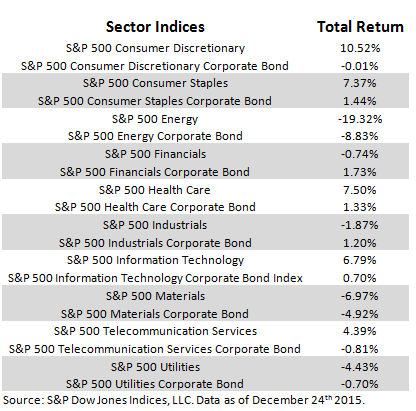
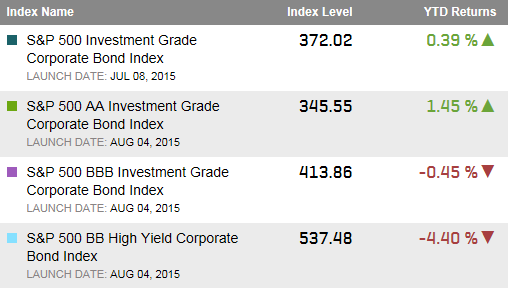
Table 1: Select indices and year-to-date returns:

Energy returns 12 28 2015

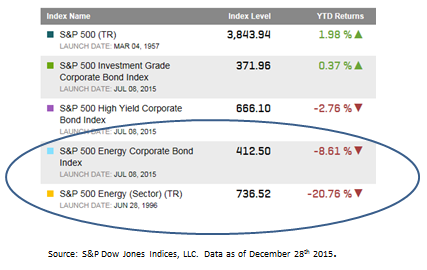
Chart 1: Select Credit Default Swap Indices

Energy CDS 12 28 2015

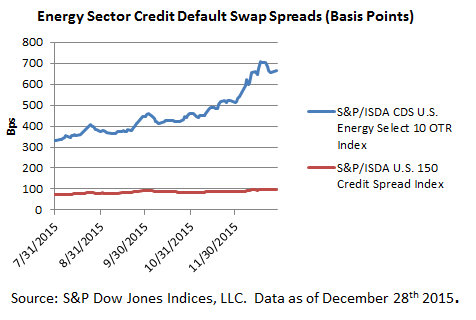
Note: The S&P/ISDA U.S. 150 Credit Spread Index tracks the largest debt issuers in the S&P 500 Index.  The S&P/ISDA U.S. Energy Select 10 Index tracks the largest debt issuers of energy companies with consistent credit default swap spread data.


The posts on this blog are opinions, not advice. Please read our Disclaimers.

The Rieger Report: 500 Index Sectors - stocks vs. bonds

Contributor Image
J.R. Rieger

Former Head of Fixed Income Indices

S&P Dow Jones Indices

Stocks and bonds behave differently in most market environments and the resulting low historical correlation between the two has been an important factor in many investment strategies. With the launch of the S&P 500 Bond Index we can now compare the performance of stocks and bonds of the same ‘blue chip’ entities in the iconic S&P 500 Index.

Highlights (total returns used for comparability):

  • The energy and materials sectors have been significant drags on both the stock and bond markets.
  • The utilities sector has been a drag on the equity sector but less so for the bond market.
  • The consumer discretionary, consumer staples, health care and I.T. sectors have been contributing to the equity markets returns while bond market returns for these sectors have been muted by the low rate environment seen throughout 2015.
  • The S&P 500 Energy Index is down over 19.3% year-to-date while the S&P 500 Energy Corporate Bond Index is down over 8.8% year-to-date.
  • The S&P 500 Materials Index is down over 6.9% while it’s bond counterpart is down over 4.9%.

Chart 1: Selected S&P 500 Sector Indices for both stocks and bonds

Sector Bar Chart 12 24 2015

Table 1: Selected S&P 500 Sector Indices for both stocks and bonds (Year-to-date Total Returns through December 24th 2015)

500 Sector Performance 12 24 2015

When a full year of data is available it will be important to consider the impact of volatility in each asset class by comparing the Risk Adjusted Returns within each sector.


The posts on this blog are opinions, not advice. Please read our Disclaimers.

The Rieger Report: Puerto Rico's 2015 Impact- $7.5 billion

Contributor Image
J.R. Rieger

Former Head of Fixed Income Indices

S&P Dow Jones Indices

As the fiscal saga continues for Puerto Rico and it’s residents the impact has been crushing for the bond holders in 2015.  The total market value of bonds tracked in the S&P Municipal Bond Puerto Rico Index has fallen by over $7.5billion.

Chart 1: Total Market Value of Bonds in the S&P Municipal Bond Puerto Rico Index 2015

Puerto Rico Market Value 12 2015

Source: S&P Dow Jones Indices, LLC.  Data as of December 22, 2015.

Yields for bonds in the S&P Municipal Bond Puerto Rico Index have ended at 9.62% which is 205 basis points cheaper than year end 2014.  Prices of bonds in the index have been volatile to the down side for most of the year and yields reached their cheapest point on June 29th when they got as high as 9.9%.

Chart 2: Select Municipal Bond Index Yields (Yield to Worst)

Puerto Rico Yields 12 2015

Source: S&P Dow Jones Indices, LLC.  Data as of December 22, 2015.

Some aspects about the index that impact this result:

  • Defaulted bonds remain in this index
  • Bonds that have matured that were not in default are removed from the index
  • News issues are added based on inclusion criteria

The posts on this blog are opinions, not advice. Please read our Disclaimers.

The Rieger Report: Junk Bond Risk Realized as Credit Spreads Jump

Contributor Image
J.R. Rieger

Former Head of Fixed Income Indices

S&P Dow Jones Indices

The relentless drive for yield has caught up with U.S. high yield bond investors.  Junk bond holders have been beaten up by the one risk they did not want to see:  credit spreads widening.  High yield bonds have seen compressed yields for some time as the relentless drive for yield had shifted flows toward yield producing assets.  Unfortunately, that segment of the bond market has endured sector risk (energy and materials) as well as signs the default rate is rising back toward historical norms.

Credit spreads of bonds in the S&P 500 Bond Index have jumped.   Yields of bonds in the S&P 500 BB High Yield Bond Index have risen 165 basis points since July 1st driving the total return down by over 5.3% during that time.

Chart 1: Select index yields (Yield to Worst)

Index Yields 12 21 2015

Source: S&P Dow Jones Indices, LLC.  Data as of December 21st, 2015.

As yields rise, bond prices have fallen erasing gains seen earlier in the year.  Year-to-date total return for the S&P 500 BB High Yield Corporate Bond Index is – 4.4%.

Table 1: Select index Year-to-Date Returns:

Returns 500 quality 12 2015

Source: S&P Dow Jones Indices, LLC.  Data as of December 21st, 2015.

The energy and materials sectors of the bond markets have been a real drag on performance on the junk bond markets as bond prices have fallen.  The S&P 500 Energy Bond Index is down 9% year-to-date and the S&P 500 Materials bond Index is down over 4.8% year-to-date.

Table 2: Select Bond Sector Indices Year-to-date Returns:

Sector Returns 500

Source: S&P Dow Jones Indices, LLC.  Data as of December 21st, 2015.

The posts on this blog are opinions, not advice. Please read our Disclaimers.

The Rieger Report: S&P 500 Has Outperformed S&P 500 Bond Index 7 of last 9 Years

Contributor Image
J.R. Rieger

Former Head of Fixed Income Indices

S&P Dow Jones Indices

Blue chip stocks have seen dramatic twists and turns over the past 10 years creating opportunity and angst for investors.  The bonds of these same companies have been less volatile and perhaps a bit boring.  The result has been that the S&P 500 has outperformed the S&P 500 Bond Index 7 of the last 9 years.  A closer look at those returns over a 10 year period show they actually are quite close.

Annual Returns 500 & 500 Bond

Looking at the 10 year annualized returns of stocks and bonds of the blue chip companies in the S&P 500 Index have been similar:

  • The 10 year annualized returns of the S&P 500 Bond Index and the S&P 500 Index are only 147bps apart.
  • Annualized risk adjusted returns taking into account the volatility of each asset class show a annualized 50bp return difference for the 10 year period and a 3bp difference in the 5 year return.

Annualized 500 Bond v Equity

When looking at the annualized risk adjusted returns which take into account volatility in each asset class the returns of blue chip stocks and bonds are very close.

Annualized Risk Adjusted Returns:

500 Bond v Equity


The posts on this blog are opinions, not advice. Please read our Disclaimers.