Get Indexology® Blog updates via email.

In This List

The Neutral Rate of Interest

Rising Interest Rates May Not Have an Immediate Impact on Senior Loan Rates

The Tale of Dividends in India, Continued

November Was a Turkey for Bonds

Waiting for the Fed

The Neutral Rate of Interest

Contributor Image
David Blitzer

Former Managing Director and Chairman of the Index Committee

S&P Dow Jones Indices

Several Fed policy-makers are focusing their comments and analyses on the neutral rate of interest – a level of the real (inflation-adjusted) Fed funds rate that will neither slow down nor speed up the economy.  If the Fed funds were set at this level, inflation and unemployment would be stable.  The neutral rate changes depending on economic conditions and is ultimately unknown. Despite the measurement problems, it is useful in setting and evaluating monetary policy.

While the neutral rate idea has appeared recently, it is close to an older concept of a natural interest rate due to the Swedish economist, Knut Wicksell (1851-1926). Today’s approach focuses on how the neutral rate changes as the economy adjusts.

The neutral rate is a benchmark for judging the stance of monetary policy.  When the real Fed funds rate is lower than the neutral rate, monetary policy is accommodative and will lead to lower unemployment, faster growth and increased inflation; if the real Fed funds rate is above the neutral rate, the reverse trends will be in place. While we don’t know exactly what the neutral rate is today, we do know how it changes as the economic and financial conditions evolve.  Combined with an understanding of how accommodative or restrictive monetary policy presently, we can judge how policy should adjust.  These ideas, along with current data, are behind the arguments for an increase in the Fed funds Rate, possibly as soon as December 16th, a couple of weeks away.

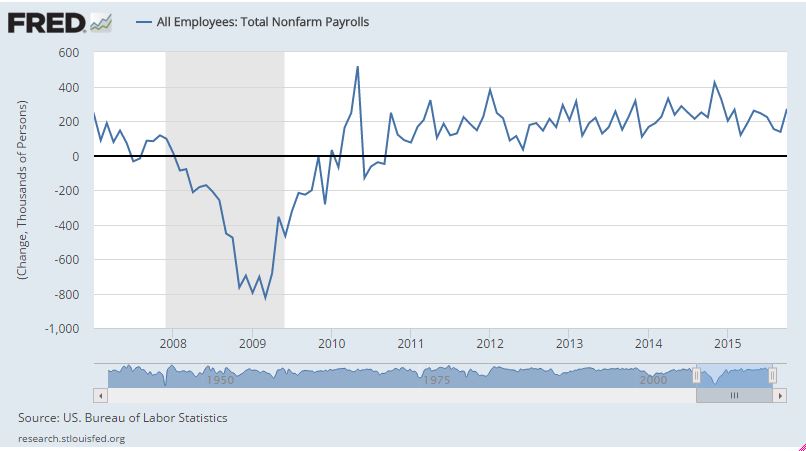
In a recession with employment and inflation falling, pessimistic expectations of the future and few short term investment opportunities, the economy has very little momentum. Even relatively modest interest rate levels may dampen economic activity. In this situation the neutral rate will be quite low. During the last recession in 2007-2009, the neutral rate was zero or less; in Europe today the recent action of the European Central Bank suggests it is close to zero. As economic growth resumes in a recovery and as pessimism shifts to neutral and then to optimism, the neutral rate will rise. If the recovery progresses, increased demand for credit and rising investment will push the neutral rate higher.  In a recession, the central bank will seek to keep the Fed funds rate below the neutral rate to support the economy.  As the economy improves and the neutral rate rises, the central bank either lifts the Fed funds target to follow the neutral rate up or risks a much too simulative policy position and inflation.  How far the real Fed funds rate is above or below the neutral rate affects how aggressive the policy is.

When the real Fed funds rate is close to the neutral rate, monetary policy will gradually move the economy; when spread widens the impact of monetary policy increases.   The large rate moves in the early days of the financial crisis and the extremely high interest rates in the 1979-82 inflation wars are examples. Today, there is no room to lower the Fed funds rate; even if the Fed raises its target later this month there will be a little room.  But there is plenty of upside – if inflation were suddenly a worry the central bank could easily boost the Fed funds target well above the neutral rate.  The importance of this is the asymmetry of risks: keeping interest rates a bit too low buys insurance against unexpected slowness in the economy.  Rushing to raise interest rates in fear of inflation makes little sense since there is plenty of upside if tighter policies are suddenly needed.

That no one knows precisely where the neutral rate is hasn’t stopped people from estimating its position. The chart from a recent speech by Fed Chair Janet Yellen shows four estimates of the neutral rate.

Yellen

The posts on this blog are opinions, not advice. Please read our Disclaimers.

Rising Interest Rates May Not Have an Immediate Impact on Senior Loan Rates

Contributor Image
Lucas Chiang

Associate, Product Management

S&P Dow Jones Indices

Following months of uncertainty, the U.S. Federal Reserve has indicated that there could soon be a hike in the Federal Funds Target Rate.  Interest rates have been kept in a range between zero and one-quarter of a percent since December 2008 and have not risen since June 2006.

As interest rates have been at historically low levels for nearly the last seven years, some fixed income investors have shifted their focus to senior loan securities with floating-rate characteristics, such as interest rate floors, to protect themselves in the event of falling rates.  Interest rate floors protect the loan interest rate by increasing the loan interest rate to the spread plus the floor if the reference rate ever falls below the floor.  Simply put, the formula for loan rates in these structures can be stated as follows.

Loan Interest Rate = Maximum of (Reference Rate or Floor) + Spread

As of Nov. 28, 2015, the S&P/LSTA U.S. Leveraged Loan 100 Index consisted of 100 senior loans, of which 91 had interest rate floors based on the Federal Funds Target Rate.  Of those loans, 31 had a floor of 0.75%, 55 had a floor of 1.00%, and 5 had a floor of 1.25%.  As the Federal Funds Target Rate is currently below these floors, we know that the loan interest rates are currently established by the interest rate floors instead.  This implies that as interest rates begin to rise, we may not see an immediate impact on senior loans with interest rate floors.  Lenders may have to wait until the Federal Funds Target Rate rises above 0.75% for the rising interest rates to make a significant impact on this basket of loans.

The posts on this blog are opinions, not advice. Please read our Disclaimers.

The Tale of Dividends in India, Continued

Contributor Image
Utkarsh Agrawal

Associate Director, Global Research & Design

S&P Dow Jones Indices

Much has been written about dividends in academic literature. There are several theories regarding the dividend policies of companies. One theory asserts that dividends are irrelevant because an investor who wants cash flows could sell shares. Another theory suggests that a bird in the hand is worth two in the bush, meaning that investors prefer cash dividends over uncertain capital gains. There are other arguments that take into account the tax treatment, in which investors would prefer dividends to capital gains if dividends were taxed favorably. In India, dividends are non-taxable in the hands of the recipient. As mentioned in a prequel to this article, India has historically had a lower dividend yield in comparison with developed nations. Moreover, Indian large- and mid-cap companies have exhibited more stable dividend yields in comparison with small-cap companies. Let’s take a closer look at the large-cap segment of the Indian market.

From Exhibit 1, we can see that the majority of Indian companies in the S&P BSE LargeCap have paid dividends between 2005 and 2015. The S&P BSE LargeCap is designed to measure the top 70% of companies in the S&P BSE AllCap, based on the cumulative average daily total market capitalization of the included companies over a one-year period. In general, companies prefer not to reduce or omit dividends, as it is perceived negatively in the capital market. This has been noted in the past when the aggregate dividend paid by the companies in S&P BSE LargeCap has either increased or remained the same. This occurred even during the 2008 global financial crisis, although the number of non-dividend-paying companies also slightly increased during this period. More recently, during fiscal year 2015, the aggregate dividends paid have decreased in the S&P BSE LargeCap.

Exhibit 1: Dividend-Paying History of Companies in S&P BSE LargeCap

Dividend Exhibit 1

Source: S&P Dow Jones Indices LLC, Factset.  Data as of Aug. 31, 2015.  Past performance is no guarantee of future results.  Chart is provided for illustrative purposes. 

From Exhibit 2, it can be observed that the majority of the dividend-paying companies in the S&P BSE LargeCap have had a dividend payout ratio (DPR) range of 0%-40% in the 10-year period ending in 2015. More recently, the percentage of dividend-paying companies with a DPR greater than 40% has increased. Companies have negative earnings when DPR is less than 0%, and if it is greater than 100%, then companies have paid out more than they have earned in that fiscal year. In addition, we can note that there were few companies in the S&P BSE LargeCap with a DPR of either less than 0% or greater than 100%.

Exhibit 2: DPR History of Dividend-Paying Companies in the S&P BSE LargeCap 

Dividend Exhibit 2

Source: S&P Dow Jones Indices LLC, Factset.  Data as of Aug. 31, 2015.  Past performance is no guarantee of future results.  Chart is provided for illustrative purposes.

Different classes of investors have different preferences for dividend income. Some may prefer companies that have paid stable or increasing dividends over those that either do not pay dividends or have an unstable dividend payment history. However, dividend increases do attract attention in the capital markets. Together with S&P Dow Jones Indices, Asia Index Private Limited recently launched the S&P BSE Dividend Stability Index. It is designed to measure the performance of companies in the S&P BSE LargeCap that have paid ordinary dividends of 4% or more for at least seven of the past nine years, and the most recent DPR should be between 0% and 100%.

Exhibit 3 details the performance characteristics of the S&P BSE Dividend Stability Index over the 10-year period ending Sept. 16, 2015. The highest excess positive returns over the S&P BSE SENSEX were observed during the 2008 global financial crisis. This is consistent with the results we obtained earlier when we noticed that aggregate dividends paid by companies in S&P BSE LargeCap did not decrease during that period. The capital loss suffered was marginally offset by dividends. Over the same 10-year period, the S&P BSE Dividend Stability Index has provided a CAGR of 15.22%, which is 1.64% in excess of the S&P BSE SENSEX.

Exhibit 3: Performance Characteristics of the Indices 

Dividend Exhibit 3

Dividend Exhibit

Source: S&P Dow Jones Indices LLC, Factset.  Data as of Sept. 16, 2015.  Past performance is no guarantee of future results.  Charts are provided for illustrative purposes and reflect hypothetical historical performance.

Many strategies exist worldwide in which investors focus on dividends. With the Indian economy growing at a fast pace and the capital markets maturing, Indian investors may also seek to benefit from them.

The posts on this blog are opinions, not advice. Please read our Disclaimers.

November Was a Turkey for Bonds

Contributor Image
Kevin Horan

Former Director, Fixed Income Indices

S&P Dow Jones Indices

The yield-to-worst of the S&P/BGCantor Current 10 Year U.S. Treasury Index averaged 2.26% for the month of November.  The index started the month at 2.15% and closed the month at 2.22%.  At one point on Nov. 9, 2015, the yield was as high as 2.35%, and the index ended 8 bps wider overall.

The anticipation of a Fed interest rate hike on Dec. 16, 2015, and general U.S. economic improvement had the majority of bonds in the red for the month.

The S&P 500® Bond Index lost 0.28% for November, while it kept the YTD return in the green, at 0.25%.

Energy was the sector that lagged the most, as the S&P 500 Energy Corporate Bond Index was down 4.42% YTD.

All sector indices of the S&P 500 Bond Index underperformed, except for the S&P 500 Financials Corporate Bond Index and S&P 500 Telecommunication Services Corporate Bond Index.  These indices were positive for November but did not return much, coming in at 0.09% and 0.03%, respectively.

Outside of the S&P 500 Bond Index, the S&P Taxable Municipal Bond Select Index was the positive performer of the S&P U.S. Aggregate Bond Index, with a 0.47% gain for the month.

Exhibit 1: Performance of the S&P 500 Bond Index and S&P 500 U.S. Aggregate Bond Index
November Fixed Income Total Returns


Source: S&P Dow Jones Indices LLC.  Data as of Nov. 30, 2015.  Past performance is no guarantee of future results.  Table is provided for illustrative purposes.

The posts on this blog are opinions, not advice. Please read our Disclaimers.

Waiting for the Fed

Contributor Image
David Blitzer

Former Managing Director and Chairman of the Index Committee

S&P Dow Jones Indices

The Fed’s policy makers, the FOMC, meet on December 15th and 16th and are widely expected to raise the target Fed funds rate for the first time since 2006.  The odds of a 25 bp increase in the target range to 25-50 bp is about 77% based on Fed Funds futures.  There are two key economic reports still expected before the meeting: employment and inflation.

The first chart shows the monthly change in payroll employment since 2009.  The market expectation is for a 200,000 increase, in line with recent numbers and further confirmation that the weakness seen in August and September is behind us.

payrols M-M

The second chart shows the core rate for the CPI (CPI ex-food and energy). While the FOMC looks at a similar measure, the personal consumption expenditure deflator, the CPI is more widely followed and will be released on Tuesday, December 15th as the FOMC members gather for their meeting. It is expected to show inflation remains below the Fed’s 2% desired figure.

CPI Y-Y

For those who wonder why there is so much interest in the Fed and a possible turn in interest rates, the last chart of the 10 year Treasury note yield is a capsule history of the bond market since the 1960s.  We are nearing the end of what used to be called the “Great Intergalactic Bond Rally.” Once the Fed begins the shift to rising rates, it will be a different financial world.

The posts on this blog are opinions, not advice. Please read our Disclaimers.