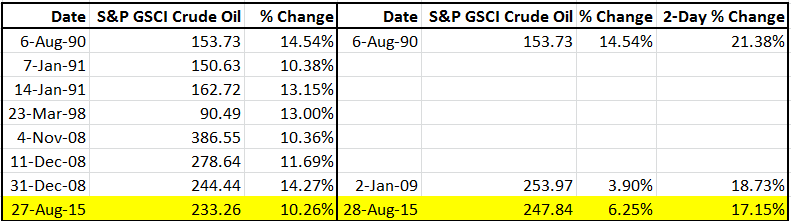
As of the close on Aug. 28, 2015, the S&P GSCI Total Return gained 8.98%, the most in 2 days since Jan. 2, 2009. It was the 4th best gain over 2 consecutive days in the history of the index that has data beginning on Jan. 2, 1970. The bigger 2-day gains are shown in the table below:

The high total returns in the world production weighted S&P GSCI were driven by strong oil performance, the biggest component in the index. On Aug. 27, 2015, the S&P GSCI Crude Oil experienced its 8th biggest gain in history, up 10.26%. This was followed by another daily gain of 6.25% to record the 3rd biggest 2-day gain for the S&P GSCI Crude Oil, in its history since Jan. 6, 1987 as shown below:
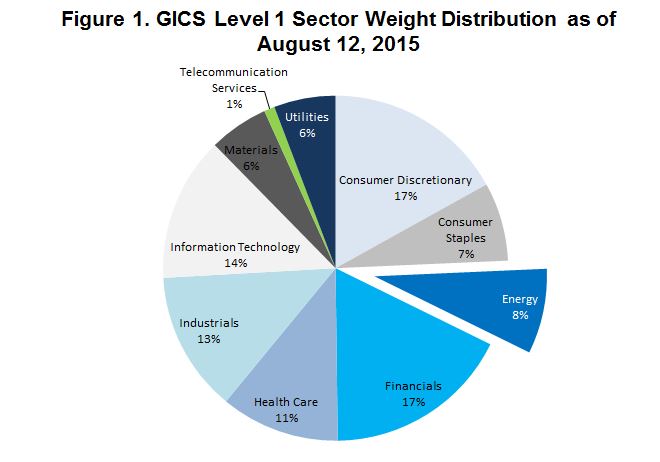
As shown before, rising oil floats all boats, and on Friday 17 of the 24 commodities gained, which is a major improvement from the direction last month when 23/24 commodities recorded negative total returns. However, when looking month-to-date in August, it is not much better with only 3 positive commodities; lead +1.8%, lean hogs +4.2% and gold +3.6%.
Unfortunately for commodities, just because there was a historically large spike, it doesn’t indicate they hit the bottom.
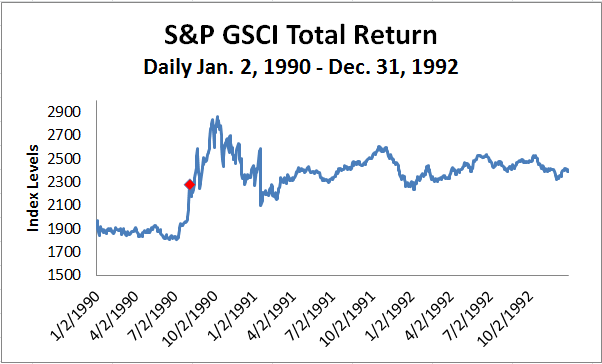
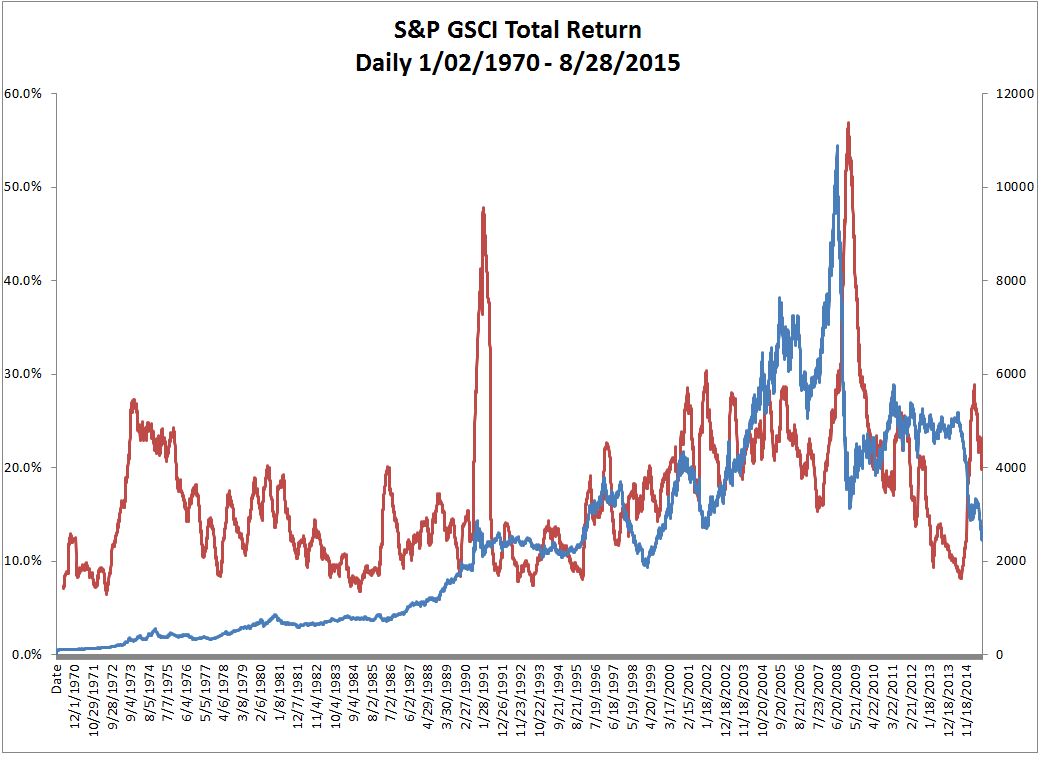
After the 2-day gain of 10.4% on Aug 6, 1990, the S&P GSCI continued to gain 25.7% through Oct. 9, 1990, but lost it all giving up 26.8% by Jan. 18, 1991. It never really picked up again until 1996.
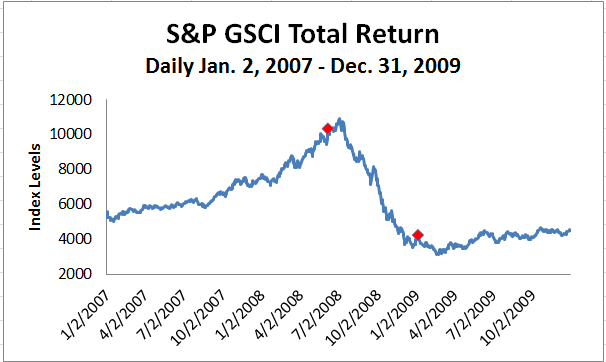
The two other higher 2-day gains were realized in the 2008-9 time period. The first spike on Jun. 6, 2008 happened before the crash but the second spike happened on the way down. The latter is more interesting to evaluate since the peak only squeezed out an extra 5.3% by July 3, in 2008. However, the 2-day spike ending Jan. 2, 2009, was followed by a decline of 24.2% until the bottom seemed to reached on Feb. 18, 2009.
While the index rose 85.3% until Apr. 8, 2011, it has now given up 53.8% and has created a new biggest drawdown of 77.5% as of Aug. 26, 2015. It is yet to be seen whether the fall will continue but what is concerning besides the difficult fundamentals is that the volatility is still not historically high. Historically the volatility has spiked, becoming too volatile for investors hence causing them to sell. This has driven drops in open interest in historical crises that we haven’t seen yet.
To hear more expert opinions about commodities, please join us for our 9th annual commodity seminar.
Source: S&P Dow Jones Indices LLC. Daily Data from Jan. 2, 1970 – Aug. 28, 2015. The launch date of the S&P GSCI was May 1, 1991. All information presented prior to the index launch date is back-tested. Back-tested performance is not actual performance, but is hypothetical. The back-test calculations are based on the same methodology that was in effect when the index was officially launched. Past performance is not a guarantee of future results. Please see the Performance Disclosure at http://www.spindices.com/regulatory-affairs-disclaimers/ for more information regarding the inherent limitations associated with back-tested performance.
The posts on this blog are opinions, not advice. Please read our Disclaimers.