Get Indexology® Blog updates via email.

In This List

Is There A Doctor (Copper) In The House?

Chinese Stock Market Interventions

Fundamental Drivers for Airlines

Energy Continues its Performance Drag on Bonds in August

OK Jobs Report Gives No Hint for the Fed

Is There A Doctor (Copper) In The House?

Contributor Image
Jodie Gunzberg

Former Managing Director, Head of U.S. Equities

S&P Dow Jones Indices

Copper, the most important commodity in the world, has earned the title of “Dr. Copper” for predicting economic health. Today, TD Ameritrade ran an article claiming Dr. Copper Is In, questioning whether copper hinted last year at the current slowing global growth. While prior research shows Dr. Copper is not so smart, copper is still important and has some areas of specialties like inflation hedging.

Below is a recent Q&A with TD Ameritrade on Dr. Copper to drill into its role as the most important metal:

Why is copper such an important industrial metal? What are some of its uses world-wide?
Copper is the biggest metal in commodity indices with a greater world production and liquidity than any other metal. It comprises about 10.5% of the Dow Jones Commodity Index (DJCI) and just over 3% of the S&P GSCI. One-third of the DJCI is metals where the individual metals are weighted by average liquidity over 5 years. Inside the DJCI, copper is slightly bigger than gold and more than twice as large as the next biggest industrial metal, aluminum. The S&P GSCI is world production weighted where copper is about 1.5 times bigger than both gold and aluminum.

Copper has desirable characteristics as an industrial metal since it is malleable, a good conductor of heat and electricity, and is resistant to corrosion. This makes copper highly demanded for wiring and plumbing in construction, heating and cooling systems, electronic products and in automobiles. Further, it is an important metal in alloys such as brass, tin and with nickel. It improves malleability and acoustics for musical instruments plus does not corrode so is beneficial for shipbuilding.

Why does copper have a nickname: “Dr. Copper?” What is behind the idea that copper is an important predictive indicator for global economic activity?
Copper is reputed to have earned a Ph.D. in economics because of its ability to predict turning points in the global economy. This is since copper is so broadly used across industries from building construction, machinery, power generation and transmission, electronic product manufacturing and in transportation vehicles. The thought is as the demand for copper rises, its price likely increases and suggests a growing global economy. Conversely, declining copper prices may indicate sluggish demand and an imminent economic slowdown.

Who are the world’s top copper consumers?
China has the highest demand for refined copper that is about double Europe’s and roughly 4 times more than the US. The total global refined copper demand in 2014 was just over 20,000 MT with about half coming from China.
Source: http://www.businessinsider.com/copper-demand-by-region-2015-1

Who produces copper?
It’s estimated that Chile produced about 5.80 million tonnes or roughly 1/3 of the world’s copper in 2014. China, Peru, US, Congo and Australia are other big copper producers with 1.62, 1.40, 1.37, 1.10 and 1.00 million tonnes estimated in 2014.
Source: http://minerals.usgs.gov/minerals/pubs/mcs/2015/mcs2015.pdf

Copper prices have fallen significantly recently —what has been pressuring the copper market?
Many influences have been pressuring copper on the downside recently. There is uncertainty over China’s demand even though the numbers showed a 7% growth versus a 6.9% consensus. The fall in the Chinese stock market may also potentially hinder growth. This combined with the Greek crisis and increasing U.S. CPI (Consumer Price Index) has added strength to the U.S. dollar that is another headwind for copper, making it more expensive for buyers holding other currencies.

What if anything does the recent softness in copper prices reflect about global economic activity?
The stronger U.S. dollar exacerbates the softness in copper in addition to weak economic activity. Copper prices may reflect more weakness in the housing and construction industries and to a lesser degree the automobile sector, but it may not reflect as much about other areas of the economy. Also, the fall in oil prices in the past year has cut GDP growth for many of the oil producing countries that may slow the demand for copper as emerging countries take longer to develop. Finally, the supply side matters as adjustments may be made according to inventories and demand.

How important is Chinese economic growth to the copper market?
Considering China is the biggest copper consumer, Chinese economic growth is important to copper. However, on a per capita basis, Chinese consumption of copper is still only about half of North American consumption. This makes copper particularly likely to increase with increases in Chinese demand. Other factors on the supply side that may be seasonal, regulatory, or financial also influence the copper market.

What is the current supply/demand balance for the copper market? Is it a market out of balance?
Copper inventories been building, reaching short term highs. However, over the longer term, the 5-year LME Copper Stocks are still relatively low. The roll yield turned negative just this month indicating excess inventories; though on average for the year the roll yield is positive that measures shortages.

In Q1 2015, ICSG (International Copper Study Group) reported usage declining around 3% with a 4% drop coming from China. World mine production increased around 1.5%. In total, the world refined copper balance in Q1 adjusted for the change in Chinese bonded stocks indicates a production surplus of around 182,000 mt, compared with a deficit of around 70,000 mt in the same period of 2014, the ICSG said.

Does copper have a strong correlation to global GDP? Or does it have a strong correlation to any other economic trend or market?
S&P DJI research finds that Dr. Copper is not so smart. The supply side of copper is extremely important in its price formation so we find the historical correlation of copper to world GDP growth of only about 0.4. Further, it seems copper holds up well during weak recessions, up about 7% on average in weak recessionary years, but it only falls dramatically, about 30% on average in periods of strong recessions.

Copper returns are positively correlated to both expected and unexpected inflation, though the correlation to unexpected inflation is more significant. The sensitivity of copper to expected and unexpected inflation is relatively high with betas (or slopes of the regression) of 24.5 for expected inflation and 38.6 for unexpected inflation.

Please see more on our research at:
https://www.indexologyblog.com/2014/03/09/how-smart-is-dr-copper/#sthash.BtQwVI0f.dpuf
http://www.spindices.com/documents/research/research-taking-a-shine-to-copper-20120731.pdf

For stock traders, what information could that glean from watching the copper market?
Despite a ten-year annualized total return that is very similar as measured by the S&P GSCI Copper, up 8.4%, and S&P 500, up 7.9%, there is very little relationship between the two. The volatility of copper is about twice that of the stock market and the ten year correlation between copper and the stock market is only 0.196 and longer term back to 1977 is .0304. If anything, copper diversifies stock market exposure.

To learn more about commodities today and to hear more expert opinions on copper, please register for our annual commodities seminar coming on Sep. 17, 2015.

The posts on this blog are opinions, not advice. Please read our Disclaimers.

Chinese Stock Market Interventions

Contributor Image
Ellen Law

Former Associate Director, Asia Pacific Market Development

S&P Dow Jones Indices

This post is about the Chinese investment landscape covering the stock and bond markets and covers the challenges of the current Chinese stock market.

Recent Chinese Stock Market Turmoil
China A-Shares have rallied since Q4 2014 to their peak in mid-June 2015.  The one-year performance for the S&P Total China BMI rose over 110% (from June 12, 2014, to its peak on June 12, 2015).  China A-Shares then suddenly dropped more than 30% after the rally, an amount equivalent to over USD 3 trillion that has been wiped off the stock market in less than one month.  This massive sell-off has triggered the Chinese government to take intensive measures in order to halt the stock market plunge.  The interventions seem to have successfully propped up and stabilized the Chinese stock market.

Government Interventions Post Threats to Chinese Stock Market
Despite the successful measures taken to curb the market plunge, the Chinese government has been accused of taking overly aggressive measures regarding its interventions in the market.  A truly open stock market is commonly perceived as having minimal intervention.  The recent intensive and unconventional measures taken by the Chinese government not only shake investor confidence toward China’s stock market, but they also slow down the liberalization of China’s capital market.

Some market players also expect that the Chinese government’s interventions could hinder the inclusion of A-Shares in the global emerging market indices.  Emerging market indices are widely tracked by global asset managers.  The inclusion of A-Shares could attract an estimated USD 400 billion inflow into the Chinese onshore stock market, but now the inclusion date appears to be even further away.

Many global investors appear to be taking a more conservative approach toward investments in China’s onshore stock market due to the recent market volatility and government interventions. However, as the second-largest economy in the world, China’s importance can hardly be neglected.

The posts on this blog are opinions, not advice. Please read our Disclaimers.

Fundamental Drivers for Airlines

Contributor Image
Todd Rosenbluth

Director of ETF and Mutual Fund Research

S&P Capital IQ Equity Research

In the first seven months of 2015, the S&P 1500 Airline index declined 11%, as we think investors focus on capacity additions with a worrying eye.  However, S&P Capital IQ thinks that airline execs have learned from past costly mistakes on adding too much capacity and forecasts 2015 as a record profitability year, driven by revenue growth and the benefits of lower oil prices.

Airline stocks such as Alaska Air Group, American Airlines, Delta Airlines and JetBlue Airways are represented in the S&P Transportation Industry Index. As of August 5, airlines had a 26% weighting in the S&P index, second only to trucking. Meanwhile airlines were a smaller yet meaningful 5.0% weighting in the S&P 500 Industrials index.

According to Jim Corridore, an S&P Capital IQ equity analyst, years of consolidation, bankruptcies, and capacity adjustments have given the airlines increased pricing power, which has led to rising industry revenues and passenger yields over the past five years. Fare increases, fewer fare sales and an increased mix of business travelers (who tend to pay more for tickets) contributed to industry revenue growth. Average fares have risen sharply over the past five years and passenger load factors (a measure of how full, on average, flights are) are at record levels for the industry. In 2014, the load factor was 83.4%, up from 83.1% and 82.8% in 2013 and 2014, respectively.

Meanwhile, much to the displeasure of passengers, airlines have been adding and increasing these fees in an effort to shift their customers toward an “unbundled” strategy of paying a base fare for air travel plus additional fees for whatever “extras” the customer may require, like a checked bag or a hot meal. Bag fees and reservation change fees alone accounted for $4.6 billion in revenues in 2014, up from $3.5 billion in 2012, according to statistics from the Bureau of Transportation Statistics.

From a cost perspective, the U.S. airlines industry consumes about 19-20 billion gallons of jet fuel a year, according to Corridore, so lower oil prices can drive significantly lower costs. For many years, jet fuel has been the largest cost category for most U.S. airlines, eating up about a third of the industry’s revenues. Oil prices were recently around $45 a barrel, down more than 50% from a year earlier.

S&P Capital IQ sees fuel costs for Delta Airlines (DAL) falling 25%-35% in 2015, as DAL benefits from operating its oil refinery, as well as from lower oil prices, partly offset by losses on hedging contracts entered into at higher fuel prices.

There are a number of industrial ETFs that have exposure to the airline industry.

Please follow me @ToddSPCAPIQ to keep up with the latest ETF Trends

—————————————————————————————————–
The views and opinions of any contributor not an employee of S&P Dow Jones Indices are his/her own and do not necessarily represent the views or opinions of S&P Dow Jones Indices or any of its affiliates.  Information from third party contributors is presented as provided and has not been edited.  S&P Dow Jones Indices LLC and its affiliates make no representations or warranties of any kind, express or implied, regarding the completeness, accuracy, reliability, suitability or availability of such information, including any products and services described herein, for any purpose.

The posts on this blog are opinions, not advice. Please read our Disclaimers.

Energy Continues its Performance Drag on Bonds in August

Contributor Image
Kevin Horan

Former Director, Fixed Income Indices

S&P Dow Jones Indices

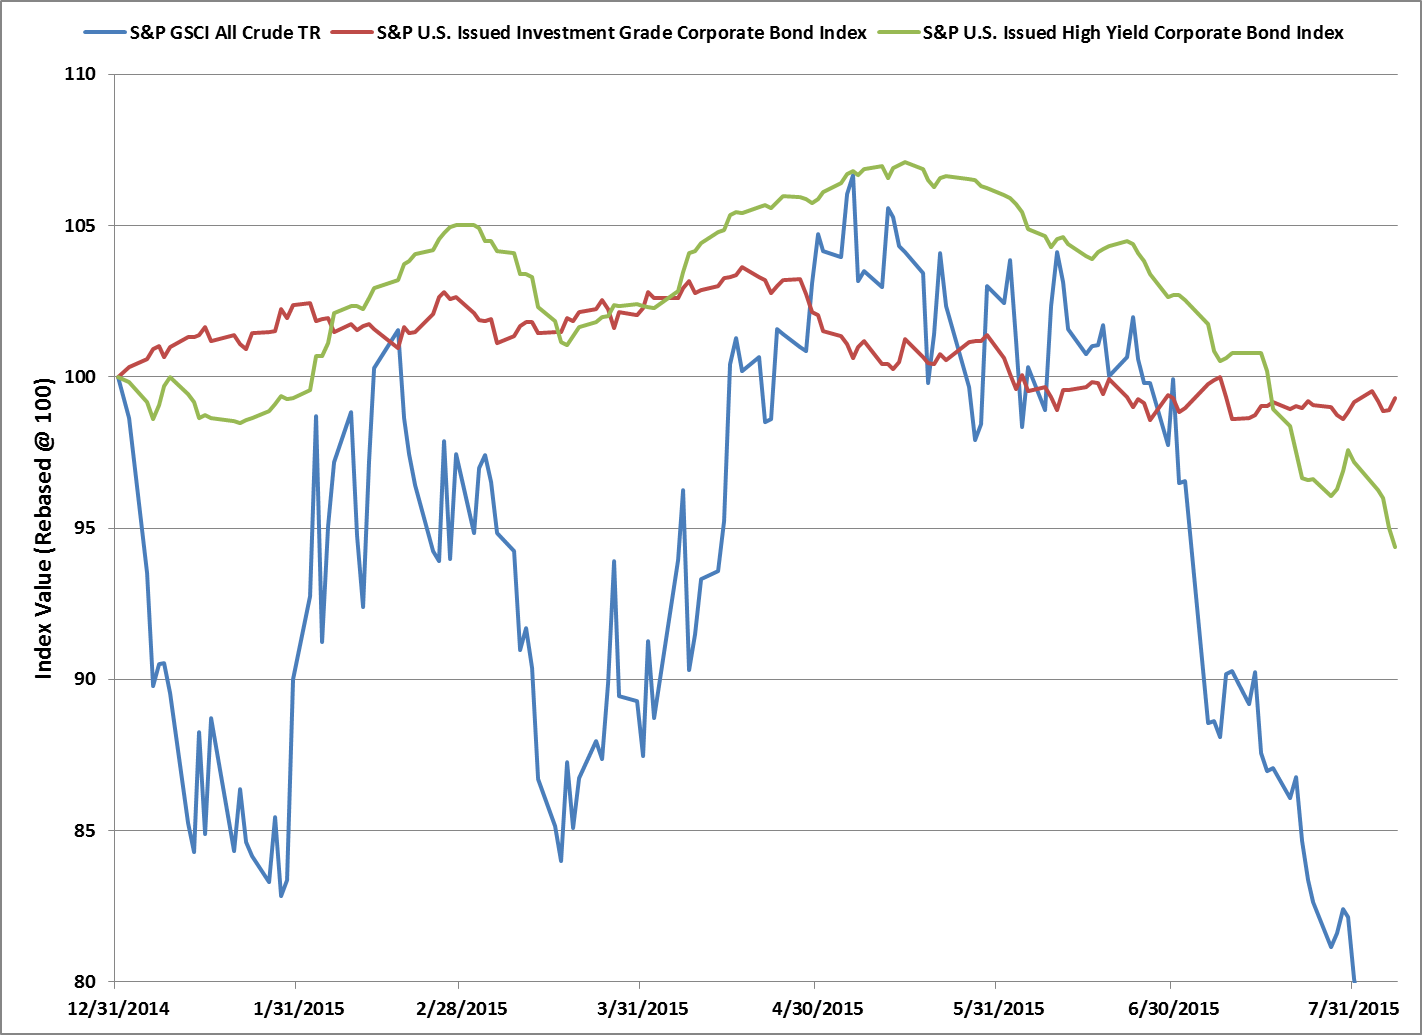
Crude oil, as measured by the S&P GSCI All Crude was down 20% in July 2015 and has continued its sell-off in August 2015 by dropping another 6.86%.  As of Aug. 10, 2015, the index has returned -25.4% YTD.  Energy-related bonds in the investment-grade or high-yield indices have added a negative hit to the indices’ overall performance.

The energy sector of the S&P U.S. Issued Investment Grade Corporate Bond Index accounts for 8.6% of the index’s market value.  So far in August 2015, the sector has remained positive, returning 0.14%, almost offsetting July 2015’s -0.15% return.  June 2015 had a more significant negative performance with -2.05%.  The S&P U.S. Issued Investment Grade Corporate Bond Index has returned 0.16% MTD and -0.03% YTD.  The S&P 500® Energy Corporate Bond Index, a sub-index of the S&P 500 Bond Index that includes both investment-grade and high-yield issuers of the equity index, has returned -0.11% MTD and -0.72% YTD.

In the S&P U.S. Issued High Yield Corporate Bond Index, the energy sector has had more of an impact, as the market value weight of the sector is 14.4% of the index.  Already in August 2015, the energy sector is down 2.9%, following a 5.37% loss in July 2015 and a 3.31% loss in June 2015.  At the end of May 2015, the S&P U.S. Issued High Yield Corporate Bond Index had a YTD return as high as 4.08%, but it has returned 1.18% YTD.

Treasury yields, as measured by the S&P/BGCantor Current 10 Year U.S. Treasury Bond Index, moved 17 bps lower in July 2015.  The first week of August 2015 saw the yield-to-worst of the S&P/BGCantor Current 10 Year U.S. Treasury Bond Index close almost flat, after moving 12 bps higher on the release of stronger Factory Orders and ADP Employment numbers.  However, the increase in rates did not last long, as the yield-to-worst moved down 10 bps to close at 2.17%.  The index has returned 0.18% MTD and 1.57% YTD.  Market participants will return from their vacations in August 2015 to focus on September 2015 and the possibility of a Fed rate hike.

Exhibit 1: Index Values
Index Values


Source: S&P Dow Jones Indices LLC.  Data as of Aug. 7, 2015.  Past performance is no guarantee of future results.  Chart is provided for illustrative purposes.

The posts on this blog are opinions, not advice. Please read our Disclaimers.

OK Jobs Report Gives No Hint for the Fed

Contributor Image
David Blitzer

Former Managing Director and Chairman of the Index Committee

S&P Dow Jones Indices

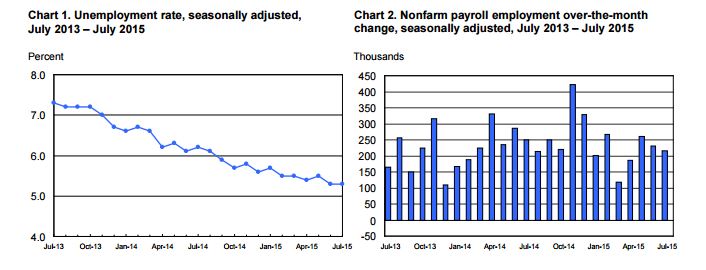
Anyone hoping that this morning’s employment report would send a clear message to the markets and the Fed about the timing of a rate increase was sorely disappointed.  There is virtually no change from last month, even to the second decimal place on some lines. The charts show the unemployment rate — unchanged — and the rise in payrolls — a touch weaker — than in June.  One positive note, average hourly earnings rose 2.4% from July 2014, a bit stronger than last time. (from The Employment Situation Report, 8-7-15.) Click on chart for larger image.

Debate over whether the Fed will, or should, raise the Fed funds target centers around inflation, jobs and GDP.  Taken together these don’t make an clear case for higher interest rates. Unemployment is down, job growth is good but there could still be some slack in the labor markets given the lower participation rate. Inflation is still below the Fed’s target although it is closer than a year ago. GDP growth is not all that impressive.  All these  miss one point: the Fed would like to take real steps towards normal monetary policy and begin shrinking its balance sheet.  With favorable economic conditions, this may be time to move forward.

The odds for a Fed move in September remain a bit better than 50-50.   but we will have to wait for the next employment report on Friday September 4th for a better guess.

The posts on this blog are opinions, not advice. Please read our Disclaimers.