Get Indexology® Blog updates via email.

In This List

European Equities Ripping Into 2015: Is It Just The ECB?

February Made Bonds Shiver, While Energy Kept High Yield Warm

Australian Bonds Delivered Better Risk-Adjusted Return than Equities

Indian Bond Market: Government Bonds Lead

Sustainability Indices: Investment Solutions For Future Generations

European Equities Ripping Into 2015: Is It Just The ECB?

Contributor Image
Tim Edwards

Managing Director, Index Investment Strategy

S&P Dow Jones Indices

If there is one thing that the large stimulus programs enacted by central banks in the U.S., U.K. and Japan over the past few years have taught us, it is that they provide a whopping boost to equity markets in the short term.  Is that the only reason Europe is doing so well?

The European Central Bank announced its own €60bn per month bond purchasing program in January, and so far the S&P Europe 350 index of large-cap pan-European stocks has been having its best year ever.  Our end-of-month European dashboard shows a total return of 15% for the first two months of the year; it also shows that every sector and every country represented in the index has gained.

But – as we have seen in Japan – the problem with a rising tide lifting all boats is that the performance of those boats becomes highly dependent on the tide.  Otherwise said, if the stimulus program is all that is supporting the performance of European stocks, then as soon as it is priced in we return to a more volatile, uncomfortable market predicated on the ECB’s next move.

The good news is that this doesn’t seem to be the case.  There are plenty of other reasons to be optimistic about European equities that have nothing to do with Mario Draghi.  Lower energy prices should help the pockets of consumers and businesses, and most economists agree they should act to improve consumption.  Less commonly appreciated, it is actually good news that German workers are striking for higher pay, following a generous deal already completed with the single-largest union.  That’s seen as good news for two reasons: firstly because it helps to assuage fears of deflation, but also because the more expensive German workers are, the more competitive the rest of Europe’s labour force becomes.  Finally, it seems that Greece, her government and their counterparts across Europe will continue to muddle through in compromise.  The risks to markets of a “Grexit” are habitually overstated (Greek equities only account for about 0.2% of the market capitalization of the broad-based S&P Europe BMI), but the uncertainty has plagued markets for half a decade.  From the perspective of sentiment as well as the long-term future of the euro – the outlook is more optimistic than it has been for some time.

Yet, one can always find reasons to be cheerful, if you look hard enough.  So is any of this important?  Or do the ECB’s actions suffice to explain the performance of European stocks?  It’s obviously hard to say definitively, but one way to seek an answer is to look at correlations.  If, day-to-day, stocks have been moving up and down in concert and without respect to their individual circumstances, then it is reasonable to suppose that a shared theme was the dominant driver of performance.  On the other hand, if correlations are relatively low then we might conclude that a widespread combination of factors has been germane.

Source: S&P Dow Jones Indices Dispersion and Correlation Dashboard, February 2015

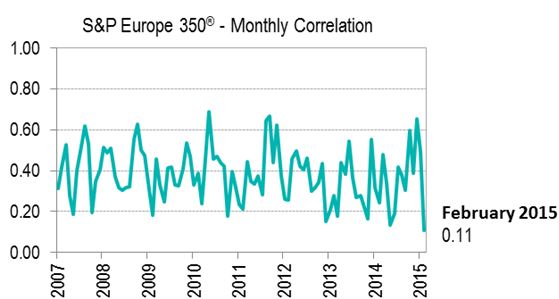
The results are intriguing.  Just before the turn of the year, the correlation figure for the S&P Europe 350 was recording three-year highs.  So, in advance of the ECB’s announcement it might to be fair to say it was all that mattered.   Since the announcement, however, correlations among European stocks have collapsed to their lowest levels on record.   So the evidence points to a range of factors supporting the performance of European equities, beyond and above the stimulus.  That might be another reason why so many investors are looking to Europe in 2015.

The posts on this blog are opinions, not advice. Please read our Disclaimers.

February Made Bonds Shiver, While Energy Kept High Yield Warm

Contributor Image
Kevin Horan

Former Director, Fixed Income Indices

S&P Dow Jones Indices

Investment-grade corporate yields widened by 15 bps, as the yield-to-worst of the S&P U.S. Issued Investment Grade Corporate Bond Index moved from a level of 2.16% at the beginning of the month to 2.76% at the end of month.  The price return of the index was -1.44% MTD, but 30 bps of coupon return brought the total return down to -1.15%.  February’s negative return was in contrast to the 2.88% gain in January.  The last time this index had a similar negative monthly return was September 2014’s -1.18%.  As of February 28, 2015, the YTD return stands at 1.70%.

High yield, as measured by the S&P U.S. Issued High Yield Corporate Bond Index, showed a contrasting reaction compared with its investment-grade counterpart.  The S&P U.S. Issued High Yield Corporate Bond Index’s yields went from 6.26% at the start of the month to 5.73% at month’s end.  The index returned 2.25% MTD and stands at 3.08% as of February 28, 2015.  February’s return help add to January’s small return of 0.80%.  With oil back up at USD 50 (as quoted by the NYMEX light sweet crude oil futures), the energy sector (15%) of the S&P U.S. Issued High Yield Corporate Bond Index returned 5.73% in February.  The last monthly return of a similar magnitude was October 2013 (2.36%).

The new-issue loan market is quiet, and market participants don’t see this changing in the near term.  The current continuation of lower rates has helped loans claw back some returns.  For the S&P/LSTA U.S. Leveraged Loan 100 Index, the YTD return of 1.67% is the index’s highest level this year.  For February, the index returned 1.45%, following January’s slow start of 0.20%.

The yield of the S&P/BGCantor Current 10 Year U.S. Treasury Index started February at 1.66% and progressively rose to 2.15% by the middle of the month, as expectation on the timing of a rate increase by the Fed was anticipated.  The end of the month saw the index’s yield reverse, moving from a high of 2.15% to a low of 1.97%, before ending the month at 2%.  Concerns from Europe over Greek funding coupled with a statement from Fed Chair Janet Yellen, which included the word “patience” in regard to rates, contributed to the end-of-the-month drop in the index’s rates.  The index returned -2.83% in February and is at 2.28% YTD as of February 28, 2015.

As of March 2, 2015, the U.S. 10-year Treasury bond is yielding 2.06% on the release of a report showing consumer purchases (adjusted for inflation) rose in January, reigniting the expectation that the Fed will take steps toward increasing rates sooner rather than later.  It is reasonable to expect rates to rise in anticipation of an eventual rate increase by the Fed.

The posts on this blog are opinions, not advice. Please read our Disclaimers.

Australian Bonds Delivered Better Risk-Adjusted Return than Equities

Contributor Image
Michele Leung

Former Director, Fixed Income Indices

S&P Dow Jones Indices

Australian equities and bonds both had double-digit returns last year.  Looking at the one-year returns as of Jan 30, 2015, the S&P/ASX Australian Fixed Interest 0+ Index gained 10.22% and the S&P/ASX 200 (TR) rose 12.48%.

While the levels of volatility came down in both markets, the annualized volatility of the S&P/ASX 200 (TR) maintained an elevated level of 11.04%, whereas the annualized volatility of the S&P/ASX Australian Fixed Interest 0+ Index stayed low at 2.19%.

Exhibit 1 shows the risk-adjusted returns of the two indices for the one- and five-year periods, and since year-end 2004.  The one-year, risk-adjusted returns of both indices outperformed the longer periods.  Noticeably, the one-year, risk-adjusted return of the S&P/ASX Australian Fixed Interest 0+ Index came at 4.67, which is four times the equities index’s return for the same period.  The risk-adjusted return seen by the S&P/ASX Fixed Interest 0+ Index is also one of the highest among the major fixed income markets.

The solid performance in the Australian fixed income market was supported by the strong gains in government bonds.  Contrary to historical performance, the S&P/ASX Corporate Bond 0+ Index underperformed other sector-level indices, despite the hunt for yields continued in other markets.  Yield contraction continued; the yield-to-worst of the S&P/ASX Australian Fixed Interest 0+ Index tightened by 103 bps to 2.42% in the same period, which is the lowest level since the index inception on Dec. 31, 2004 (see Exhibit 2 for historical yield-to-worst performance).  Interesting to note is that the current cash rate is 2.25% and the inflation rate was recorded at 1.70% in the fourth quarter of 2014, according to the Reserve Bank of Australia.

20150225a


20150225b


The posts on this blog are opinions, not advice. Please read our Disclaimers.

Indian Bond Market: Government Bonds Lead

Contributor Image
Utkarsh Agrawal

Associate Director, Global Research & Design

S&P Dow Jones Indices

The Reserve Bank of India recently surprised the market by reducing the repo rate by 25 bps in January 2015, and market experts are expecting further reduction.  While the equity markets were in euphoria, with the S&P BSE SENSEX returning 6.15% in January 2015, the bond market told a different story.

The Indian bond market has the second-highest representation by outstanding par amount in the S&P Pan Asia Bond Index, with nearly 12.8% as of Jan. 30, 2015 (see Exhibit 1).

Exhibit 1: Percentage of Outstanding Par Amount in the S&P Pan Asia Bond Index 

FI 1Source: S&P Dow Jones Indices LLC.  Data as of Jan. 30, 2015.  Past performance is no guarantee of future results.  Charts and tables are provided for illustrative purposes only.

Different countries have different thresholds for outstanding par amount to be included in the S&P Pan Asia Bond Index.  For India, the threshold for sovereign bonds and government bills is INR 30 billion, agency bonds and provincial bonds is INR 15 billion and corporate bonds is INR 3 billion.  This ensures fair representation of Indian bonds in the S&P Pan Asia Bond Index.

All Indian securities in the S&P Pan Asia Bond Index are combined to form the S&P India Bond Index, which is further divided into the S&P India Government Bond Index and the S&P India Corporate Bond Index, and in which government bonds represent nearly 88.5% of the outstanding par amount as of Jan. 30, 2015.

Exhibit 2: Historical Outstanding Par Amount in S&P India Government Bond Index and S&P India Corporate Bond Index.

FI 2Source: S&P Dow Jones Indices LLC.  Past performance is no guarantee of future results.  Charts and tables are provided for illustrative purposes only.

Exhibit 2 shows the historical outstanding par amounts in the respective indices, showing an increase to INR 48 trillion from INR 21 trillion for government bonds and to INR 6 trillion from INR 4 trillion for corporate bonds from November 2008 to Jan. 1, 2015.

During January 2015, the S&P India Government Bond Index returned 1.89%, which was 0.47% greater than the return of the S&P India Corporate Bond Index over the same period.  The reduction in key rates also affected the yields of the bonds, and the effect can be seen in the yield to worst (YTW) graph in Exhibit 3.

The correlation of the repossession rate with the YTW of the S&P India Government Bond Index was almost 82%, while the same correlation measure for the S&P India Corporate Bond Index was 69% for the six-year period ending Jan. 30, 2015.  Over the same period, the annualized return for the S&P India Government Bond Index was 7.66% and that of the S&P India Corporate Bond Index was 9.75%.  The YTW spread between the two indices has also decreased from 245 bps to 67 bps between Nov. 28, 2008, and Jan. 30, 2015.

Exhibit 3: YTW and Total Returns for the S&P India Government Bond Index and S&P India Corporate Bond Index

FI 3Source: S&P Dow Jones Indices LLC.  RBI Repo Rate Source: Reserve Bank of India.  Past performance is no guarantee of future results.  Charts and tables are provided for illustrative purposes.  YTW spread is between the YTW of the S&P India Government Bond Index and S&P India Corporate Bond Index.

To summarize, though the Indian bond market has grown, it is still dominated by government securities and monetary policy therefore plays a crucial role.

The posts on this blog are opinions, not advice. Please read our Disclaimers.

Sustainability Indices: Investment Solutions For Future Generations

Contributor Image
Daniel Ung

Former Director

Global Research & Design

Ever since the launch of the first ethical investment fund by Friends Provident in 1984, socially responsible investing has continued to grow. Global assets under management reached EUR 13.6 trillion in 2012, and mutual fund assets in Europe increased by 19% over just two years, from EUR 199.9 billion in 2010 to EUR 237.9 billion in 2012.

The increasing popularity of sustainability investing can be ascribed to the fact that investors are increasingly aware of the impact of their actions on their surrounding environment and also to the findings of recent academic research which showed that socially responsible companies tend to outperform on a variety of financial metrics in the long term. For instance, Statman (2005) concluded that returns of socially responsible indices were generally higher than those of the S&P 500®. More recent research, written by Eccles et al. (2011), showed that high-sustainability firms dramatically outperformed low-sustainability firms in terms of both the stock market and accounting measures.

Dow Jones Sustainability Indices: An Overview 

Launched in 1999, the Dow Jones Sustainability™ World Index (the DJSI World) was the first global sustainability index and is highly recognized within the investment community. One of the reasons why the DJSI series has gained widespread acceptance among practitioners lies in the reliability of the analytical inputs used to construct the index. These inputs are provided by RobecoSAM, a renowned investment specialist focused exclusively on sustainability investing. In addition to the DJSI, S&P Dow Jones Indices and RobecoSAM have developed the Dow Jones Sustainability Diversified Indices, which have a broader universe and a lower tracking error to the benchmarks.

Graph2

S&P Carbon Efficient Indices 

S&P Dow Jones Indices has also developed a series of carbon-efficient indices to address investor desire to support environmentally friendly companies and reduce carbon-related risks. The S&P Carbon Efficient Indices select the companies with the least carbon footprint per unit sales of each of the companies within the universe, based on the data compiled by Trucost, an independent specialist research provider.

Case Study: Applying Strategies to Sustainability Indices 

This case study examines whether low volatility strategies may apply to sustainability benchmarks and we have created a simulation that involves selecting the 100 least-volatile stocks from the DJSI Europe Diversified Index every 6 months. The results show that, compared to the benchmark, the annualised excess performance of the strategy is 2.8%, with a corresponding decrease in volatility of 17.5%. This suggests that traditional equity strategies may apply equally well to a sustainability benchmark as to a traditional benchmark.

Graph

Graph1

For more information about this, please read.

The posts on this blog are opinions, not advice. Please read our Disclaimers.