Get Indexology® Blog updates via email.

In This List

Tomorrow’s FOMC Minutes: More of the Same or Hints of Higher Rates

Currency Wars: Pandering to Debase

A Strange Century

Too Much Indexing?

Cracking Contango: Brent-Gas Hits 6-Year Seasonal Low

Tomorrow’s FOMC Minutes: More of the Same or Hints of Higher Rates

Contributor Image
David Blitzer

Former Managing Director and Chairman of the Index Committee

S&P Dow Jones Indices

Fed watchers will study the FOMC minutes for hints of the next interest rate move.  However, the most important data – the January employment report – was published more than a week after the FOMC meeting. That report showed strong job growth not just in January but over the last few months as data revisions presented a clearer picture of the economy.  Many Fed watchers seem to be discounting the Employment Report and focusing on low oil prices and declines in the consumer and producer price indices.  Recent comments by FOMC members suggest that the era of the zero Fed funds rate could end as soon as June, only four months away.

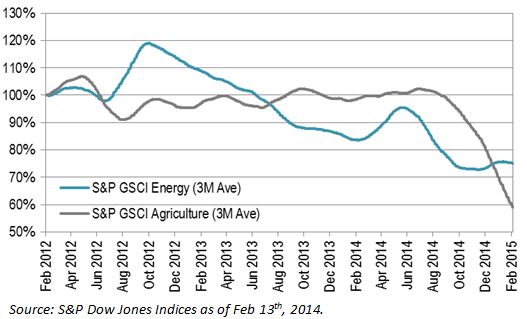
With the unemployment rate at 5.7%, weekly initial unemployment claims running at about 300 thousand per week and payrolls expanding consistently there is no doubt that the economy is enjoying strong growth.  The inflation picture is more debatable.  The Core CPI – excluding food and energy – is up about 1.5% over the last 12 months and is close enough to the Fed’s 2% goal to support returning interest rates to normal (non-zero) levels.  Oil is a question. The price of WTI crude oil made a recent low of $44.45 on January 28th but has now advanced to $52.60 on February 17th. No one knows what oil will do next or when it might rebound to the over-$100 level of last June. However, many US oil producers cannot sustain their business at current prices. There is a growing sense that, sooner or later, oil prices will rise, even if they don’t return to triple digits. When oil prices do rise, they will echo through the economy and boost other prices as well. Both the employment strength and concerns about a possible rebound in oil prices argue for an increase in the Fed funds rate.

Comments from FOMC members since the last meeting in late January point to an early move on interest rates.  The data are cited as evidence that the economy is strong and that risks are shifting to more inflation rather than more unemployment. Among those suggesting an early shift to more normal interest rates are Jeffrey Lacker of the Richmond Fed, John Williams of the San Francisco Fed, Loretta Mester of the Cleveland Fed and Esther George of the Kansas City Fed.   The FOMC vote count  may be more interesting than usual in the last, and next, set of minutes.

Many Fed watchers are expecting, or arguing for, continuing the current policy of close to zero interest rates.  While agreeing that the US economy seems strong for the moment, they fear secular stagnation – the idea that potential US economic growth is capped at around 2%, less than the 2.5% to 4% experienced in recent decades.  Potential GDP growth can be gauged by the sum of labor force growth plus productivity. Among developed nations the US is one of the few where population is growing, although growth is slowing and the population is aging pointing for slower labor force growth.  Recent labor force growth is under one percent and productivity is about three-quarters of one percent giving potential GDP growth of 1.75%.  The argument is that if potential growth is this low, now is not the time to slow down the economy or dampen employment gains.

The FOMC members may be more concerned with near term risks that economic strength could run into rebounding oil prices and raise inflation expectations.  And the members are the people who make the rate decisions.

The FOMC minutes will be released at about 2 PM on Wednesday February 18th

The posts on this blog are opinions, not advice. Please read our Disclaimers.

Currency Wars: Pandering to Debase

Contributor Image
Tim Edwards

Managing Director, Index Investment Strategy

S&P Dow Jones Indices

So far this year, we have seen a ravenous interest from U.S. investors in currency-hedged equity exposure.  Currency risks have increased; currency volatility is on the up:

FX pic 1

The reasons behind these trends can be understood in part via the nature of human psychology and power, and the reality of politics.

Consider yourself, for a brief moment, the ruler of a mid-ranking economy; the proud nation of Atlantis.  As in many parts of the world, your ministers, media and constituents are lamenting a series of profligate governments.  Mounting government and consumer debts are handicapping your hopes of Keynesian stimulus.  Meanwhile, international economic agencies besmirch your national pride: your labour force is “uncompetitive”; they and your social policies are at chiefly fault for your stuttering, moribund economy.

The choices are difficult.  You might impose drastic cuts in government services and raise taxes to “balance the books”, no doubt at the risk of further constraining the economy.  Or you could heed those plaintive calls from the IMF and drastically reform the marketplace for labour and businesses, reforming the tax code along the way for good measure.

Both options may engender significant opposition from vested interests to whom you are grateful for your position in power.  More certainly, such measures will cause abundant and vocal distress in the population.

I’m a politician – give me an easier option!

But what if you could simply debase your currency?  If the rest of the world is prepared to pay one U.S. Dollar for what is currently worth three of your Atlantan Mickles, how much more competitive would you be if you could sell the same thing for $0.50?  The answer seems obvious.  Lower your interest rates! Print money! Your currency will soon be worth nothing!

Having a less valuable currency might dent national pride, but there’s plenty to compensate.  Bond investors will benefit from falling yields; equity investors will celebrate your stimulus.  And remember those large debts? They are suddenly cheaper (in USD terms) to repay and your low-low interest rates mean that everyone’s debt just got easier to service.  Everyone’s a winner in Atlantis!

Sounds brilliant.  Are there any risks?

As anyone who has paid but the briefest attention to the critics of such programmes will know, the risk to such financial magic is the devastating consequences of too-high inflation.  Imports will immediately become more expensive, as will commodity prices in local terms.  Simply put, your citizens will have to pay more for what they buy.

And for politicians, this is a uniquely acute risk: there are few historic errors of government more stimulating to revolutionary sentiment than hyper-inflation, particularly in the absence of a rapidly growing economy.  One way of testing the extent to which your economy might be impacted by currency movements is to use the current account balance – a national measure which subtracts the value of imports from exports and accounts for other relevant financial flows (if you own property in the Bahamas and earn a rent on it, it is not an “export” but the income is nonetheless included in the current account balance).  Here are the current account balances for a few major economies:

FX 2 and a bit pic

So, can I debase my currency then?

Even if you are in command of economy with a positive current account balance, such as the countries on the right hand side of the table, only under certain conditions can one consider a strategy of currency debasement.  Inflation remains a risk and it would be incredibly helpful, for example, to have a collapse in energy and food prices before you start.

FX pic 2

Race to debase 

Well, you can see the temptation. Unfortunately, you may not be the only one to have thought of this:

FX Pic 3

So everybody’s doing it?

Therein lies the problem. We can’t all debase our currencies; it doesn’t work if everybody does it. But not quite everybody is.  The U.S. looks to be moving towards a rate increase in the next stage of its cycle, and it is no coincidence that the U.S. dollar strengthened more than any other major currency in 2014.  And that is why there is a renewed interest among U.S. investors in currency hedging their international exposures.  The stimulus and easing packages announced by central banks and governments across the world recently may well prove to deliver the anticipated benefit to local stock markets and economies.  But if a central component to their success is a depreciating currency, it makes sense to hedge it out.  In the meantime, versions of the conundrum facing Atlantis are being played out across the globe; not everyone can be a winner.

The posts on this blog are opinions, not advice. Please read our Disclaimers.

A Strange Century

Contributor Image
David Blitzer

Former Managing Director and Chairman of the Index Committee

S&P Dow Jones Indices

Credit Suisse recently published their Global Investment Year Book for 2015 covering investment performance from 1900 to 2014 for 23 countries.  The results so far in the 21st century are surprising: in 19 of the 23 markets bonds and fixed income outperformed stocks from 2000 to 2014.  The four equity markets that beat fixed income were Denmark, New Zealand, Norway and South Africa. In the 20th century stocks beat bonds in every market. (Data on China do not cover the entire century so it 22 of 22 for 20th century stocks.)

The results aren’t driven by bear markets in stocks. Although five markets show negative returns so far in this epoch, there were some reasonably strong equity markets which still lagged fixed income including Australia, Canada and Sweden. The explanation is both the currently low interest rates and the misfortunes of equities.  Ten year treasury yields peaked in the fall of 1981 and been bumping downward ever since.  The bull market in bonds covers the last fifth of the 20th century and all of the 21st we have seen so far.   The equity story is very different – once bond yields began sliding in 1981, equities began a 20 year bull market that carried them through to the turn of the century. Then fortunes turned and we have seen two deep bear markets where the S&P 500 lost about 50% since 2000.  With interest rates down to zero and even negative in a few European markets, one must believe that the bull market in bonds is close to ending.  Providing equities advance, the odds favor stocks out-performing bonds during much of the new century.

The posts on this blog are opinions, not advice. Please read our Disclaimers.

Too Much Indexing?

Contributor Image
Craig Lazzara

Former Managing Director, Index Investment Strategy

S&P Dow Jones Indices

Active management is difficult; most of its practitioners underperform passive indices most of the time; and 2014 was a particularly tough year.  Not surprisingly, active managers are not touting last year’s performance.  Instead, the pitch for active management increasingly cites its putative social benefits — arguing, e.g. that “Markets are efficient only because active managers buy underpriced assets and sell overpriced ones.”  Too much indexing, the argument goes, will produce inefficient capital markets and insufficient price discovery, as “not enough” investors trade in response to perceived misvaluation, and “too many” investors simply accept whatever price the market gives them.

At the limit, this is a logical argument; one academic observer compares misvaluation to street crime and active managers to police officers on the beat.  More police, less crime; more active managers, less misvaluation.  But:

  • A completely passive investor buys the market portfolio and then, for all practical purposes, never trades again.  In a world with some active investors and some completely passive investors, 100% of the trading is done by active investors motivated by perceived misvaluations.  With lower trading volume, there may be wider fluctuations around fair value than there are now, but there’s no reason to suppose that fair value won’t continue to be the central tendency of prices.
  • If the fluctuations away from fair value become “too wide,” the process is self-correcting.  Wider departures from fair value mean bigger opportunities for the surviving active managers; bigger opportunities mean higher alpha for the successful; higher alpha means that assets flow back to active management.  Just remember that, weighted by assets, no more than 50% of the active managers can be successful — otherwise said, that while bigger opportunities mean higher alpha for the winners, they also imply lower alpha for the losers.
  • Passive assets can rise dramatically without significantly diminishing the share of trading done by active investors.
Source: S&P Dow Jones Indices.  Assumes that passive turnover is 10% annually and active turnover 100% annually.
Source: S&P Dow Jones Indices. Assumes that passive turnover is 10% annually and active turnover 100% annually.

The reason that passive assets can rise so dramatically is that active turnover is much higher than passive turnover.  In the chart above, we assume that the average active fund turns over 100% annually versus only 10% for the average passive fund (a very generous estimate on the passive side).  On those assumptions, if half of the market’s assets are indexed, active managers will still do 91% of the trading.  Indeed, if 90% of the assets are indexed, active managers will do 53% of the trading.

It is trading, not asset ownership per se, that sets prices and putatively corrects misvaluations.  If active trading makes for an efficient market, indexing has a long way to go before market efficiency is impaired.

The posts on this blog are opinions, not advice. Please read our Disclaimers.

Cracking Contango: Brent-Gas Hits 6-Year Seasonal Low

Contributor Image
Jodie Gunzberg

Former Managing Director, Head of U.S. Equities

S&P Dow Jones Indices

The Brent crude oil and unleaded gasoline price difference, or “crack spread“, is a widely followed relationship to measure the value extracted along the chain of producing oil to refining it that can serve as a proxy for profit margins.  The EIA (Energy Information Agency) reported global gasoline supply and demand patterns have been evolving with demand greater than supply in Asia, Latin America, and the Middle East. In the U.S., the production of gasoline has been outpacing the demand, resulting in increasing exports of U.S. gasoline into the global market. Despite the relative cheapness of U.S. gasoline to the international markets from the fundamentals, the transportability has allowed benchmarks to measure the global seasonality.

gasoline exports

In indexing, the difference in roll yields can be measured to theoretically reflect the relationship between excess and shortage in the oil and gas markets since it is the storage markets that drive the shape of the curves.  There is a historically wide roll spread between unleaded gasoline and brent crude oil, seasonally in each February, where the excess inventory of unleaded gasoline markedly exceeds the excess inventory of brent. What is interesting so far this February is that the spread is the narrowest in six years.

Source: S&P Dow Jones Indices. Past performance is not an indication of future results.

According to the IEA (International Energy Agency), global refining capacity is expected to rise after falling to a six-year low and that global refinery margins will come under renewed pressure. They predict further consolidation in the refining industry, especially in Europe and developed Asia as product markets continue to expand and globalise.

While the excess inventory of brent crude oil is larger at this time than in last February, when brent showed a shortage with a positive roll yield, the excess inventory of unleaded gasoline shown by the roll yield of -3.3% is down half from last year and is seasonally very low. This is illustrated in the graph below:

Source: S&P Dow Jones Indices. Past performance is not an indication of future results.

The last time the roll spread was this narrow in February 2009, it marked the bottom of brent. The fundamentals are different this time, driven much more by supply than demand, but the resulting inventory is what might matter most.

Source: S&P Dow Jones Indices. Past performance is not an indication of future results.


The posts on this blog are opinions, not advice. Please read our Disclaimers.