The possibility of interest rates remaining low means investors will continue to search for yield while also looking to diversify market exposures. Below we offer a snapshot of two corporate bond landscapes: the U.S. corporate bond market and the Chinese corporate bond market, which has expanded rapidly in recent years.
Size
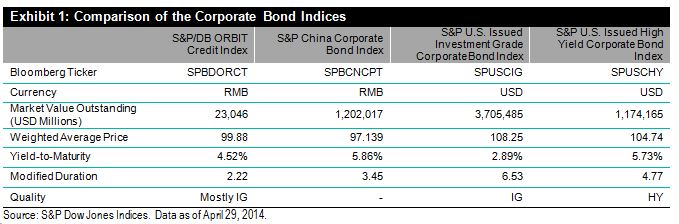
Tracked by the S&P U.S. Issued Investment Grade Corporate Bond Index and the S&P U.S. Issued High Yield Corporate Bond Index, the total size of the U.S. corporate bond market is around USD 4.8 trillion, which is approximately four times that of the Chinese corporate bond market. Within the Chinese corporate bond market, the offshore market, denoted by the S&P/DB ORBIT Credit Index, is relatively small compared with the onshore market, represented by the S&P China Corporate Bond Index.
Duration and Yield
Both onshore and offshore Chinese corporates demonstrated shorter durations and higher yields when compared with U.S. corporates. See Exhibit 1 for the comparison.
- The S&P U.S. Issued Investment Grade Corporate Bond Index has the longest modified duration and lowest yield-to-maturity when compared with other indices, which reflects the underlying bonds’ quality premium, as well as the difference in the risk-free rates.
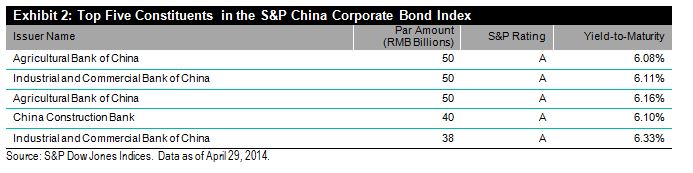
- The S&P China Corporate Bond Index measures the performance of onshore corporate bonds and is composed of locally rated investment-grade, high-yield and unrated bonds. The index generally outperforms the S&P U.S. Issued High Yield Corporate Bond Index in terms of both yield-to-maturity and modified duration. Exhibit 2 lists the top five index constituents, which are all financial entities.
- Given its short duration and mostly investment-grade-rated composition, the S&P/DB ORBIT Credit Index provides a compelling yield of 4.52%.