Later this week when Google’s class C shares begin trading there will be 500 companies but 501 different ticker symbols and stocks in the S&P 500. And beginning September 15, 2015, companies in the 500 which have multiple share classes will have all their liquid classes included. The weight of each company will represent the total float available to shareholders, just as it does today.
Multiple share classes are becoming more common in the US, especially among technology companies. The usual reason is either super-voting stock (shares with more than one vote) or non-voting stock to insulate management from takeovers or activist investors. S&P Dow Jones Indices has included multiple share classes in some foreign indices covering markets where they are common. The increasing use in the US, as highlighted by Google’s new class C shares which begin trading this week, led to a review of the index methodology for the S&P 500 and our other US indices. Under the current methodology, S&P DJI identifies the most liquid class and then increases its share count to account for all classes. This approach works well when the less liquid class is small so the increase to the share count of the liquid class is also small. However, when the excluded class is as large as the included class – as is the case with Google classes A or C – the increase in the share count can be large enough to raise concerns about liquidity. Likewise, in sector or strategy indices with fewer stocks and larger weights on each stock, increasing share counts to adjust for less liquid classes could affect liquidity.
While the shift for Google’s new class C is being done now, the shift to multiple share classes for other companies in the S&P 500 (and the S&P 100, S&P 400, and S&P 600) will be done in September 2015. (yes – 2015). This will involve several stocks and both advance planning and advance notice to market is important.
Starting on April 3rd, the S&P 500 will still have 500 companies, but there will be 501 stocks. The “extra” stock will be Google class C with no votes and Google’s current ticker symbol GOOG. Google class A with one vote will get a new ticker, GOOGL. The tickers are set by NASDAQ and Google. Google class B shares which have 10 votes per share are closely held by management and don’t trade. Since the class B doesn’t trade, it is not in the S&P 500.
The posts on this blog are opinions, not advice. Please read our Disclaimers.
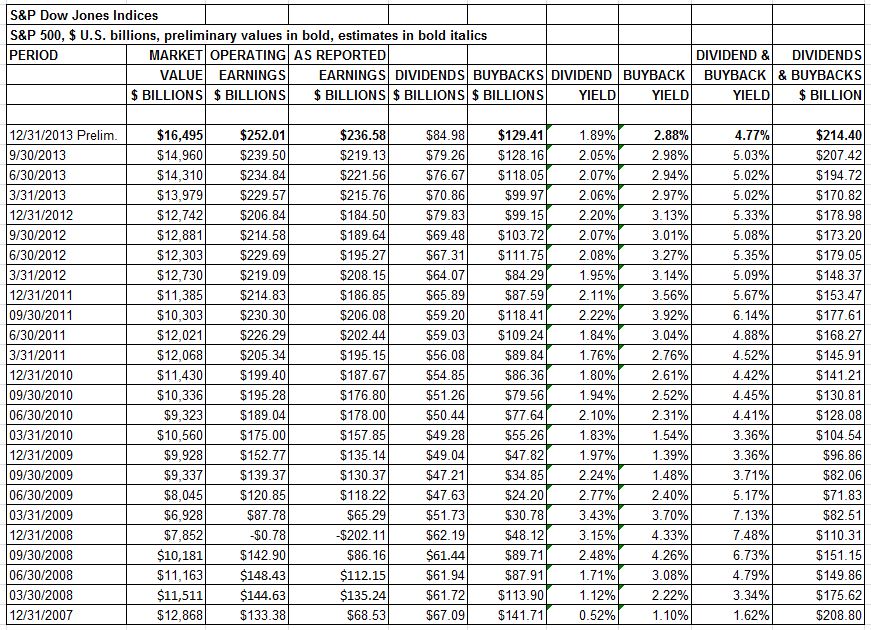
 Source: S&P Dow Jones Indices, CRSP. Data as of 12/31/2013.
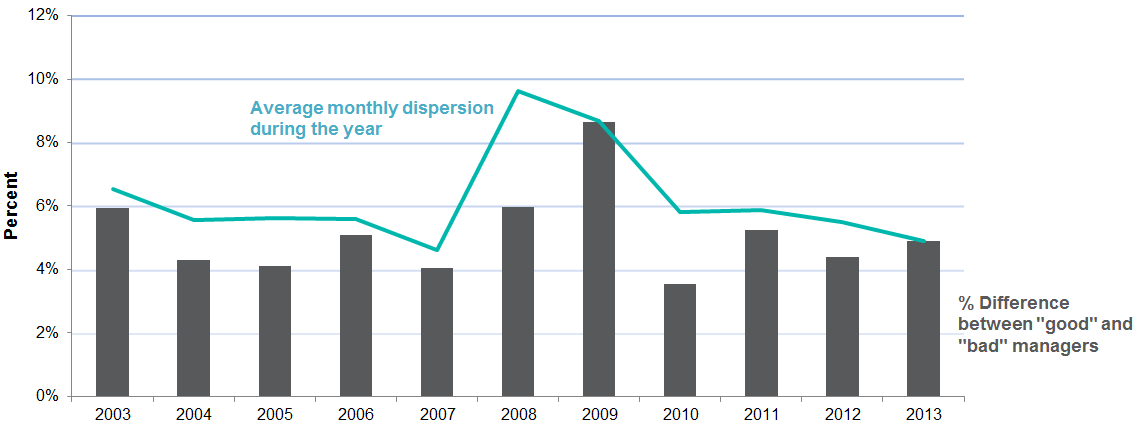
 Source: S&P Dow Jones Indices, CRSP. Data as of 12/31/2013.