Get Indexology® Blog updates via email.

In This List

Easing the Fed's Worries Over Quantitative Easing

Everyone Complains About the Weather

ETFs and William Shakespeare in 2014

BACKWARDATION IS BACK!

The Dow Jones Industrial Average in 2013? Yeah, that went well…

Easing the Fed's Worries Over Quantitative Easing

Contributor Image
David Blitzer

Former Managing Director and Chairman of the Index Committee

S&P Dow Jones Indices

Yesterday’s release of the December 17-18 2013 FOMC minutes by the Fed revealed concerns about the side effects of the quantitative easing.  While these don’t suggest an accelerated end to the Fed’s bond buying – the popular guess is still that it winds down by year end – members of the Fed’s key policy-making group do have some concerns.

First is the thought that the current rock bottom interest rates may encourage financial risk taking and bubbles.  This has been widely discussed outside the Fed so its mention is not much of a surprise. In fact, one of the goals of QE 1-2-3 was to encourage more risk-taking to boost asset prices and begin restoring wealth that vanished in the financial crisis. However, the FOMC discussion adds an interesting observation: the asset buying, unlike targeting the Fed funds rate, not only keeps short term rates close to the zero lower bound, it also affects the spreads among different maturities.  While the Fed has long experience with managing the Fed funds rate, the only previous sustained effort to shift the spreads between different maturities of treasuries was back in the 1960s in a very different market.  Some FOMC members are apparently worried that there might be unexpected or unwanted results as the spreads narrow.

While QE does affect the spreads, the Fed’s forward guidance – forecasting what it expects to do – has a larger effect on spreads between treasury maturities than QE.  Once the central bank announces that short term rates will be very low for another two years, the spread between one and two years treasuries will shrink to those very low short term rates.  Either way, altering the differences among short, intermediate and long term treasury bonds is a new and novel policy tool for the Fed.

The discussion of QE also mentions impacts on the Fed’s profit position.  “Profit” should be in quotes.  When the Fed earns a profit, the proceeds go directly to the treasury. Moreover, since its principle source of income is interest on US treasury securities, the central bank is, in effect, reimbursing the Treasury.  The concern is more likely about appearances than actual profits and losses. Currently the Fed is holding a lot of treasury and mortgage securities; when interest rates rise the prices of these bonds will drop and the Fed will book a capital loss.  In addition, the Fed pays interest on the reserves banks keep at the Fed.  How would things look if the Fed were paying banks interest while it was losing money?  The small, dedicated and vocal group that wants to do away with the Fed might seize on such an event and create havoc in the financial markets.

No rush to end quantitative easing is likely. Even with these concerns, the FOMC expects to reduce the pace of QE gradually over future meetings. In fact the only dissenting vote argued that the Fed should wait awhile longer before cutting back on quantitative easing.

The posts on this blog are opinions, not advice. Please read our Disclaimers.

Everyone Complains About the Weather

Contributor Image
David Blitzer

Former Managing Director and Chairman of the Index Committee

S&P Dow Jones Indices

The universal complaint heard today is the “Arctic Vortex” and freezing temperatures across much of the US including financial centers in New York, Chicago and Boston. Are the cold and the weather just something to complain about or do they really affect people and the stock market?  There are various academic studies about how the weather might affect the market covering the US using New York City weather data, Australia and even Thailand.  The results for cold and stock prices are mixed: some find some weak connection between daily temperatures and stock price movements, some find no result at all.  However, a number of studies find a connection between sunshine or clouds and stock prices – if the morning is sunny, the market is more likely to advance.  While one day is clearly an insufficient sample, the sun is out in New York (despite the five degree temperature) and the market is up.  Clouds, overcast and rain seem to be associated with mixed to poor markets, probably another case of psychology and (ir)rationality driving stocks.

Cold does make one large, unfortunate difference: extreme cold, or hot, weather increases mortality rates. Cold is far more damaging than hot weather, so much so that one study found that people migrating to the southern states in the US is contributing to increasing life expectancy in the statistics.

The posts on this blog are opinions, not advice. Please read our Disclaimers.

ETFs and William Shakespeare in 2014

Contributor Image
Michael Mell

Global Head of Custom Indices

S&P Dow Jones Indices

“A rose by any other name would smell as sweet” Juliet says to Romeo when trying to illustrate it is the essence of a something which is important, not what it’s called.  If Shakespeare were alive today, and Juliet were an investor, would he have her say the same things about an ETF?  Would she tell her beloved Romeo that an ETF by any other acronym would still invest in an index and be transparent?  Should 2014 turn out to be the year of the actively managed “ETF”, the answer is probably no because the essence of what had defined ETFs may completely change.

If it is the essence or function of something that matters, like the sweetness of a rose, then the acronym “ETF” could become misleading.   A simple google search of “ETF” in 2013 yields Wikipedia as the very 1st link. In the first paragraph on ETFs Wikipedia states “Most ETFs track an index, such as a stock index or bond index. ETFs may be attractive as investments because of their low costs, tax efficiency, and stock-like features”.[1]  In the 2nd link, Investopedia defines an ETF as a “A security that tracks an index, a commodity or a basket of assets like an index fund, but trades like a stock on an exchange.”[2]

Thus the average investor would probably conclude the function (or essence) of an ETF is to track an index, therefore you know what you are purchasing.  It’s fair to assume they might also deduce that ETFs are good alternatives to many mutual funds because ETFs are said to be “cheap” and “transparent”.  Since their inception till 2013 ETFs have been synonymous with passive investing, just as roses have always been deemed to smell sweet.  This has arguably been a key driver to the success and growth of ETF industry and a boon to investors.

In 2014 we may see the beginning of an unraveling in the commonly assumed (and generally accurate) definition of ETFs because “actively managed ETFs that would be permitted to report their portfolio holdings quarterly” [3] may become typical for many new “ETF” launches. “That would put their reporting requirements on par with traditional mutual funds.”[4]  Thus if one uses the acronym “ETF” to describe both active and passively managed strategies a contradiction ensues, unless of course Wikipedia, Investopedia and countless others totally change their understanding of an ETFs essence.

The posts on this blog are opinions, not advice. Please read our Disclaimers.

BACKWARDATION IS BACK!

Contributor Image
Jodie Gunzberg

Former Managing Director, Head of U.S. Equities

S&P Dow Jones Indices

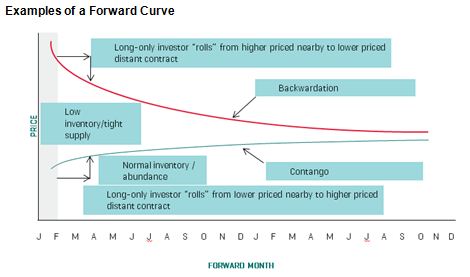
2013 is the first year commodities have been in backwardation since 2003.  For those of you who need a refresher on the definition of backwardation, you are not alone, so here it is: “When a near-month futures contract is trading at a premium to more distant contracts, we say that a commodity futures curve is in “backwardation” or that the commodity is “backwardated.” This occurs when inventories of commodities are tight so market participants are willing to pay a premium to buy the immediate deliverable commodity. Theoretically there is no value to carrying costs such as storage, insurance and interest costs since there is a scarcity of the commodities.”

Also, for illustrative purposes, this graph may help:

Chart is provided for illustrative purposes only.

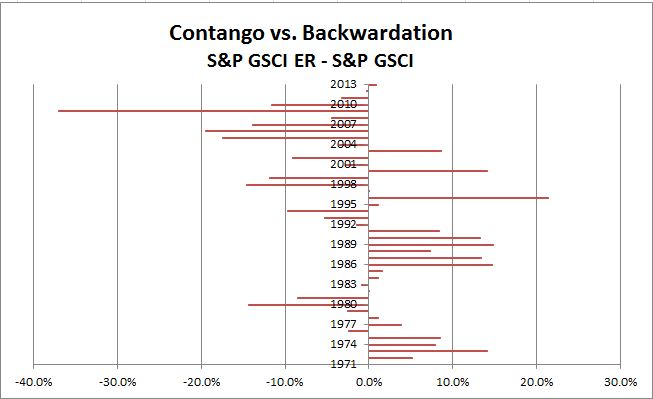
The measurement of the historical backwardation (and contango, which is the converse of backwardation) shown in the chart below calculates the annual roll yield by taking the annual return of the S&P GSCI Excess Return (which measures the price return plus the roll return) less the annual returns of the S&P GSCI Spot Return (which measures the price return only). Backwardation was implied by a positive result, whereas contango was implied by a negative result. Notice 2013 had the first positive result since 2003.

Source: S&P Dow Jones Indices. Data from Dec 1970 to Dec 2013. Past performance is not an indication of future results. This chart reflects hypothetical historical performance. Please see the Performance Disclosure at the end of this document for more information regarding the inherent limitations associated with backtested performance.

The implication of this, as mentioned in a paper titled “Identifying Return Opportunities In A Demand-Driven World Economy” published by Marya Alsati-Morad, Peter Tsui and me, is that when commodities are backwardated, indices like the S&P GSCI and DJ-UBS that hold the near-month commodity futures contracts may earn a positive return from rolling into a cheaper contract before expiry.

For extra valuable insight on the impacts of contango and backwardation, please watch this special interview with Bob Greer, Executive Vice President & Manager of Real Return Products, PIMCO and Boris Shrayer, (former) Managing Director & Global Head of Commodities Marketing, Morgan Stanley.

For more on the environment and the index development and rolling versus weighting please see the links aforementioned.

Last but not least, something that is particularly interesting is that the last long streak of backwardation happened in 1984-1991, following a precipitous drop in gold of 48% from 1980-84.  During this the time of backwardation, the S&P GSCI returned positive every year between 1984-1990 for a total of 221%.

Source: S&P Dow Jones Indices. Data from Dec 1983 to Dec 1990. Past performance is not an indication of future results. This chart reflects hypothetical historical performance. Please see the Performance Disclosure at the end of this document for more information regarding the inherent limitations associated with backtested performance.

The posts on this blog are opinions, not advice. Please read our Disclaimers.

The Dow Jones Industrial Average in 2013? Yeah, that went well…

Contributor Image
Jamie Farmer

Former Chief Commercial Officer

S&P Dow Jones Indices

A steadily improving economy and no small amount of performance-enhancing stimulus from the Fed re-enthused equity investors in 2013, leading the Dow Jones Industrial Average to finish in record territory.

Let’s go to the tape:

  • Impressive Climb – The DJIA finished the year at 16,576.66, up 3,472.52 or 26.50%.  That performance leaves us with the latest in a series of record closes, the best annual percentage gain since 1995 and the largest annual point gain in history.
  • Leader & Laggard – Boeing (BA) was the standout contributor of the Dow, adding 444.47 points in 2013.  IBM subtracted 27.48 points to finish as the biggest detractor.
  • Industry Performance – All industries added to the DJIA’s advance in 2013 – Industrials led, followed by Financials and Consumer Services.
  • The Good – The biggest single day point gain – up 323.09 or +2.18% – was posted on October 10.  Despite finding themselves on Day 8 of the US government shutdown, investors were heartened by indications that House Republicans would offer a deal to raise the debt ceiling.
  • The Bad – The biggest single day point loss – down 353.87 or -2.34% – was June 20 when the market had an – ahem – adverse reaction to Bernanke’s comments about tapering of the Fed’s bond buying program.
  • Changes – There were three additions/deletions in 2013:  Hewlett Packard (HPQ), Alcoa (AA) and Bank of America (BAC) were removed after the close on September 20 and Goldman Sachs (GS), Visa (V) and Nike (NKE) were added for the opening of trading on September 23.
  • Dividends – All 33 stocks that were components in 2013 paid cash dividends, with nearly $124 billion paid.  Exxon paid out the most with nearly $11 billion distributed to shareholders.
  • Volatility – at 9.40, the DJIA’s realized annual volatility continued a downward trend from a peak of over 26 seen during 2009.
  • Potpourri – there were 52 record closes in 2013, the most since 1995; as of the close of 2013, the DJIA is up 153.19% from its financial crisis low of 6,547.05 hit on March 9, 2009; and, we experienced two major milestones in 2013 with the DJIA eclipsing both 15,000 and 16,000 about 6.5 months apart

The posts on this blog are opinions, not advice. Please read our Disclaimers.