Get Indexology® Blog updates via email.

In This List

Healthcare growth drivers for the large employer market

Plot Thickens for Puerto Rico Bonds

Volquakes

Facebook and the S&P 500

Australian Corporate Bonds Outperformed the Market

Healthcare growth drivers for the large employer market

Contributor Image
Glenn Doody

Vice President, Product Management, Technology Innovation and Specialty Products

S&P Dow Jones Indices

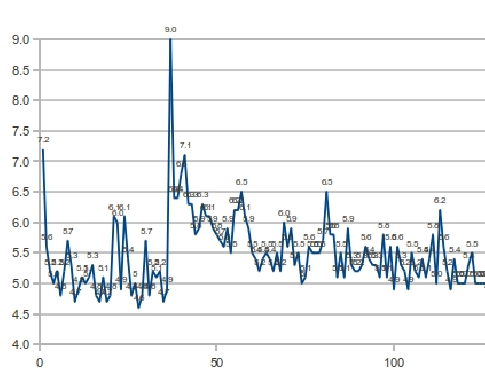
An article published Friday in Healthcare Payer News, “How health inflation could slow, or rise, in 2014” indicates a projected 6.5% increase in the large employer medical inflation for 2014 by PWC Health. As can be seen by the S&P Healthcare Claims Indices, an index series comprised of claims data provided by leading insurers in the US market, inflationary costs for large group medical claims fell from over 8% increase year over year in 2008 to about 4% from 2009 through the end of 2010, before dipping again to just under 3% in 2011 and 2012. For the ASO market, which comprises significantly more lives than Large Group, cost increases fell from 9% to roughly 5%, before dipping to just above 4% in 2011. An increase to 6% would represent a significant uptick in cost expenditures for the large employer market. The article goes on to talk about a growth rate of 4.5% after plan design changes, which take into account modifications to deductibles and other plan design features. The S&P indices, which were created in partnership and consultation with Aon Hewitt and Milliman consulting, are designed to look at overall costs of healthcare, and do not take into account plan design, which can be different from insurer to insurer. The same trends shown in the chart are also available from S&P for geographic regions, including census division, region, states, and major metropolitan areas.

S&P Healthcare Claims National Large Group FFS Medical Total Cost Index

The posts on this blog are opinions, not advice. Please read our Disclaimers.

Plot Thickens for Puerto Rico Bonds

Contributor Image
J.R. Rieger

Former Head of Fixed Income Indices

S&P Dow Jones Indices

The story plot thickens for Puerto Rico bonds as Moody’s placed bonds issued from Puerto Rico under review for a possible downgrade to below investment grade.  Selling pressure continues to mount impacting the market.  The S&P Municipal Bond Puerto Rico Index has seen a negative total return of 19.45% year to date and the weighted average price of bonds in the index has fallen by over 24% this year.   The weighted average yield (YTW) of bonds in the index ended at 7.26% or  419bps higher than investment grade bonds.

Investment grade municipal bonds tracked in the S&P National AMT-Free Municipal Bond Index have seen a negative 3.21% return year to date. Secondary trading in the muni market tends to get lighter before and after the holidays and it is still wrestling with a  heavy new issue calendar.

Tobacco settlement municipal bonds also have been weaker.  The S&P Municipal Bond Tobacco Index has declined by 8.96% year to date.  The index tracks over $82billion in par value of tobacco settlement bonds.  Yields on these bonds have risen 267bps over the course the year to end at 6.89%. These high yield, long duration bonds are impacted by both credit risk driven by declining tobacco use and the possibility of rising rates.


Investment grade municipal bond yields vs Puerto Rico municipal bond yields

The posts on this blog are opinions, not advice. Please read our Disclaimers.

Volquakes

Contributor Image
Tim Edwards

Managing Director, Index Investment Strategy

S&P Dow Jones Indices

Volatility can feel like an earthquake.

As many investors can painfully testify, the chart below is typical of volatility.  A period of relative calm is disturbed first by a few small tremors, then by a precipitous rise.  At this point, risk breaks all connections with its normal level and climbs rapidly to a crystalized zenith of distress and chaos … before declining, at first rapidly then slowly; rollercoasting through a cascade of aftershocks as the grind back down to normality occurs.

Volquakes

Note: Chart courtesy of Groundswell Earthquake Outreach

Volatility can feel like an earthquake, and it’s far from simply a romantic metaphor.  As the reader may have already guessed, the chart above is not from any financial market. In fact it shows the measured magnitude of foreshocks, aftershocks and the actual ‘Great East Japan Earthquake’ at Tohoku on March 11th, 2011. The reading of 7.1 immediately subsequent to the main spike is better known, resulting ultimately in the failure of the nuclear plant at Fukushima.

The statistical properties of earthquakes are the subject of much serious academic research, the fruits of which allow for empirical predictions of the number, magnitude and frequency of aftershocks.  In 2010 a group of physicists tested these sharpened tools on market volatility, with a remarkable degree of success.   Put simply, the statistical rules that explain earthquakes also fit and predict the patterns of stock market volatility.

Such analytic dissections are certainly interesting to options and volatility traders.   And these relationships provide the rest of us with a deeply meaningful analogy for the judicious management of risk.  If you live near a fault line, take very close heed of tremors; immediately after an earthquake, prepare for the aftershocks accordingly. 


The posts on this blog are opinions, not advice. Please read our Disclaimers.

Facebook and the S&P 500

Contributor Image
David Blitzer

Former Managing Director and Chairman of the Index Committee

S&P Dow Jones Indices

On December 11th, after the market closed, S&P Dow Jones Indices announced that Facebook will  join the S&P 500 as of the market open on Monday, December 23rd.   This was probably one of most predicted, asked about and commented on additions to the S&P 500 in the last few years, Measured by the number of suggestions to (or demands of)  the index committee, Facebook ranks with other tech darlings including Google, Yahoo and AOL.

Facebook closed at $49.38 on December 11th before the index announcement and opened at $51.04 on December 12th, an overnight gain of 3.4%.  The move is similar to other recent index additions, but is a good deal lower than some of the overnight jumps seen in the past.  Most likely market participants were expecting an announcement on Facebook – one analyst predicted it shortly before the announcement of General Growth Properties as the replacement for Molex a couple of weeks ago.

Wall Street analysts and bankers ask about index additions because they are guessing who will be next. Their questions are Why this one? Why now? Did you worry about being under-weighted in that sector?  Some answers –

Why Facebook? The S&P 500 is often termed “leading companies in leading industries.”  Facebook is certainly a leading company in internet software and services which is definitely a leading industry. No one suggested that it should not have gone in. Why Now? Two factors: our guidelines require four quarters of positive earnings according to GAAP and Facebook only reached this last fall. Second, this is a large company and we wanted a date with a lot of trading and liquidity.  The third Friday of the last month of the quarter, when futures and options expire, is such a day.  Were we worried about sector weighting?  It was not the primary factor in this decision.  Who’s next? Stay tuned.

The posts on this blog are opinions, not advice. Please read our Disclaimers.

Australian Corporate Bonds Outperformed the Market

Contributor Image
Michele Leung

Former Director, Fixed Income Indices

S&P Dow Jones Indices

Tracked by the S&P/ASX Corporate Bond Index, the size of the Australian dollar denominated corporate bond market currently stands at 57 billion, which is one-tenth of the broader benchmark, the S&P/ASX Australian Fixed Interest Index. While the corporate sector is relatively small in Australian bond market, the size actually grew more than 80% since the index incepted in 2005.

In fact, if we trace back to the history, the corporate bond market has undergone a vast development. Since the early 80s, there was a transition from predominantly publicly owned issuers to private issuers. Driven by the deregulation of the financial system and removal of capital control, a solid growth in corporate bond market, particularly bank bond issuance, was observed.

Although some corporate issuers are attracted to the offshore market, as to minimize and diversify their funding cost and also to match their foreign currency revenue streams, it is also witnessed there is a strong investor demand in the corporate bonds denominated in Australian dollar.

Benefited from the continuous hunt for yield, the S&P/ASX Corporate Bond Index delivered a robust total return of 3.95% year-to-date (YTD), as of December 5, 2013. The corporate bonds outperformed the market, compared with the 0.09% YTD gain of S&P/ASX Government Bond Index. The yield to maturity grinded 20bps tighter to 4.31%, it is appealing in this low rate environment and considered the minimum credit rating for index inclusion is BBB-/Baa3/BBB-.

The investor appetite for the risk-adjusted return is also reflected in the tightening spread to the Australian government bonds. As shown in Exhibit 1, the spread has already contracted from 1.37 a year ago to currently 0.65 level, which is also the tightest level that spread reached in 2006. It means the investors are now accepting a lower relative yield to own the risker asset.

Perhaps it seems to hint that investors are now ready for the further expansion in corporate bond market…

Current Spread of S&P/ASX Australian Government Bond Index

The posts on this blog are opinions, not advice. Please read our Disclaimers.