Get Indexology® Blog updates via email.

In This List

The Dow: 3 for 3

Man Bites Dog

Beta, Smart and Dumb

RECORD BREAKING MONTH: Commodities Love War and Heat

Hope is a Good Thing

The Dow: 3 for 3

Contributor Image
David Blitzer

Former Managing Director and Chairman of the Index Committee

S&P Dow Jones Indices

This morning (September 10th) S&P Dow Jones Indices announced three deletions and additions for the Dow Jones Industrial Average.  This post explains why we made these changes. The press release is on www.spdji.com

The Dow is price weighted – each stock’s weight is the ratio of its price to the total of the prices of all 30 stocks.   When the largest stock price is about 185 and the sum of all 30 prices is about 1943, an eight dollar stock has little impact – a weight of about 0.4% (or 40 basis points).  The three stocks being dropped together represent about 3% weight in the index.  At the same time, the high price stocks have a disproportionately large impact on the index. The highest price stock at about 185 has a weight of about 9.5%.   After the changes the highest weight stock is lower at 8% and the lowest rate is more than doubled at 1%.  The improved weighting means that we are not wasting one or two of the thirty names on stocks with minimal weight.

The changes also improve the sector representation. Adding Nike provides more exposure to consumer discretionary stocks and introduces apparel and footwear as well. BankAmerica and JP Morgan Chase are quite similar to one-another; replacing BankAmerica with Goldman Sachs gives some diversity to the financial sector.  Likewise, Visa adds diversity to the tech sector compared to Hewlett Packard.  Hewlett Packard’s businesses are close to those of other tech companies in the Dow while Visa is a leading payment network operator, an activity not as well represented by other Dow stocks.

Changes to the Dow always bring a lot of questions from the media and investors. Three asked today:

The most asked question of the day was probably “why not Google?”  The answer is price weighting – Had we added Google and dropped some high priced stock; Google would have dominated the index with a weight of 25%-30%.  Google may be important, but we shouldn’t pretend it is a quarter to a third of the whole market.

Close behind Google is whether we thought about changing to a different weighting method.  We think about, and discuss, a lot of things with indices. The Averages Committee, which is responsible for the Dow, the Dow Transports and Dow Utilities, will review some recent work on how indices are weighted.  Whether any changes will be made is a question for the future – wait and see.

Do additions or deletions say anything about the companies?  First, additions or deletions to the Dow or other indices are NOT investment recommendations.  Second, the goals in these changes to the Dow were to improve the sector balance and improve the weighting, not to pick stocks.


The posts on this blog are opinions, not advice. Please read our Disclaimers.

Man Bites Dog

Contributor Image
Tim Edwards

Managing Director, Index Investment Strategy

S&P Dow Jones Indices

Everyone wants to invest with the ‘smartest guys in the room’. But what do the smartest guys invest in? Well, a poll of mutual fund professionals suggests a very surprising result.

As regular readers of this blog will know, while there are plenty of managers who can show attractive returns over the past few quarters it is statistically almost impossible to find managers that can deliver better-than benchmark returns persistently over longer time periods.

But we’re not the only voice in this argument. An entire industry of active fund managers are gainfully and necessarily employed in the cut-and-thrust of this debate. That’s why I was fascinated to come across this article. In summary: 77% of mutual fund professionals are moderately or significantly invested via passive investment products. So perhaps they too see the value of index investing, at least for a portion of their personal account.

It’s always pleasing when we see evidence that our data are being used to help inform investment decisions, so I hope you’ll join me in applauding the investment acumen of active managers who invest passively. They might appreciate the irony.

The posts on this blog are opinions, not advice. Please read our Disclaimers.

Beta, Smart and Dumb

Contributor Image
Craig Lazzara

Former Managing Director, Index Investment Strategy

S&P Dow Jones Indices

The idea of “smart beta” is gaining increased acceptance, although not without some controversy.  I have to confess that I really dislike the term “smart beta,” and not just because I didn’t invent it.  “Alternative beta” I can live with, or “factor” indices, or “strategy” indices — but “smart” beta leaves me cold.

Which is not to say that I dislike the concept.  Unlike more venerable capitalization-weighted indices, factor indices are designed to produce a particular pattern of returns, or to exploit a putative inefficiency in securities pricing.  For example: the S&P 500 Low Volatility Index extracts the least volatile members of the S&P 500; it aims to produce a pattern of returns less volatile than that of the parent index, and to exploit the so-called low volatility anomaly.  Like most factor indices, S&P 500 Low Vol is not capitalization-weighted (each component’s weight in the index is in inverse proportion to its volatility).  For investors who find a less-volatile pattern of returns congenial, Low Vol can be a very “smart” strategy.

So why do I object to the “smart beta” label?  “Smart beta” suggests that traditional cap-weighted indices are somehow less than fully smart.  That may be a clever marketing hook, but it misstates the investment merits.  Most active managers underperform cap-weighted indices most of the time.  That means that one of the smartest things an investor can do is to use cap-weighted indices as the core of his portfolio.


The posts on this blog are opinions, not advice. Please read our Disclaimers.

RECORD BREAKING MONTH: Commodities Love War and Heat

Contributor Image
Jodie Gunzberg

Former Managing Director, Head of U.S. Equities

S&P Dow Jones Indices

August was a hot month for commodities from the Syrian unrest and the heat.  In the risk on – risk off environment created by the quantitative easing, the sentiment has shifted to risk off. While that is not good news for some economically sensitive commodities like copper, it is great news for others like precious metals, which was the best performing sector for the month, up 7.9%.  The S&P GSCI Silver had its best August ever on record since 1973, gaining 19.5%.  Also, the heat was a factor that drove the S&P GSCI Soybeans to have its 3rd best August on record and the best since 2003.

Below are the highlights from our monthly commentary:

All five sectors of the S&P GSCI had positive returns in August, driving the index
up 3.4% MTD—now in positive territory for the year, up 2.6%.

  • S&P GSCI Precious Metals was the best performing sector, up 7.9% MTD, due to political tensions in Syria. During the month, silver was the best performing commodity in the index, up 19.5%, recording the best August in its history.
  • S&P GSCI Energy also benefited from the oil supply concerns from Syria, driving the sector index up 4.0% for the month.
  • Hot and dry weather in the U.S. Midwest was another major fundamental driving commodities in August, which pushed S&P GSCI Soybeans up 12.5%—its third best August since 1970.
  • Sugar and coffee, down 3.7% and 4.0%, respectively, were the worst performers of the month thanks to pressure from record harvests.

Also below, are the Q&A from our commodities clip:

Q1.  In July, you titled your commodities commentary as “some commodities like it hot”, so tell us, which commodities liked the hot weather of August?

Soybeans benefited the most in August from the hot and dry weather across the US Midwest.  It was the 3rd best August on record since the index data started in 1970.  This month the S&P GSCI Soybeans was up 12.5%, the most in an August in 10 years when it was up 15.8%. The only time prior to that with a bigger August monthly gain was in 1983 with a rise of 26.6%.

Q2.  There has been lots of news about the political unrest in Syria. How has this affected commodities?

Historically war has been supportive for commodities since raw materials are consumed at a high rate to fight wars. In the risk on/risk off environment we are experiencing from the quantitative easing, the potential of war has helped precious metals as the sector may also be viewed as a safe haven or a currency. The S&P GSCI Precious metals was the winning sector in August up 7.9%. Gold, the main commodity in the sector gained 6.3% in August and is now up 13.9% from the end of June, after it fell into a bear market down 23.4%.  However,  Silver in the index gained 19.5%, recording its best August since the index started in 1973. This was also its best month since April 2011, cutting its YTD loss from 35.5% to 22.9%.

Q3. Has the weather caused any commodities to be not so hot in July?

Sugar and Coffee were the biggest losers in August, down 3.7 and 4%, respectively, and coffee is the worst performing commodity YTD, down 24.9%.   An outbreak of a leaf-rust fungus in Central America is causing crop damage; however, some areas in Brazil, Colombia, and Vietnam are having record harvests.

Q4. Is there anything else you would like to add?

The S&P GSCI had another strong month, up 3.4% in August, bringing the YTD performance into positive territory up 2.6%.  The fundamentals like weather continue to drive commodities but the macro themes are strong including Chinese demand and the quantitative easing. Many will be watching the US Fed on September 18 when it may discuss its bond-buying program. If yields remain low and stall the dollar’s rise, that could give commodities priced in US dollars a positive boost.

The posts on this blog are opinions, not advice. Please read our Disclaimers.

Hope is a Good Thing

Contributor Image
Alka Banerjee

Former Managing Director, Product Management

S&P Dow Jones Indices

The unprecedented decline of the Indian Rupee has been the headline for the past few weeks. The chief drivers have been high current account deficits fuelled (literally) by oil- the sluggishness of the Indian economy driving out foreign investments, which had been impacted by the tapering of the quantitative easing program of the Federal Reserve in the US. No clear and easy solution in sight has further exacerbated the situation.
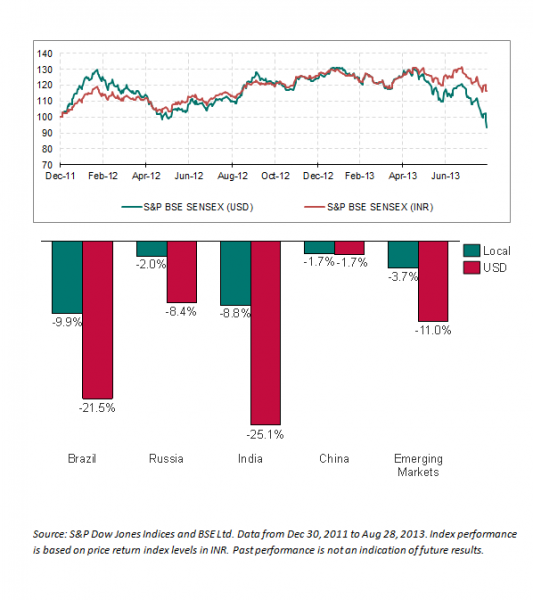
So, how does this all show up in the world of indices? The S&P Indian Rupee Total Return index, constructed using forward currency contracts and designed to replicate the performance of the Indian Rupee versus the U.S. Dollar, is down 16.64% year to date (as of August 28). Another way to look at the currency performance is contrasting the returns of the S&P BSE SENSEX in rupee and USD terms. On a year to date basis the USD version of the S&P BSE SENSEX underperforms the former by 17.5%. A comparison of the various S&P BMI country indices computed in the local currency versus that computed in U.S. dollars highlights that this is not a unique Indian situation. Looking at the returns for BRIC countries and overall emerging markets year to date (August 28) 2013 show that while Indian markets were not the worst performing in terms local currency but were in USD terms. Brazil is quite close to emulating both the performance of the Indian market in rupee and dollar terms as the real has had a similar slump while the Chinese market and currency have been extremely resilient. The tight band that the Chinese renminbi is allowed to trade in, along with the much stronger economic situation of China, has helped to stem the fall. The broad emerging markets have not done well this year as almost all emerging market currencies have come under pressure after the U.S. Federal Reserve indicated a pull back of the quantitative easing program.

Whether the Indian rupee decline has an impact on the stock market is still to be seen. No doubt the market has been extremely volatile in the last few weeks with some surprising short term upswings in the midst of all the gloom. While there is little dollar denominated sovereign debt, Indian companies, which borrowed in dollar terms this past year as rates were low and companies heavily dependent on imports should see some pressure especially if growth remains anemic.

Hope is a good thing_Alka

The posts on this blog are opinions, not advice. Please read our Disclaimers.