In a previous blog post, Evolution of Canadian REITs, we outlined the evolution of the Canadian REITs market. In this post, we will explore in detail the S&P/TSX Capped REIT Income Index, which is designed to serve as an income-producing strategy.
The index seeks to measure the performance of REIT companies in the S&P/TSX Composite, while overweighting and underweighting companies based on their risk-adjusted income distribution yield. It is tilted in favor of securities with yields that have not fluctuated widely. By using risk-adjusted yield—computed as 12-month trailing yield divided by the standard deviation of yield—the higher weight is placed on securities with more stable yields. Also, given that REIT securities tend to be more volatile than the market, the methodology aims to ensure that higher yield does not come at the price of higher return volatility.
To allow for capacity, the constituents are weighted by their risk-adjusted yield ratio times their float-adjusted market cap, with the maximum weight capped at 10%. This way, smaller companies with high yields do not have such a disproportionate weight in the index, and the same applies for large companies with lower yields.
The standard deviation of yield is calculated using the previous 36 months of income distribution yield history. The ability to pay dividends over three years indicates a firm’s strength and stability. There is also less chance of dividend cuts, which are perceived negatively in the market.
Exhibit 1 shows that the S&P/TSX Capped REIT Income Index outperformed the benchmark, the S&P/TSX Composite, on a risk-adjusted basis over the period studied. Historically, the S&P/TSX Capped REIT Income Index exhibited higher best monthly returns, average monthly returns, and maximum rolling 12-month returns compared with the benchmark.

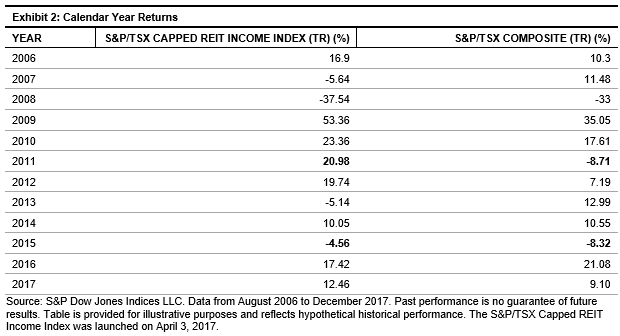
Exhibit 2 shows the calendar year performance of the S&P/TSX Capped REIT Income Index versus the underlying benchmark. We can see that the strategy outperformed the underlying broad market in 8 out of 12 years.
Higher Yield Than the Broad Market
From December 2006 to February 2018, the S&P/TSX Capped REIT Income Index generated an average historical yield of 6.1%, compared with 2.8% for the benchmark.

A full report on the S&P/TSX Capped REIT Income Index can be found here.
The posts on this blog are opinions, not advice. Please read our Disclaimers.