Get Indexology® Blog updates via email.

In This List

Inflation

Asian Fixed Income: 2016 Pan Asia Report Card

Passive Investing – Myth or Reality? Part 2

Capturing the World’s Largest Growth Story: the Emerging Markets Consumer

Minimizing the Pain of Regret

Inflation

Contributor Image
David Blitzer

Former Managing Director and Chairman of the Index Committee

S&P Dow Jones Indices

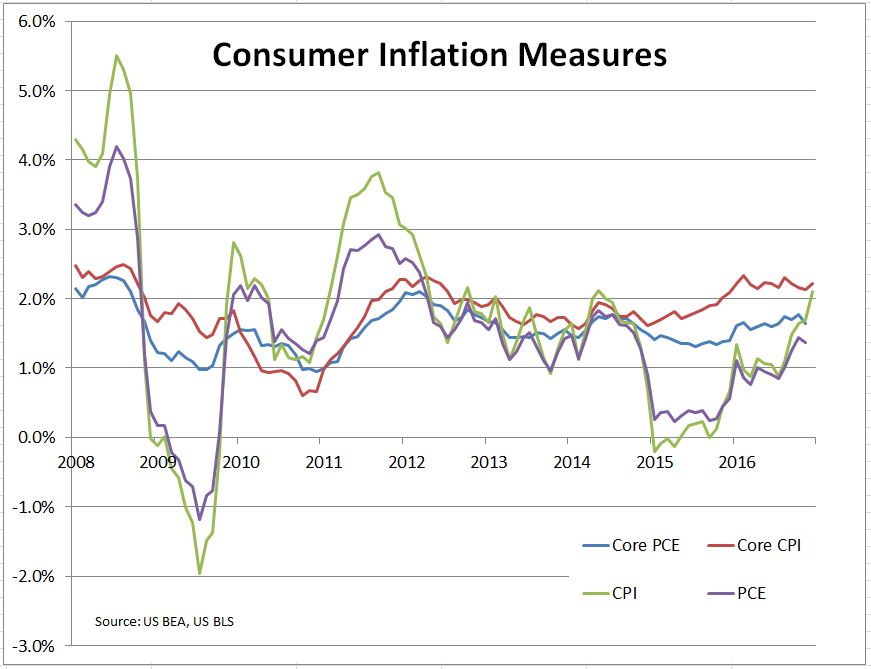
Supported by a stronger economy and higher oil prices, recent readings of inflation are rising. The Fed’s principal gauge, the personal consumption expenditures deflator excluding food and energy (Core PCE) is approaching but still below its 2% target. The more widely recognized CPI and CPI excluding food and energy are both rising and a bit over 2%. (See chart).

While nothing on the horizon suggests a sudden surge in prices, the forces affecting inflation point to a risk that inflation moves higher over the next couple of years. The unemployment rate is under 5% and trending downward and wages are (finally) showing some sign of advancing.  Falling unemployment means that the economy is growing more than fast enough to absorb new entrants to the labor force.  If this continues and unless labor force participation climbs, the unemployment rate will continue dropping and wages are likely to see more gains.   Low and falling unemployment is not the only economic factor behind inflation.

With a growing economy aggregate supply must expand in tandem with aggregate demand if price pressures are to be avoided.  The initial impact of the stimulus packages being discussed by the President and Congress will be on demand.  Lower taxes mean more spending by consumers and business. Government or private sector spending on infrastructure will add to demand now and to effective supply later.  The impact of any stimulus program on inflation or growth depends on how the economy condition at the start of the program. Since the economy is in reasonable shape now, some of that impact will be felt as inflation rather than real GDP growth.

Expectations of future inflation are an important determinant of inflation.  Were business to anticipate rising inflation it would be a reason to raise prices. Expectations depend on recent experience of inflation. Since the last time the core CPI inflation rate was over 2.5% was in 2007, inflation expectations are fairly neutral now. The risk is that a gradual increase from the Fed’s 2% target towards 2.5% or 3% will cause people to re-evaluate their expectations of future inflation.

The prospects for inflation also depend on numerous wild cards. If oil prices spike, or collapse, inflation will do the same. If the economy slips into recession, we will return to worrying about deflation; if GDP growth surges inflation will advance.  But none of these is predictable.

The posts on this blog are opinions, not advice. Please read our Disclaimers.

Asian Fixed Income: 2016 Pan Asia Report Card

Contributor Image
Michele Leung

Former Director, Fixed Income Indices

S&P Dow Jones Indices

The S&P Pan Asia Bond Index, which seeks to track local currency bonds in 10 countries and is calculated in USD, continued to be weighed down by the weakness of local currencies in 2016, dropping 1.86% for the year.  Meanwhile, its yield-to-maturity widened 38 bps to 3.75% YTD.  Reversing the trend seen in 2015, the S&P Pan Asia Government Bond Index was down by 1.33% in 2016, still outperforming the S&P Pan Asia Corporate Bond Index, which fell 3.11% over the same period.  The size of Asia’s local currency bond markets, as measured by the S&P Pan Asia Bond Index, gained 20% to reach USD 10.3 trillion in 2016, reflecting steady market expansion.

The 10 country-level bond indices calculated in local currencies all ended the year with positive total returns.  The three outperforming countries within the S&P Pan Asia Bond Index were Indonesia, India, and the Philippines.  The S&P Indonesia Bond Index increased 13.71% in 2016, while its yield-to-maturity tightened 16 bps to 7.87%, making Indonesia the best-performing country in Pan Asia for the year.  The S&P BSE India Bond Index gained 13.22% YTD, and its yield-to-maturity widened 38 bps to 6.94%.  The S&P Philippines Bond Index added 3.82% YTD, while its yield-to-maturity tightened 7 bps to 4.28%—a strong rally that flipped this market from among the three worst-performing countries in 2015 to one of the three top performers in 2016.

The S&P China Bond Index was up 2.06% in 2016, lagging other countries and its own 2015 return of 8.05%.  Nevertheless, China’s bond market showed sustained growth.  The market value, as tracked by the S&P China Bond Index, increased 38% to RMB 49 trillion in 2016.  Among the sector-level subindices, the S&P China Provincial Bond Index almost tripled its size to RMB 9.5 trillion, while the S&P China Financials Bond Index expanded by 80% in 2016.

20170118a

20170118b

The posts on this blog are opinions, not advice. Please read our Disclaimers.

Passive Investing – Myth or Reality? Part 2

Contributor Image
Koel Ghosh

Former Head of South Asia

S&P Dow Jones Indices

Active management, success always?

As we discussed before, the success of active management is directly related to its outperformance of the benchmark it is comparing itself with.  In order to ensure consistency, active managers are reluctant to deviate from standards that include this comparison.  This leads them into situations where they may have to hold a position that may not necessarily be attractive to them, or there may be excessive movement of positions in the portfolio, resulting in additional costs and turnover.  Hence, a fund manager’s choice and conviction play a part in active strategy.  However, this being an individual choice brings in bias, which may work in certain market conditions and may not in others.

Another aspect to consistency is fund manager continuity.  Market participants get accustomed to a certain level of expertise provided to an active product by an expert fund manager.  However, change being the only constant results in movement of fund manager capabilities.  This may also disrupt the consistency of the investment product in following particular return patterns.

For those looking for a certain return trajectory, passive investing may be the preferred solution.  This also applies to those who are not vigilant on the consistency of fund manager or product continuity, or who are not able to track the market conditions on a day-to-day basis.

Say a market participant who wants to invest in the manufacturing sector can easily buy into a product based on a manufacturing index.  This enables consistent and relatively cheap access to the sector.  Furthermore, there are a wide range of choices beyond sectors.  Factors offer the option to invest in stocks via the factors that may be preferred.  Passive investments offer a host of factors, such as growth, value, dividend, low volatility, momentum, etc.

In this evolving paradigm, with market participants growing more savvy and passive investments offering a host of options, the opportunities this space offers is definitely growing.

A famous quote by Mark Twain stated, “It ain’t what you don’t know that gets you into trouble. It’s what you know for sure that just ain’t so.”  So can we state for sure that active management is superior? Maybe we should give it a bit of thought!

The posts on this blog are opinions, not advice. Please read our Disclaimers.

Capturing the World’s Largest Growth Story: the Emerging Markets Consumer

Contributor Image
Karl Desmond

Senior Product Manager, Strategic Beta

Columbia Threadneedle

3 billion people entering the middle class1 and $30 trillion of annual consumption by 20252 – these are two numbers that summarize the drastic demographic and economic shift currently happening in emerging market countries and what McKinsey & Co. has called, “the biggest growth opportunity in the history of capitalism.2 The Dow Jones Emerging Markets Consumer Titans 30 Index is comprised of 30 of the largest and most liquid emerging market consumer companies that are poised to benefit from these changes.

Consistent Outperformance
The emerging market consumer is not a new theme and since the inception of the Dow Jones Emerging Markets Consumer Titans 30 Index (1/8/2010), these companies have outperformed broader EM indices. Over 3 year rolling return periods (rolled monthly), the Dow Jones Emerging Markets Consumer Titans 30 Index has consistently outperformed both the MSCI EM Index and the S&P Emerging BMI Index under almost all market conditions. As seen in Figure 1:

  • The Dow Jones Emerging Markets Consumer Titans 30 Index has outperformed the MSCI EM Index 94% of the time.
  • The Dow Jones Emerging Markets Consumer Titans 30 Index has outperformed the S&P Emerging BMI Index 85% of the time.

Capture

Is the best yet to come?
The historical performance of the Dow Jones Emerging Markets Consumer Titans 30 Index has been impressive, but the growth of the emerging market consumer is in its infancy. As seen in Figure 2, the emerging markets middle class is estimated to represent 15% of the world’s population in 2030, up from 4% in the year 2000.

Capture

The Takeaway
There is no denying demographics – emerging market populations will continue to grow rapidly and the emerging market consumers will continue to increase their wealth. However, broad emerging market benchmarks do not target this exposure, as the consumer sectors make up less than 20% of those benchmarks.

By specifically targeting consumer-oriented companies in emerging markets, the Dow Jones Emerging Markets Consumer Titans 30 Index has generally been able to outperform broad market indices since its inception. More importantly however, this index taps into the future growth of the emerging market middle class, which looks brighter than ever.

For more information on this topic, watch the replay of S&P Dow Jones Indices’ webinar, “Painting Emerging Markets with a Narrower Brush.”

1Ernst & Young, “Innovating for the next three billion”, 2011

2 McKinsey, August 2012, “Winning the $30 trillion Decathlon”

The posts on this blog are opinions, not advice. It is not possible to invest directly in an index.

The posts on this blog are opinions, not advice. Please read our Disclaimers.

Minimizing the Pain of Regret

Contributor Image
Philip Murphy

Former Managing Director, Global Head of Index Governance

S&P Dow Jones Indices

There are many extraordinarily talented minds engineering optimal portfolios, objectives of which include maximizing return per unit of risk, among others.  The capital asset pricing model (CAPM) posited the market portfolio as optimal in the mean/variance sense, but over the years, this notion has been questioned.  CAPM, like the efficient markets hypothesis (EMH), will likely be deliberated for a long time to come.

A more intuitive approach to the market portfolio may be easier to digest and lead to improved market participant behavior, and a couple of self-evident, market-related facts can lay the foundation of such an approach.  First, all stocks must be owned by someone, and in the aggregate, all market participants’ shareholdings form the actual market portfolio.  Second, the actual market portfolio must be cap-weighted.  Third, broad cap-weighted equity indices provide a scale model of the actual market portfolio—not perfect in every detail, but close to the real thing—and anyone seeking to closely replicate, on a smaller scale, the actual market portfolio may do so by buying shares in an index fund.

Of course, the CAPM has contributed much to the body of financial knowledge, but market experience seems to collide with theory, because it seems apparent that the market portfolio is not necessarily optimal.  My gut-level explanation is that, because the actual market portfolio is the aggregate of all market participants’ shareholdings, it is also the sum of all investment strategies.  In other words, it is the aggregation of all stocks, factor exposures, styles, sectors, industries, and strategies.  How can it be optimal in any given period, when there will always be segments of it that do better (i.e., are more mean/variance optimal) than others?  This question leads to my hypotheses that 1) the case for indexing does not rely upon CAPM (or EMH for that matter, but that’s a story for another day) and 2) the real case for indexing is that, with appropriate capital management (i.e., not accepting too much or too little market risk), it may minimize the pain of regret.

Since the market is the living aggregation of all strategies, one cannot be long a strategy (a subset of the market) without simultaneously being short another (a different subset of the market).  For example, if you weigh a portfolio of stocks by a fundamental measure like revenue, you’re long revenue production relative to the market but you’re short other measures.  In this case, perhaps you would be short growth, because the largest revenue producers probably are not the fastest growers.  The tricky thing is that it’s hard to observe what you’re actually betting on and shorting when you select strategies, which can lead to regret if subsequent performance turns out to be disadvantageous relative to the market.  Even if you have perfect transparency into the factors you’re betting for and against, you still have the challenge of timing them—which, if you’re wrong, can also lead to the pain of regret.  After all, it is quite easy to get the market return, but it is pretty painful when the active manager or strategy that you have put many hours of research into underperforms.  What could be more regrettable in the investment world than that?

The posts on this blog are opinions, not advice. Please read our Disclaimers.