Get Indexology® Blog updates via email.

In This List

Surging US Dollar

Round Numbers and the Dow

Quality: A Driving Factor of Small-Cap Returns

The Little Engine That Could

Sukuk Market in 2016: Year in Review

Surging US Dollar

Contributor Image
David Blitzer

Former Managing Director and Chairman of the Index Committee

S&P Dow Jones Indices

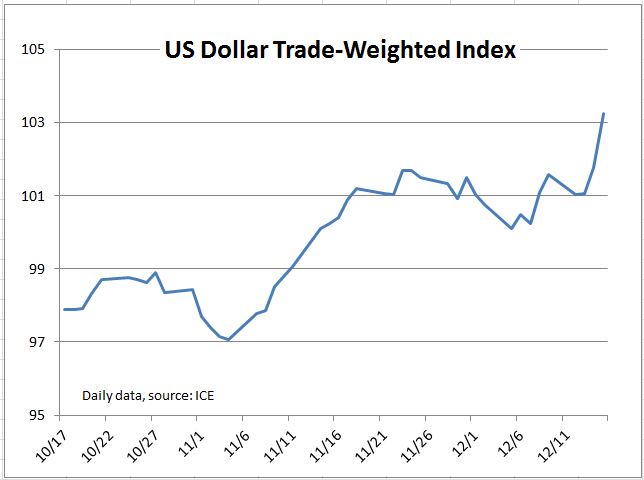
The US dollar continues to advance against most developed market currencies as analysts point to rising US interest rates and expectations of tax cuts and increased federal spending as reasons to expect further gains.

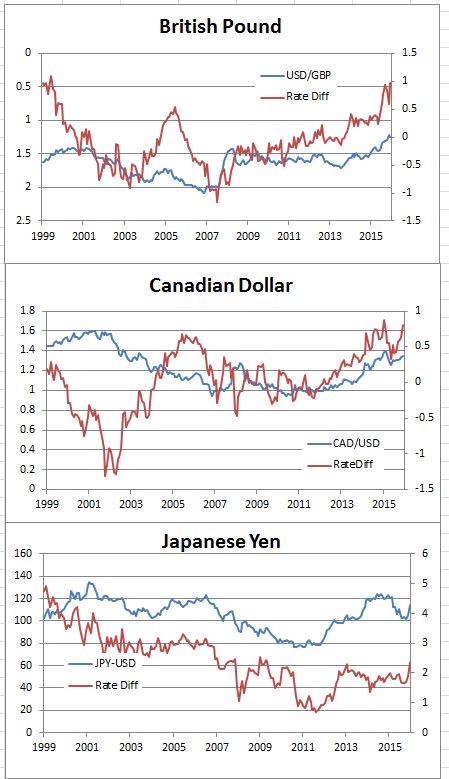
One might expect investors to shift their fixed income investments to markets with higher interest rates. Since rates are currently higher in the US than the UK, Japan or Canada, this might be a reason to expect the US dollar to appreciate against those other currencies. The charts compare the difference between the US ten year treasury yield and the yields on British, Canadian or Japanese rates with the forex value of those currencies against the dollar.  The charts suggest that interest rate spreads do have some relation to foreign exchange rates. However, the linkage is not strong enough to reliably forecast the forex rates and the charts say nothing about causation – which comes first between interest rates and currency (Note that the line for the British pound against the dollar is inverted so that when both lines rise, the correlation is positive.)

three

Interest rate differentials aren’t the only factors affecting forex rates. Macroeconomic policy also matters.  With the elections, it appears that US fiscal policy will ease substantially as spending increases and taxes are cut. The new administration has argued for higher US interest rates and tighter monetary policy – given yesterday’s move by the Fed, that is likely.  The first Reagan administration (1981-85) had tight money, easy fiscal policy and a soaring US dollar.

Forecasting foreign exchange rates is notoriously difficult. There is a long series of academic papers extending back to the 1980s testing forex forecasting models. A random walk model with no economic or financial variables tends to do as well as any of the economic and financial models. One explanation is that forex rates, like most of financial variables, depend on expectations of the future.  Back testing a model with realized expectations often gives great results which vanish when the expectations need to be about the future rather than the past.

Even if we can’t accurately forecast foreign exchange rates, we can think about their impact. Having a strong currency may make people feel good about their country; it isn’t always the most desirable economic policy. A strong dollar is good for consumers: cheaper imports and less expensive foreign travel. However, it can hurt exporters whose customers face higher prices in their own currencies. A company deciding between manufacturing at home or abroad may see the strong dollar as a reason to ship jobs overseas.  However, policies to push the dollar down can also create problems. A collapsing dollar would mean higher import prices importing inflation. Given complexity and difficulty of trying to forecast or manage the foreign exchange rate, the answer maybe to hope for a currency rate that is roughly right and not too volatile.

The posts on this blog are opinions, not advice. Please read our Disclaimers.

Round Numbers and the Dow

Contributor Image
David Blitzer

Former Managing Director and Chairman of the Index Committee

S&P Dow Jones Indices

As the Dow Jones Industrial Average approaches the 20,000 level everyone seems to be suddenly fascinated with the figure. People who rarely ask if the market is up or down want to know if the Dow will cross this supposed benchmark today. Journalists   with years sent covering the markets want to know what 20,000 means.  But, if the Dow had started in 1895 instead of 1896 we would probably have passed 20,000 a year ago.

Before we all get too excited, we might remember what happened after the Dow crossed 10,000 for the first time in April, 1999 – it took two big falls back over the next 10 years. The chart shows the Dow from March 30, 1999 to June 30, 2011 with two nasty bear markets.

Psychological studies suggest that a round number is seen as more stable and solid than a more precise figure.  Saying the Dow closed 9,911.21 yesterday may be sound precise and accurate but certainly doesn’t hint have the positive attributes that people tend to associate with a large round number.  If you ignore the chart 20,000 might make you think the market isn’t about to drop. Round numbers may be used to describe products while more exact numbers slightly below a round number are popular for prices.  Prices of individual stocks tend to cluster near round numbers, probably because most people read numbers left to right and 19.90 sounds a lot cheaper than 20.00.  An investor will buy at 19.90 but hold at 20. Moreover, the scale matters: when markets in Europe switched to the euro from the former local currencies, these round number effects switched from the local currency to the euro.

For investors the level of the Dow or any index depends on an arbitrary base value — what really matters the percentage gain or loss over time.

The posts on this blog are opinions, not advice. Please read our Disclaimers.

Quality: A Driving Factor of Small-Cap Returns

Contributor Image
Aye Soe

Former Managing Director, Global Head of Core and Multi-Asset Product Management

S&P Dow Jones Indices

Much has been written about the performance differential between the two leading small-cap indices, the S&P SmallCap 600® and Russell 2000.  Over a long-term investment horizon, the S&P SmallCap 600 has outperformed the Russell 2000 with less risk.  Part of the performance differential can be attributed to the June Russell rebalancing effect.  As winners from the Russell 2000 graduate to the Russell 1000 and losers from the Russell 1000 move down to the small-cap index, fund managers are forced to sell winners and buy losers, thereby creating a negative momentum portfolio (Furey 2001).

We looked at the average monthly excess returns of the S&P SmallCap 600 over the Russell 2000 from January 1994 through Nov. 30, 2016, and grouped them by calendar months.  Average monthly excess returns for July are higher than any other month, and this is found to be statistically significant (see Exhibit 1).  It should be noted that July is the only calendar month to have a statistically significant t-Stat.

capture

In our recent research study, we showed that the June rebalancing effect only accounts for approximately one-half of the long-term excess returns (A Tale of Two Benchmarks).  Unlike the Russell 2000, the S&P SmallCap 600 requires companies to meet financial viability criteria to be eligible for inclusion.  The financial viability rule requires that the sum of the most recent four consecutive quarters’ as-reported earnings be positive, as well as the as-reported earnings of the most recent quarter.  This profitability measure can be considered as a proxy for quality.  Research has shown that higher-quality companies, on average, outperformed lower-quality companies over a long-term investment horizon.

Below, we show that profitability screening plays a role in driving the returns of the S&P SmallCap 600.  We tested a universe of U.S small-cap stocks[1] with a market cap between USD 200 million and USD 2 billion and divided the securities into two groups.[2]

  • Group 1 consisted of securities for which the sum of the most recent four consecutive quarters’ as-reported earnings and the most recent quarter EPS were positive.
  • Group 2 consisted of securities for which the sum of the most recent four consecutive quarters’ as-reported earnings and the most recent quarter EPS were not positive.

As shown in Exhibit 2, Group 1 outperformed Group 2 as well as the overall small-cap universe with lower volatility, resulting in a higher Sharpe ratio.  The positive information ratio of Group 1 also highlights that small-cap companies with profitability characteristics were able to generate higher excess returns over the benchmark (the small-cap universe in this case) on a consistent basis.  It is also worth noting that these companies had lower beta to the market as well.

capture

Our analysis shows that the profitability or quality factor plays a meaningful role in cross-sectional dispersion of small-cap stocks’ returns.  Companies with strong profitability measures outperformed those without during the back-tested period.  The live performance record of the small-cap indices can attest to the role of the quality factor as a key return driver among small-cap stocks, as the S&P SmallCap 600 has outperformed the Russell 2000 since inception and with lower volatility.[3]

[1]   10.72% versus 8.84% annualized return, 18.37% versus 19.24% annualized volatility, respectively.
[2]   The underlying universe is the S&P Total Market Index.
[3]   The testing period ran from January 1994 through November 2016, with the holding period assumption being 12-month portfolios weighted by market cap.  To avoid survivorship bias, the Compustat Research Inactive database was used to ensure that all currently inactive companies were included in the test universe.

The posts on this blog are opinions, not advice. Please read our Disclaimers.

The Little Engine That Could

Contributor Image
Philip Murphy

Former Managing Director, Global Head of Index Governance

S&P Dow Jones Indices

Since the U.S. presidential election, headlines touting small-cap performance have almost invariably cited the Russell 2000.  As impressive as that index’s return has been, S&P DJI has a little engine that persistently wins the small-cap race—the S&P SmallCap 600®.  Outperformance of the S&P SmallCap 600 versus the Russell 2000 primarily has to do with two factors: 1) the negative Russell reconstitution effect and 2) our little engine does not try pulling too many low-quality stocks up the hill.  It focuses on a manageable trainload of liquid, higher-quality names, staying clear of micro-caps that trade by appointment and other low-quality stocks.  In a future post, my colleague Aye Soe will discuss the quality effect in greater detail.

Like the S&P MidCap 400®, the S&P SmallCap 600 is governed by the same methodology as the S&P 500®.  Liquidity, free float, and financial viability criteria are identical for all three.  The only difference between their respective rules are the market cap guidelines for new entrants.  Currently, candidates for entry into the S&P SmallCap 600 must have a market cap between USD 400 million and USD 1.8 billion.  The Russell 2000 is not nearly as selective, relying on a mechanical market cap ranking to determine index constituency and extending far into micro-cap territory.

The structural differences between the S&P SmallCap 600 and Russell 2000 have resulted in favorable relative performance for the S&P SmallCap 600.  For example, if we look at the returns of the 16 trading days from election day (Nov. 8, 2016) through Nov. 30, 2016, the S&P SmallCap 600 finished ahead of the Russell 2000 by 1.2% (see Exhibit 1).

capture

Of course, 16 days is an insufficient period from which to draw any conclusions.  Still, in the long run, the S&P SmallCap 600 has historically outshined the Russell 2000—as well as most active small-cap managers (see Exhibit 2).

Exhibit 2: Annualized 10-Year Total Returns of Active Small-Cap Blend Mutual Fund Share Classes and Small-Cap Benchmarks

capture

The implications for small-cap market participants are straightforward.  First, indexing small-cap equities works very effectively.  Market participants, advisors, and fiduciaries may want to consider active fees in light of the historical evidence in favor of indexing.  The notion that it only works in more efficient market segments like large caps is a myth.  Second, the index one selects for access to certain investment spaces or for benchmarking active managers important matters (a lot).  Selecting the Russell 2000 historically resulted in: 1) less return per unit of risk than could have been achieved with the S&P SmallCap 600, or 2) a lower hurdle for expensive active managers to gain outsized fees—more often than not for underperformance.  In short, it is advisable to remember the Little Engine That Could when implementing small-cap exposure.

The posts on this blog are opinions, not advice. Please read our Disclaimers.

Sukuk Market in 2016: Year in Review

Contributor Image
Michele Leung

Former Director, Fixed Income Indices

S&P Dow Jones Indices

Global currency sukuk continued to expand in 2016. Increasing issuances were observed in U.S. dollar, Indonesian rupiah, and Pakistani rupee sukuk, though there were decreases in Malaysian ringgit and Bangladesh taka sukuk compared with last year.[1] The U.S. dollar and Malaysian ringgit sukuk continued to dominate the sukuk market.

The Dow Jones Sukuk Index, which seeks to track U.S. dollar-denominated, investment-grade sukuk, added 17 new sukuk with a total par amount of USD 13.5 billion into the index.  Sovereign sukuk continued to dominate the issuance, including USD 2.5 billion from Indonesia, USD 1.5 billion from Malaysia, USD 1 billion from Turkey, and USD 500 million from Oman.  The biggest corporate sukuk issuances were USD 1.5 billion from IDB Trust, USD 1.2 billion from DP World, and USD 1 billion from Emirates Islamic Bank.  Among all the new issuances, 33% was from the United Arab Emirates.

Looking at the overall country issuance in the Dow Jones Sukuk Index in Exhibit 1, Gulf Cooperation Countries (GCC) remained the largest contributor, at 57%.  For the non-GCC countries, the three biggest are Indonesia, at 15%, Malaysia, at 13%, and Turkey, at 10%.

Exhibit 1: Countries of Risk of the Dow Jones Sukuk Index

 20161209a

In terms of total return performance, the Dow Jones Sukuk Index rose 4.00% YTD as of Nov. 30, 2016 (see Exhibit 2).  The Dow Jones Sukuk Higher Quality Investment Grade Select Total Return Index, which seeks to track sukuk from specified countries of risk, gained 3.54% for the period.  The S&P MENA Sukuk Index, which is designed to measure sukuk issued in the Middle East and African market, advanced 3.97% in the same period.

Among the ratings-based subindices, the sukuk rated ‘BBB’ outperformed and rose 4.84% YTD, while the sukuk rated ‘AA’ also went up 4.43% in the same timeframe.  The longer-maturity indices performed better than the shorter-maturity ones, reversing the trend in 2015.  As of Nov.30, 2016, the Dow Jones Sukuk 5-7 Year Total Return Index and the Dow Jones Sukuk 7-10 Year Total Return Index gained 6.22% and 5.71% YTD, respectively.

Exhibit 2: Total Return Performance of the Dow Jones Sukuk Index Series

20161209b

[1] Source: Thomson Reuters Eikon. Data as of Nov 8, 2016.

The posts on this blog are opinions, not advice. Please read our Disclaimers.