Get Indexology® Blog updates via email.

In This List

What Is Your Retirement Number?

How to Get into (Index) Heaven

Asian Fixed Income: Chinese Bond Market Was Slow in 2016

This Is How Much Commodity Money Might Move in 2017

What Is ESG Investing?

What Is Your Retirement Number?

Contributor Image
Philip Murphy

Former Managing Director, Global Head of Index Governance

S&P Dow Jones Indices

Wealth drawdowns and volatility of returns are not the only risks facing defined contribution (DC) retirement plan participants.  Those relying primarily on 401(k)s and other DC plans for retirement income also need to address longevity, inflation, and variability in the price of income.  Furthermore, many traditional guidelines for withdrawal policies are simply insufficient for real-life application.  We hear a lot of debate around withdrawal rates expressed as a starting percentage of capital that is adjusted up each year for inflation—should the initial rate be 3%, 4%, or even 5%?  Such rules are naïve in that they fail to take into account the changing price of income, and they tend to be backward looking.  They are also usually accompanied by statements of probability—e.g., there is a 95% chance you will not run out of money, etc.

Can investors relate to statistical confidence levels?  If you tell someone that she has a 95% chance of not running out of money, this may sound pretty good.  However, if you tell that person that if she had 100 lives, you would expect her to run out of money in five of them, so things may not look so good.  The results in those five trials are too catastrophic for comfort.

Retired investors generally seek to retain control over their capital, and they need sensible strategies for funding consumption throughout their lives.  Sustainable systematic withdrawal policies must regularly take asset value and the price of income into account.  M. Barton Waring and Laurence B. Siegel do a great job of explaining this in a 2015 Financial Analysts Journal article titled “The Only Spending Rule Article You Will Ever Need.”

How variable is the affordability of income?  In conjunction with the S&P STRIDE index series, S&P DJI seeks to calculate the cost of inflation-adjusted income starting at specific points in time.  Exhibit 1 shows the U.S. dollar price of inflation-adjusted income starting in January 2030 and lasting 25 years.  It illustrates how many U.S. dollars would be required at the end of each year from 2005 to 2015 to lock in USD 1 of real income per year starting in 2030.  The table also shows annual total returns of the S&P 500, as well as the wealth and income performance of a hypothetical investment in the S&P 500.

We begin with USD 500,000 invested in the S&P 500 at the end of 2005.  At that time, 2030 income cost USD 12.35 per future real U.S. dollar, so I could have spent my USD 500,000 to lock in USD 40,490 per year (starting in 2030).  However, I thought I could eventually end up with more future income by investing in the stock market.  After one year, my wealth had grown to USD 578,950, and the price of 2030 income dropped from USD 12.35 to USD 11.03.  I could have sold my stocks to lock in USD 52,490 of future income, but I stayed invested.  I did this every year; by 2015, my wealth grew to USD 1,011,874, and the income I could afford to lock in grew to USD 56,154.

However, there are some striking observations buried within the table.  First, during the entire period, my account value grew at an annual rate of 7.3%, but my future income grew at an annual rate of only 3.3%.  Next, as recently as 2012 and in spite of the fact that my wealth had grown to USD 663,127, I would have been better off locking in future income in 2005, when I could have acquired USD 40,490 per year rather than only USD 29,702!

Changes in wealth do not proportionally translate into changes in future income.  For retirement savers, keeping an eye on expected future income may be just as important as account balances—if not more so.  Since no one knows the future sequence of investment returns or income cost, the wisest policy may be to lock in future income a little bit at a time.

table-1

The posts on this blog are opinions, not advice. Please read our Disclaimers.

How to Get into (Index) Heaven

Contributor Image
Reid Steadman

Former Managing Director, Global Head of ESG & Innovation

S&P Dow Jones Indices

A poll conducted in 2014 revealed that 74% of Americans believe in heaven, which was defined for respondents as a place “where people who have led good lives are eternally rewarded.” The index world has a heaven too, where companies aspire to be and good deeds are recognized. It’s called the Dow Jones Sustainability Index.

When companies make it into the Dow Jones Sustainability Index – an index series that incorporates environmental, social, and governance (ESG) factors into its inclusion criteria and weighting schemes – they are justifiably proud. But how does a company get into paradise? It’s not easy. Regular confession and a real desire to change are required.

The measurement tool for whether a company is “good” and heaven bound is a survey. Our partner, RobecoSAM, every year issues the Corporate Sustainability Assessment, which covers varied topics such as executive pay, gender equality, and corporate citizenship. The effort dedicated to this survey is simply incredible. In 2015, 2,126 companies were assessed, either by themselves or by RobecoSAM; 2,145,567 data points were collected and analyzed; and, on average, 150 hours were spent on each assessment.

What is the Goal?
The aim of the survey is to determine:

  1. Is a given company aware of sustainability issues?
  2. Does the company have a strategy to address them?
  3. Is the company making progress and reporting its results?

These are basic objectives but it takes a lot of work to figure out where a company stands in achieving them.

A Peek Inside the Survey
Because different factors matter in different industries, the survey varies by industry group. It’s still worthwhile, though, to glance through one survey to get a feel for what companies are reporting and RobecoSAM is measuring. Here is a link to a sample survey for the Metals & Mining industry. If you will read some of the questions, you will notice how RobecoSAM draws out information that allows it to achieve its three aims listed above.

The questions on human rights highlight this really well. Section 3.2.5 asks if the company is aware of and committed to human rights:

Does your company have a policy in place for its commitments to respect human rights in accordance with the UN Guiding Principles on Business and Human Rights? Please provide supporting evidence.

The next section, 3.2.6, asks if the company has a human rights strategy:

Has your company developed and implemented a due diligence process to identify, prevent, mitigate, and account for how to address its impacts on human rights? The process should enable the remediation of any adverse human rights impacts a company causes or contributes to. Please provide supporting evidence.

And, finally, 3.2.7 determines whether the company is measuring and is reporting its progress:

Has your company conducted an assessment of potential human rights issues across your business activities in the past three years?

The Reward
Whether altruism exists among people is debatable, but this we know about corporations: when they dedicate their scarce resources to something, it’s because they want a return. Getting into index heaven, the Dow Jones Sustainability Index, is one potential reward, but an even more tangible payout is investment from the growing number of institutions that care about ESG factors.


The posts on this blog are opinions, not advice. Please read our Disclaimers.

Asian Fixed Income: Chinese Bond Market Was Slow in 2016

Contributor Image
Michele Leung

Former Director, Fixed Income Indices

S&P Dow Jones Indices

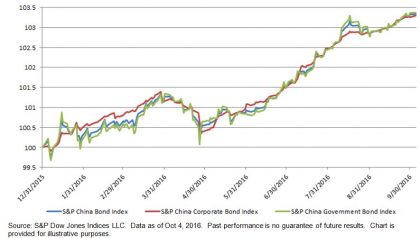
The performance of China’s fixed income market has lagged other Asian countries this year.  According to the S&P China Bond Index, the fixed income market delivered a YTD total return of 3.57% as of Oct. 11, 2016.  China was one of the top three outperforming countries in the S&P Pan Asia Bond Index last year; the other two countries measured by the index, Indonesia and India, increased 17% and 9% YTD, respectively.  Despite China opening up its bond market to offshore market participants, the country still underperformed, and in February there was a short rally following the Chinese Interbank Bond Market (CIMB) announcement, yet the gain was reversed in April.

The size of China’s bond market has continued to expand nevertheless.  The market value tracked by the index reached CNY 48 trillion, whereas corporate bonds represented 34% of the overall market.

The yield of Chinese bonds trended lower, aligning with the global market.  The yield-to-worst of the S&P China Bond Index tightened 17 bps to 2.93% YTD.  The yields of the government and corporate bonds were 2.73% and 3.34% respectively.  Among all the sector-level subindices, the S&P China Industrials Bond Index had the highest yield, at 3.56%.

The S&P China Bond Index is designed to track the performance of local-currency-denominated bonds from China.  S&P Dow Jones Indices has launched both broad-based and investible indices of the S&P China Bond Index Series.

Exhibit 1: Total Return Performance of the S&P China Bond Index, S&P China Government Bond Index, and the S&P China Corporate Bond Index

20161012

The posts on this blog are opinions, not advice. Please read our Disclaimers.

This Is How Much Commodity Money Might Move in 2017

Contributor Image
Jodie Gunzberg

Former Managing Director, Head of U.S. Equities

S&P Dow Jones Indices

Rebalancing season is underway again for the S&P GSCI. Last week, the index committee announced the proforma results for the 2017 weights in the S&P GSCI. While it is possible the target weights may change before the official press release, the proforma results are now listed on our website.

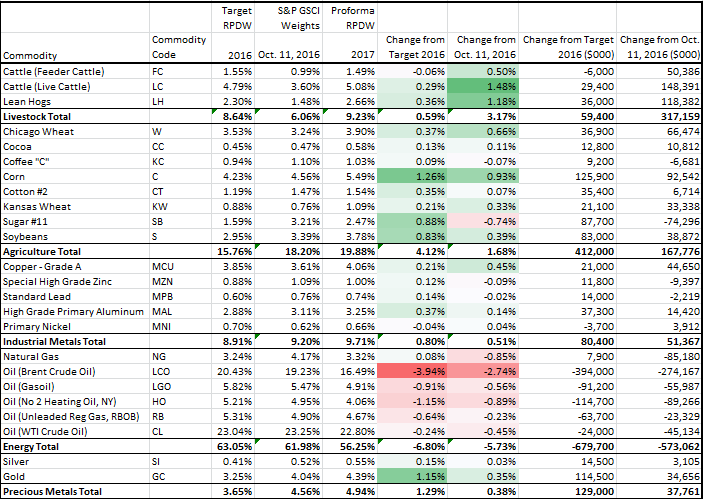
One way to look at the results is simply by the weight (Reference Percentage Dollar Weight found on page 11 of the methodology) but most traders want to know how much money is moving as a result of the rebalance to the new target weights.  Given the weights today, Oct.11, 2016 will change by the year’s end, and that the weights announced are still proforma, the numbers calculated here are still approximate.  The example shows the percentage weight changes and how many dollars are estimated to move for every $10 billion.  The biggest shift is out of brent crude and into live cattle with an estimated $275 million out of brent and $150 million into live cattle for every $10 billion tracking the index.  The energy sector is slated for the biggest outflow of over $570 million and livestock is set for the biggest inflow of near $320 million per $10 billion tracking the S&P GSCI.  The (WTI) crude oil in the index is positioned to remain as the biggest commodity with a proforma 2017 target weight of 22.8%.

Source: S&P Dow Jones Indices

For information on total AUM tracking commodity indices, please view our replay of the S&P Dow Jones 10th Annual Commodities Seminar and specifically watch Keynote Address: Where in Commodities is the Smart Money Flowing?

The posts on this blog are opinions, not advice. Please read our Disclaimers.

What Is ESG Investing?

Contributor Image
Emily Ulrich

Former Senior Product Manager, ESG Indices

S&P Dow Jones Indices

Sustainability investing is one of the fastest-growing segments of the asset management industry.  It is also one of its most complex.  This posts aims to provide some clarity on this increasingly relevant topic.

Sustainable investing means looking at “extra-financial” variables, i.e., environmental, social, and governance (ESG) factors (together or separately) when making investment decisions.  Such investing may take various forms, from ethical exclusions to comprehensive ESG integration, on the basis of which portfolios may be constructed as best-in-class selection (to maximize extra-financial benefits) or by simply avoiding what may be perceived as unacceptable companies or industries (to either minimize extra-financial detractions or to promote bottom-up ESG change).  ESG is a comprehensive field that comprises many dynamics such as carbon emissions, environmental impact, corporate citizenship, and human capital development.

In the industry lexicon, ESG is often distinguished from carbon (also referred to as “green”).  Of course low carbon is, in itself, an important component of the environmental dimension of ESG, but it also stands alone in significance due to the global threat of climate change, which is why S&P DJI typically splits sustainability into two categories: ESG and green/low carbon.  For our purposes, the environmental dimension of the ESG framework tends to capture more factors, while green tends to focus on a few factors that are considered key in the threat of global climate change.  Figure 1 further outlines the distinctions between the three dimensions.

capture

The environmental component encompasses waste management, water management, and use of other environmental resources.  Social includes stakeholder analysis—customers, employees, and all those affected by the presence of the entity-like people living in the vicinity of an industrial unit.  Governance focuses on stakeholder impact as it specifically relates to shareholders and management while also addressing board structure, management compensation, and shareholder rights.  These three factors have combined in different ways to shape distinct periods in the history of the sustainability movement (particularly as it relates to finance).

The posts on this blog are opinions, not advice. Please read our Disclaimers.