Get Indexology® Blog updates via email.

In This List

Eurozone Corporates Gets an ECB Kickstart

Safe Spread Alternative: The S&P 500® Corporate Bond Index

Rieger Report: Puerto Rico - Muni Bond Wealth Destroyer

Asian Fixed Income: Chinese Corporates’ Spread Widened With Headline Risk

The Canadian Corporate Comeback

Eurozone Corporates Gets an ECB Kickstart

Contributor Image
Kevin Horan

Former Director, Fixed Income Indices

S&P Dow Jones Indices

The impact of the ECB announcement on March 10, 2016, continues to play out in the bond markets.  The governing council decided to establish a new program (the Corporate Sector Purchase Program, or CSPP), which will purchase investment-grade, euro-denominated bonds issued by non-bank corporations established in the eurozone.  The goal of the action is to further stimulate the economy.  The CSPP will be added to the existing Asset Purchase Program and will be included in the combined monthly purchases, which are to start toward the end of the second quarter of 2016.

Needless to say, this additional program has made an impact: eurozone corporate bonds, as measured by the S&P Eurozone Investment Grade Corporate Bond Index, have returned 0.39% for the month and 2.84% YTD as of May 12, 2016.  The S&P Eurozone Quasi & Foreign Government Bond Index has returned 0.59% for the month and 2.26% YTD, while the S&P Eurozone Sovereign Bond Index has returned 0.71% for the month and 2.73% YTD as of the same date.

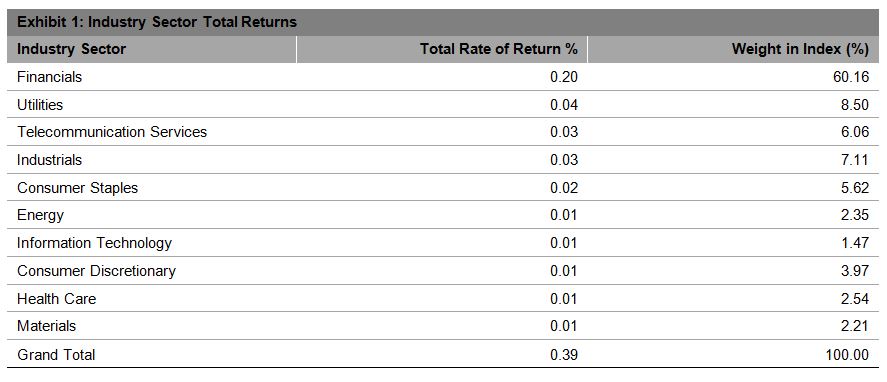
The best-performing sector by far for the month has been financials, which makes up 60% of the index and has returned 0.20% as of the same date, though 31% are banks that do not participate in the CSPP.

Source: S&P Dow Jones Indices LLC. Data as of May 11, 2016. Past performance is no guarantee of future results. Table is provided for illustrative purposes.

Spreads of the S&P Eurozone Investment Grade Corporate Bond Index by rating category show that since mid-February 2016, the Option Adjusted Spreads (OAS) are significantly tighter for the AA, A, and BBB categories.  The BBB category has seen the most movement, tightening by 48 bps between Feb. 15, 2016, and May 11, 2016.

Exhibit-2: Eurozone Investment-Grade Corporate Bond OAS by Rating Category

Source: S&P Dow Jones Indices LLC. Data as of May 11, 2016. Past performance is no guarantee of future results. Chart is provided for illustrative purposes.


The posts on this blog are opinions, not advice. Please read our Disclaimers.

Safe Spread Alternative: The S&P 500® Corporate Bond Index

Contributor Image
Dennis Badlyans

Former Associate Director, Global Research & Design

S&P Dow Jones Indices

  • The May 2016 IIF Portfolio Allocation Trends report confirms the generally defensive tone among market participants, with investors balancing between higher quality and higher yield.
  • The S&P 500 Corporate Bond Index is the corporate bond counterpart to the market bellwether, the S&P 500 equity index.
  • With an average option-adjusted spread (OAS) of approximately 425 bps, the S&P 500 High Yield Corporate Bond Index presents a unique credit alternative, bridging the gap between investment grade (approximately 150 bps) and traditional high yield (approximately 650 bps).

Directional Uncertainty Driving Decisions

Portfolio flow data reveals that market participants have generally been favoring fixed income over equity, favoring emerging markets over developed markets, and favoring emerging market high grade over emerging market high yield.  Since the strong rally starting in mid-February 2016, appetite for risky assets appears to have increased, but market participants have been differentiating more on quality.  This demand pattern may be a reflection of a defensive tone of market participants who want exposure to higher yields but lack conviction in directionality of the market in the coming months.

One way for market participants to express this is to incorporate exposure to the S&P 500 High Yield Corporate Bond Index which can enhance yields with quality in mind.

The S&P 500 Corporate Bond Index is designed to measure the performance of the debt issued by the companies that constitute the S&P 500.  The index tracks both investment-grade and high-yield issuers.  Generally speaking, the constituents are of higher quality than those of traditional corporate indices such as the S&P U.S. Investment Grade Corporate Bond Index and the S&P U.S. High Yield Corporate Bond Index.

The S&P 500 High Yield Corporate Bond Index presents a unique credit alternative to bridge the gap between existing investment grade, which offers spread levels of around 150 bps, and high-yield corporate credit, which offers north of 600 bps in spread.  Returns on the S&P 500 High Yield Corporate Bond Index have a high correlation to the S&P U.S. High Yield Corporate Bond Index as well as other peer indices while the constituents of the index have had a lower instance of default historically.

Capture

Recent Performance

The weighted average of OAS of the S&P 500 High Yield Corporate Bond Index is 438 bps, which sits roughly halfway between traditional investment-grade indices, with OAS of 134 bps, and the traditional, broad high-yield corporate index, with OAS of 636 bps.  Since the peak levels seen on Feb. 11, 2016, U.S. dollar credit spreads have tightened dramatically, with the high yield indices registering returns of over 10% since.

Capture

The posts on this blog are opinions, not advice. Please read our Disclaimers.

Rieger Report: Puerto Rico - Muni Bond Wealth Destroyer

Contributor Image
J.R. Rieger

Former Head of Fixed Income Indices

S&P Dow Jones Indices

There is gap between the par amount and market value of Puerto Rico municipal bonds that has now broached over $40billion.  While some of this can be accounted for as zero coupon debt, the fall in market value of the S&P Municipal Bond Puerto Rico Index is a startling reminder that credit and political risk can sting investors.

Year-to-date, Puerto Rico General Obligation bonds have returned a negative 4.07%.  Meanwhile, high yield municipal bonds excluding Puerto Rico have been resilient.  The S&P Municipal Bond High Yield ex-Puerto Rico Index has seen a total return (YTD) of 4.3%.

Chart 1:  Total Par & Market Values of Bonds in the S&P Municipal Bond Index:

Source: S&P Dow Jones Indices, LLC. Data as of May 4th 2016. Chart is provided for illustrative purposes and reflects hypothetical historical performance. It is not possible to invest directly in an index. Past performance is no guarantee of future results.
Source: S&P Dow Jones Indices, LLC. Data as of May 6th 2016. Chart is provided for illustrative purposes and reflects hypothetical historical performance. It is not possible to invest directly in an index. Past performance is no guarantee of future results.

Table 1: Yields (Yield to Worst) and Year to Date Returns of Select Municipal Bond Indices:

Source: S&P Dow Jones Indices, LLC. Data as of May 4th 2016. Chart is provided for illustrative purposes and reflects hypothetical historical performance. It is not possible to invest directly in an index. Past performance is no guarantee of future results.
Source: S&P Dow Jones Indices, LLC. Data as of May 6th 2016. Chart is provided for illustrative purposes and reflects hypothetical historical performance. It is not possible to invest directly in an index. Past performance is no guarantee of future results.


The posts on this blog are opinions, not advice. Please read our Disclaimers.

Asian Fixed Income: Chinese Corporates’ Spread Widened With Headline Risk

Contributor Image
Michele Leung

Former Director, Fixed Income Indices

S&P Dow Jones Indices

According to the S&P China Corporate Bond Index, the market value of Chinese corporate bonds was approximately CNY 26.4 trillion and represented 36% of the overall China bond market as of May 5, 2016.  It is a robust expansion compared with the mere 6.7% exposure in 2007 (see Exhibit 1).

The yield-to-maturity of the S&P China Corporate Bond Index came down 170 bps to 3.66% in 2015. This spread tightening in 2015 was largely due to improved liquidity, particularly with the correction in A-shares in the first half of 2015.

However, this trend is reversing as fundamentals start to weigh in.  Defaults and concern about the deteriorating credit quality of Chinese corporates captured plenty of global headline news.  Investors raised concern about state-owned-enterprises, particularly those in the industries affected by overcapacity, as government support can no longer be assumed. The yield-to-maturity of the S&P China Corporate Bond Index widened 18bps to 3.84% year-to-date, while its total return climbed 0.49% in the same period.

Across sector-level indices, industrials took the biggest hit with recent defaults in the steel, mining, and cement sectors.  The option-adjusted spread of the S&P China Industrials Bond Index was the highest; it widened 50 bps to 155 bps over the three-month period ending May, 2016 (see Exhibit 2).

Exhibit 1: Market Value of the S&P China Corporate Bond Index and the S&P China Government Bond Index

20160509a

Exhibit 2: Option Adjusted Spread of the S&P China Corporate Bond Index and its Subindices

20160509b

The posts on this blog are opinions, not advice. Please read our Disclaimers.

The Canadian Corporate Comeback

Contributor Image
Kevin Horan

Former Director, Fixed Income Indices

S&P Dow Jones Indices

Yields of Canadian corporate investment-grade and high-yield bonds have been trending lower (up in price) since the beginning of March 2016.  Year-to-date, the S&P Canada Investment Grade Corporate Bond Index returned 1.59% while the S&P Canada High Yield Corporate Bond Index returned 4.54% as of April 30, 2016.

The beginning of April saw yield increase by 9 bps for investment grades and 58 bps for high yield from April 7-19, 2016, as measured by the S&P Canada Investment Grade Corporate Bond Index and the S&P Canada High Yield Corporate Bond Index.  In spite of the one-week increase in yields, the indices rallied after April 19, 2016, going into the end of the month.  Investment-grade bonds moved tighter by only 4 bps, but high yield stepped it up by tightening 32 bps.  In the end, the April index returns were 0.55% for investment grade and 2.16% for high yield.

The performance by industry sectors shows that all sectors had positive returns for the month.  Energy, which is a significant weight in both investment grade (7.7%) and high yield (25.7%), has recently been a notable contributor after past months of negative headlines.  Up until April 25, 2016, investment-grade financials had returned -0.06% for the month, but performance during the last week of the month pushed the large sector (63.8%) up for a return of 0.14% in April.  High-yield consumer discretionary, which accounts for 48.6% of the index, and returned 0.80% for April; this sector contains issuers such as Golf Town Canada, Mattamy Group, Quebecor Media, Brookfield, and AutoCanada, Inc.

Source: S&P Dow Jones Indices LLC. Data as of April 30, 2016. Past performance is no guarantee of future results. Table is provided for illustrative purposes.


Source: S&P Dow Jones Indices LLC. Data as of April 30, 2016. Past performance is no guarantee of future results. Chart is provided for illustrative purposes.


The posts on this blog are opinions, not advice. Please read our Disclaimers.