Get Indexology® Blog updates via email.

In This List

Watch Your Weight: How a Few Stocks Can Tilt the Scales

Rieger Report: Quietly higher- Municipal bonds continue to shine

Rieger Report: Oil State Municipal Bonds - Risk or Opportunity

Rieger Report: Dogs of the Bond Market - Energy and Puerto Rico G.O.s

Making the Patient Sicker

Watch Your Weight: How a Few Stocks Can Tilt the Scales

Contributor Image
Anthony Davidow

Vice President, Alternative Beta and Asset Allocation Strategist

Schwab Center for Financial Research

Not all indexes are created equal. That’s because they weight the individual holdings differently. Market-cap indexes provide the largest weighting to the largest holdings regardless of fundamental characteristics, whereas fundamental indexes break the link between price and weight. With the proliferation of smart beta strategies, investors have more access and choice to select alternative weighting methodologies than ever before.

Why does weighting matter?
In 2015, the domestic equity markets were dominated by the FANG stocks – Facebook, Amazon, Netflix and Google (which later changed its name to Alphabet). They dominated the returns and the headlines. In fact, these four stocks became the darlings of Wall Street, rising in price without any apparent regard for valuation. Netflix and Amazon were the top two performing stocks in 2015. The chart below helps illustrate the differences in a market-cap index and a fundamental index.

2015 Year-end Index Comparison

S&P 500 Rank Fundamental  Rank 2015 Return P/E Dividend
Facebook 10 332 34.15% 105.67
Amazon 6 116 117.78% 975.20
Netflix 86 134.38% 305.57
Google (Alphabet) 11 70 46.60% 35.90

Source: Morningstar Direct, as of 12.31.2015

As the data shows, these four momentum stocks were some of the largest names in the S&P 500 index (the 10th, 6th, 86th & 11th largest holding), but had much smaller representation in the Russell Fundamental index (332nd, 116th, & 70th largest holding). Netflix was not a holding in the Russell Fundamental index. The differences are due to their weighting methodologies. Since all four companies have large market-capitalization, they have significant weighting in the S&P 500 where the only metric that matters is size. However, since the Russell Fundamental index weights securities based on adjusted sales, cash flow and dividends + buy-backs – these companies represent a much smaller weight.

The Price / Earnings ratio (P/E) is one of the most common measures of valuation. The FANG stocks had inflated P/E’s at year end (106, 975, 306 & 36 respectively). The overall market had a roughly 19 P/E which is at the higher end of the normal range. The P/E’s of these four stocks are extraordinarily high and pay no dividends. It harkens back to the “dot.com” bubble where companies traded at unrealistic P/E’s – and valuations didn’t seem to matter.

In today’s volatile market environment, do you want to overweight a high P/E stock that has already experienced a significant run-up, or would you rather overweight a stock with attractive fundamental characteristics? Fundamental index strategies systematically identify and weight securities based their financial health – not their popularity.

At Charles Schwab, we believe that market-cap and fundamental indexing can complement one another. Over the long-run, fundamental indexing has historically delivered alpha (excess returns), but lagged for much of 2015. We believe that the tide is turning, and fundamental indexing may outperform their market-cap equivalent in the coming year based on their more realistic valuations. In today’s market environment – we believe that fundamentals matter.

Important  Disclosures and Definitions  

S&P 500 Index – The index includes 500 leading companies and captures approximately 80% coverage of available market capitalization.  The S&P focuses on the large-cap sector of the market: however, since it includes a significant portion of the total value of the market, it also represents the market.  There is over USD 5.14 trillion benchmarked to the index, with index assets comprising approximately USD 1.6 trillion of this total.

The information here is for general informational purposes only and should not be considered an individualized recommendation or personalized investment advice. The type of investment strategies mentioned may not be suitable for everyone. Each investor needs to review a security transaction for his or her own particular situation. All expressions of opinion are subject to change without notice in reaction to shifting market conditions. Data here is obtained from what are considered reliable sources; however, its accuracy, completeness, or reliability cannot be guaranteed.

Total Returns are from January 1, 2015 through December 31, 2015 and do not include fees or expenses.  Past Performance does not guarantee future results. 

“Fundamental Index” is a registered trademark of Research Affiliates, LLC. Russell Investments and Research Affiliates, LLC have entered into a strategic alliance with respect to the Russell Fundamental Index Series. Subject to Research Affiliates’ intellectual property rights in certain content, Russell Investments is the owner of all copyrights related to the Russell Fundamental Index Series. Russell Investments and Research Affiliates jointly own all trademark and service mark rights in and to the Russell Fundamental Indexes.

Diversification strategies do not ensure a profit and do not protect against losses in declining markets.

Charles Schwab & Co., Inc. is not affiliated with Russell Investments or Research Affiliates. The Schwab Center for Financial Research is a division of Charles Schwab & Co., Inc  (0216-0714)

The posts on this blog are opinions, not advice. Please read our Disclaimers.

Rieger Report: Quietly higher- Municipal bonds continue to shine

Contributor Image
J.R. Rieger

Former Head of Fixed Income Indices

S&P Dow Jones Indices

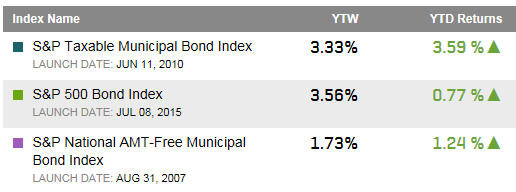
A detailed Wall Street Journal article today Markets in 2016: The Year of the Pig clearly shows that many asset classes are continuing to show volatility and negative returns however municipal bonds have been resilient. Tax-exempt investment grade municipal bonds tracked in the S&P National AMT-Free Municipal Bond Index up 1.24% year-to-date and high yield municipal bonds tracked in the S&P Municipal Bond High Yield Index up 1.13%.

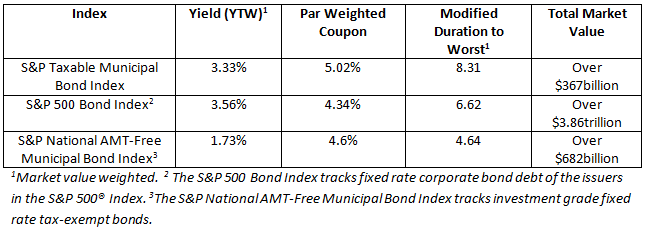
Taxable municipal bonds however have jumped ahead as the S&P Taxable Municipal Bond Index has returned 3.59% year-to-date.  Relative to corporate bonds this segment of the municipal bond market has longer durations and higher coupons which both contribute to positive price movement as rates move down.

Table 1: Select bond indices, their yields and returns

Source: S&P Dow Jones Indices, LLC. Data as of February 23, 2016.

Table 2: Select bond indices and key characteristics

Source: S&P Dow Jones Indices, LLC. Data as of February 23, 2016.

The posts on this blog are opinions, not advice. Please read our Disclaimers.

Rieger Report: Oil State Municipal Bonds - Risk or Opportunity

Contributor Image
J.R. Rieger

Former Head of Fixed Income Indices

S&P Dow Jones Indices

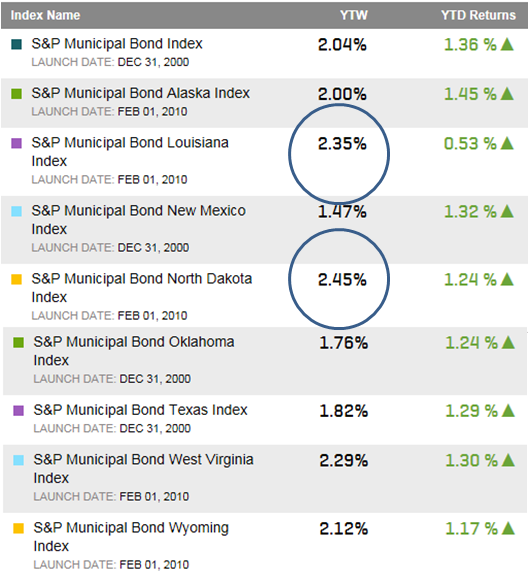
Local and state municipal bonds issued within states dependent on oil production are potentially in a cycle where they could underperform the overall bond market. So far, modestly higher yields can be seen in Louisiana and North Dakota and only Louisiana has underperformed to any significant degree year-to-date.  Supply and demand of the bonds themselves plays an important role here as some states do not issue bonds in large volumes or have state supported debt.

Table 1:  Select municipal bond indices, their yields and year-to-date returns

Source: S&P Dow Jones Indices.  Data as of February 22, 2016.
Source: S&P Dow Jones Indices. Data as of February 22, 2016.


The posts on this blog are opinions, not advice. Please read our Disclaimers.

Rieger Report: Dogs of the Bond Market - Energy and Puerto Rico G.O.s

Contributor Image
J.R. Rieger

Former Head of Fixed Income Indices

S&P Dow Jones Indices

Energy and Puerto Rico remain the sectors to watch as they continue to be drags on the bond markets.

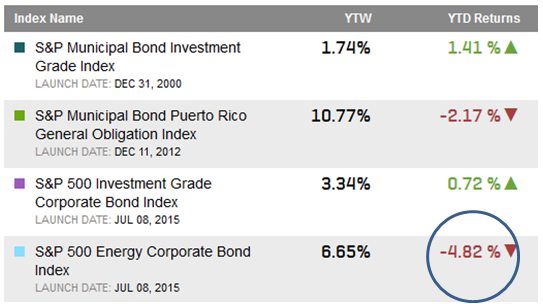
Energy making this sector the lead ‘dog’ in performance so far in 2016. The S&P 500 Energy Corporate Bond Index is down over 4.8% year-to-date causing significant damage to the corporate bond markets as the index tracks over $289billion in par amount of bonds.

Table 1: Select bond indices, their yields and returns (YTD)

Source: S&P Dow Jones Indices LLC. Data as of February 19, 2016.

Puerto Rico municipal bonds have enjoyed a positive bounce in 2016 however the general obligation bonds are still a small anchor on performance of the high yield municipal bond market as the S&P Municipal Bond Puerto Rico General Obligation Index is down over 2% year-to-date.  This segment is a small anchor as the index tracks just over $11billion in par amount of general obligation bonds.

The posts on this blog are opinions, not advice. Please read our Disclaimers.
Making the Patient Sicker

Contributor Image
Craig Lazzara

Former Managing Director, Index Investment Strategy

S&P Dow Jones Indices

Years ago, I saw a cartoon picturing two Victorian-era doctors discussing a patient.  “What did you prescribe for Jones’ rheumatism?” asked the first; the second answered “A cold bath and a brisk walk every morning.”  “Good God, man, that will give him pneumonia!” said the first.  “I know,” replied the second doctor, “I made my reputation curing that.”

Somehow I was reminded of this exchange when I learned from this morning’s news that some institutional investors, smarting from recent losses, are considering increasing their commitment to active equity management.  Their operating assumption seems to be that active managers will do a better job of capital preservation in a challenging and volatile market.

There’s certainly some plausibility to this argument.  It turns out, however, to be another beautiful theory mugged by a gang of facts.  The facts come from our periodic SPIVA reports, which compare the results of actively-managed mutual funds against passive benchmarks.  Weak markets, it turns out, are no panacea for active managers.  In 2008, e.g., 54% of large-cap U.S. funds underperformed the S&P 500.  Results were even worse for mid- and small-cap managers (75% and 84% underperformers, respectively).

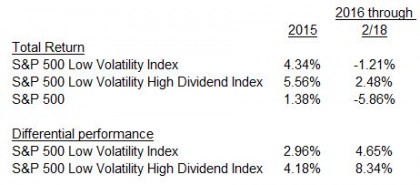
Statistics say, in other words, that moving from passive to active as a way of managing market volatility is likely to make performance worse, not better.  Fortunately for anxious investors, passive strategies which focus on the lowest volatility segment of the equity market are most likely to outperform precisely when the market is weakest.  Consider, for example, the S&P 500 Low Volatility Index and its cousin, the S&P 500 Low Volatility High Dividend Index:

LV and baby LV to 021816

Both of these indices are designed to attenuate the returns of the S&P 500 in both directions; historically they have both tended to underperform market rallies but outperform when markets are weak.  Their reliability as defensive vehicles has far exceeded that of active management.  Investors concerned about continuing volatility and market weakness should consider indicizing their defensive strategies.


The posts on this blog are opinions, not advice. Please read our Disclaimers.