Get Indexology® Blog updates via email.

In This List

Volatility Rides Again

Is Oil’s Spill Turning the Credit Cycle?

Better Than the Headline

Risk Off, Yields Move Lower

Credit Spread and Low Volatility Factors

Volatility Rides Again

Contributor Image
Chris Bennett

Former Director, Index Investment Strategy

S&P Dow Jones Indices

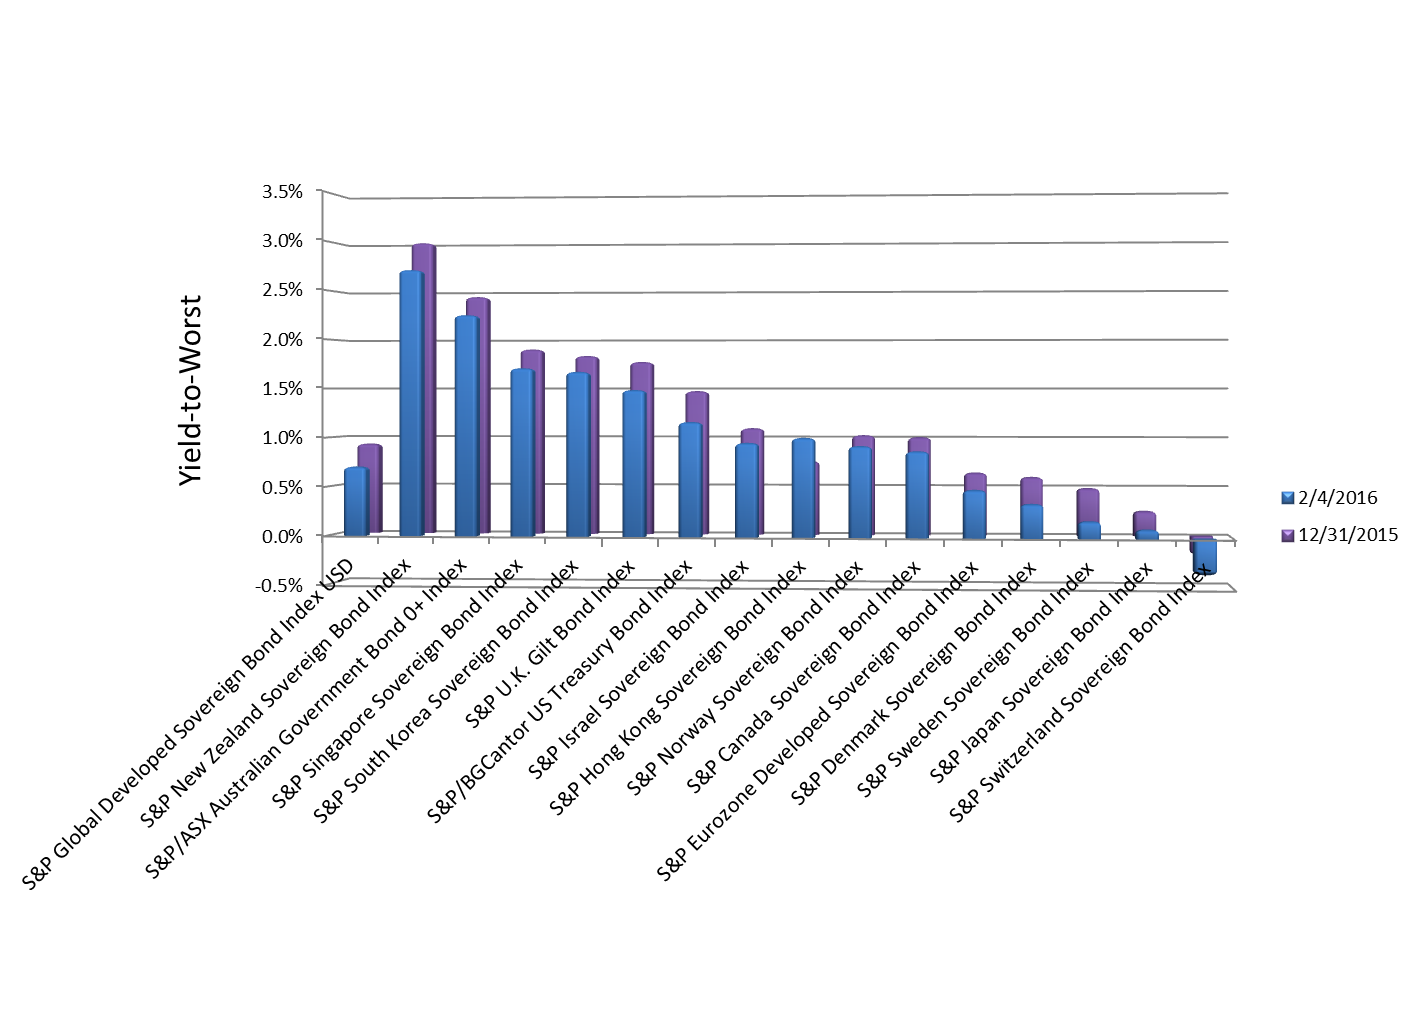
Global equity markets stumbled out of the gate in 2016, and still haven’t found their stride. Markets are experiencing an intense case of risk off sentiment, as investors flee from riskier assets in pursuit of safe havens. The yield of 10 year US Treasury Notes is down to less than 1.8%, while oft-maligned gold is coming back into favor. The VIX is also up above 26, which is over 50% higher than it was at the same time last year.

The S&P 500 remains in correction mode, as safety seems to be the name of the game. The Utilities Sector of the S&P 500 has surged in 2016, following a weak 2015. Through Friday’s close, the Utilities sector was up 8% on the year, while the broader S&P 500 was down 8% (both on a total return basis). The Consumer Discretionary sector was the strongest sectoral performer in 2015. Thus far in 2016, it had been one of the weakest, declining 12%.

This is driven in no small part by fears of slowdown in global growth, specifically in China. According to the Wall Street Journal, data out of China over the weekend showed that China’s foreign exchange reserves fell nearly 100 billion USD last month as Beijing defends the value of the Yuan in the face of growing short interests and following a 108 Billion USD decline in December. Granted, China still has over 3 trillion USD in foreign exchange reserves to work with, so this may not be as bad as it seems. Following the unexpected devaluation of the Yuan in August of last year, however, market participants are undoubtedly a little on edge.

It comes as no surprise that low volatility strategies have outperformed in this environment. The S&P 500 Low Volatility High Dividend Index was up nearly 1% through close Friday. Typically these strategies outperform in choppy markets as they decrease downside exposure. In other words, low volatility strategies provide some protection when volatility rides again.

The posts on this blog are opinions, not advice. Please read our Disclaimers.

Is Oil’s Spill Turning the Credit Cycle?

Contributor Image
Jason Giordano

Director, Fixed Income, Product Management

S&P Dow Jones Indices

While the slumping price of oil is bearing the brunt of the current volatility in the markets these days, there are other signs that indicate more widespread shifts in the credit cycle.  High-yield credit default spreads have widened, as shown by both the S&P/ISDA CDS U.S. High Yield BB and the S&P/ISDA CDS U.S. High Yield B and Below.  The indices are up 183 and 197 bps, respectively, over the past year (see Exhibit 1).  The turmoil in the energy sector has had an impact; however, the widening also represents the overall discomfort with the amount of leverage companies have on their balance sheets within the broader high-yield market.

Capture

Further evidence is shown by the S&P U.S. Distressed High Yield Corporate Bond Index.  The index is a market-weighted index comprising securities with an option-adjusted spread greater than or equal to 1,000 bps.  The number of qualifying constituents (see Exhibit 2) has increased dramatically since August 2014, with 89 new issuers entering the index just this month.  Again, the increase is not limited to only the Energy sector as new constituents represent Telecom, Financial, Consumer Discretionary and Materials sectors.

Capture


bonds
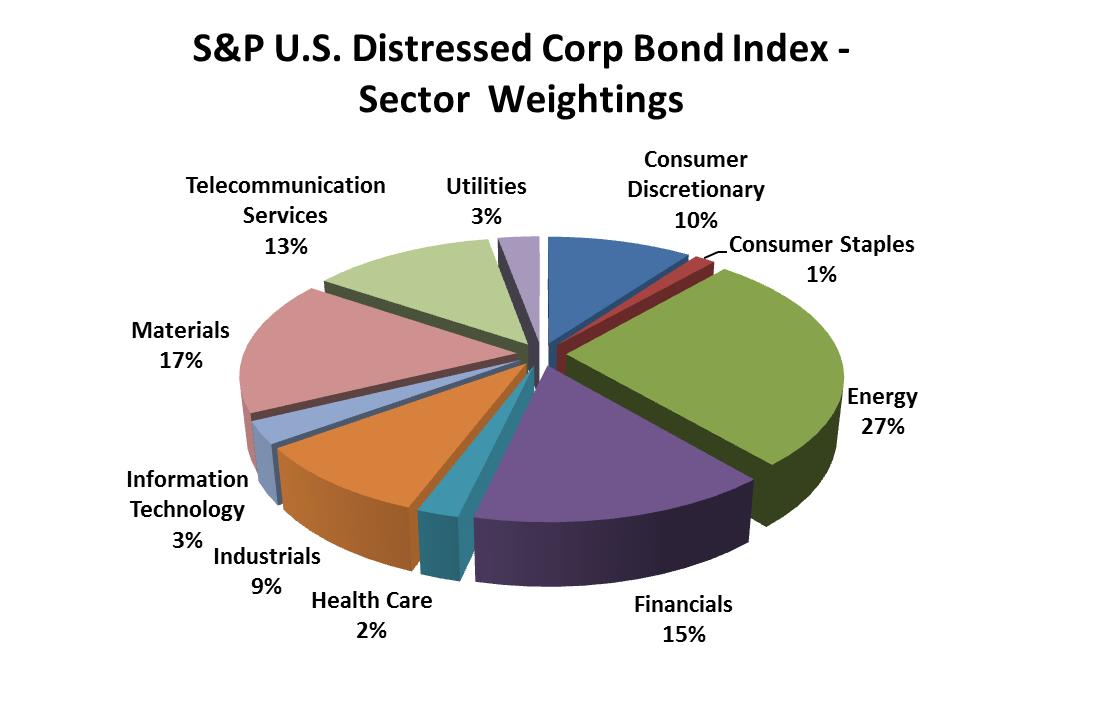
Source: S&P Dow Jones Indices LLC.  Data from February 2016.  Chart is provided for illustrative purposes.

The posts on this blog are opinions, not advice. Please read our Disclaimers.

Better Than the Headline

Contributor Image
David Blitzer

Former Managing Director and Chairman of the Index Committee

S&P Dow Jones Indices

The smaller than expected rise in payrolls in this morning’s January Employment Report disappointed people, but the details were far better than the 151,000 gain in payrolls.  Even though to total of new jobs was about 40,000 lower than the consensus forecast, some details in the number were surprisingly good: manufacturing employment jumped by 29,000.  Hours and earnings also improved. Average weekly hours were 34.6, a new post-recession high and average hourly earnings were 2.5% higher than January 2015.

The more impressive figures were in the other part of the report, the Household Survey.  The unemployment rate dipped to 4.9%, the lowest since the end of the Great Recession.  In some past months the drop in the unemployment rate resulted from people leaving the labor force – people giving up hope of finding a job and dropping out.  Not in these data: the labor force rose faster than the population rose, the employment population gained and the number of unemployed fell.  The number working part time for economic reasons crept down slightly.

The Employment Report is actually two separate surveys combined.  Most securities analysts and economists focus on the number of people working based on company payrolls –the payroll survey.  The total figure was 143,288,000; its monthly increase of 151,000 was weaker than the average of 228,000 per month during 2015.  The chart shows the monthly changes in payrolls since the start of the last recession at the end of 2007.  This report was on the low side, but shouldn’t be seen as a sign of an immediate downturn.  Those who want to watch developments weekly can follow the initial unemployment claims series reported each Thursday morning.  As long as the weekly number is under 300,000, there is not much cause for concern.  The other portion of the Employment Report is based on surveying households and asking people if they’re working. There are some differences in the two surveys – someone who has two jobs will be counted twice in the payrolls numbers but only once in the household data.

The posts on this blog are opinions, not advice. Please read our Disclaimers.

Risk Off, Yields Move Lower

Contributor Image
Kevin Horan

Former Director, Fixed Income Indices

S&P Dow Jones Indices

Global yields are lower year-to-date in all developed countries except Hong Kong, as measured by the S&P Global Developed Sovereign Bond Index.

Weak economic growth, low inflation, and concern over the situation in the Middle East have led many to invest in safer assets.

The U.S. market took note of the slowing growth, both domestically and internationally, as the S&P/BGCantor Current 10-Year U.S. Treasury Index’s yield-to-worst moved 13 bps lower between the week of Jan. 28, 2016, and Feb. 4, 2016.

Japan’s policy makers switched to negative interest rates in an attempt to keep the economy from going deeper into the malaise that has weighed down its economy for the last two decades.

The European Central Bank is in a sub-zero interest rate environment as well.

The Bank of England board members voted unanimously to hold rates at 0.5%.

The Swedish Riksbank will meet Feb. 11, 2016, possibly to announce even lower interest rates, after adopting negative interest rates a year ago.

Oil prices, as measured by WTI crude oil futures, have moved down 18% since the beginning of the year to USD 31, as of Feb. 4, 2016.

Exhibit 1: Countries of the S&P Global Developed Sovereign Bond Index
Countries of the S&P Global Developed Sovereign Bond Index


Source: S&P Dow Jones Indices LLC.  Data as of Feb. 4, 2016.  Chart is provided for Illustrative purposes.

The posts on this blog are opinions, not advice. Please read our Disclaimers.

Credit Spread and Low Volatility Factors

Contributor Image
Hong Xie

Former Senior Director, Global Research & Design

S&P Dow Jones Indices

Factor Definition
The fixed income investment community has long used volatility in analyzing bond valuations and identifying investment opportunities.  We have defined volatility as the standard deviation of bond yield changes for the trailing six-month period.  All else being equal, the more volatile the bond yield is, the higher the yield needs to be in order to compensate for the volatility risk.

For the credit spread factor, we consider the option adjusted spread (OAS), which represents the yield compensation for bearing credit risk, as well as other risks associated with credit.  OAS is a common measure of valuation for corporate bonds.

Factor Identification
To identify the factors that could enhance security selection, we computed the performance statistics of the quintile portfolios ranked by each factor and demonstrated the strong relationship of factor exposure, portfolio return, and return volatility.

The underlying universe for our study was the S&P U.S. Issued Investment Grade Corporate Bond Index (U.S. issuers).  The index seeks to measure the performance of investment-grade corporate bonds issued by U.S.-domiciled corporations denominated in U.S. dollars.  Based on the availability of the constituent data and the yield curve, the period covered in the study was from June 30, 2006, through Aug. 31, 2015.  We derived an investable sub-universe (details in next blog) based on the broad universe and constructed quintile portfolios of the investable sub-universe.

To form the quintile portfolios, we first ranked bonds within the investable sub-universe by each factor (credit spread and low volatility) and divided the universe into five groups, with higher values ranking higher (Quintile 1) for credit spread and lower values ranking higher (Quintile 1) for low volatility.  It should be noted that these two single-factor portfolios did not control for either duration or credit rating.  Exhibit 1 shows the performance statistics of ranked quintile portfolios by single factors.

Capture

Exhibit 1 confirms a positive relationship between credit spread, portfolio return, and return volatility; i.e., the wider the credit spread is, the higher the return and return volatility are (Quintile 1).  Contrary to the credit spread factor, we observed a non-linear relationship between risk and return for the low volatility factor.  The Quintile 1 portfolio, containing the least volatile bonds, had the lowest return and the highest level of realized portfolio volatility.

Exhibit 1 also includes performance statistics for the quintile portfolios formed by ranking the low volatility factor within each duration and rating grouping.  These modified quintile portfolios displayed a generally positive relationship between the low volatility factor, return, and return volatility, as expected.

This demonstrates that applying the low volatility factor without taking duration and quality into consideration is not consistent in explaining portfolio return and risk.  This is because simply ranking bonds by yield volatility across the universe can potentially result in highly concentrated portfolios in duration or quality, which in turn can cause greater portfolio volatility.  This can be particularly exacerbated when long-duration bonds exhibit lower yield volatility than short-duration bonds when the market is quiet.

These findings confirm that credit spread and low volatility factors can effectively explain portfolio return and volatility and present the necessity of applying factors while taking duration and quality into consideration.

The posts on this blog are opinions, not advice. Please read our Disclaimers.