Get Indexology® Blog updates via email.

In This List

By the Numbers: ETF Investment and the Indian Market

Survivorship Bias

The Rieger Report: Defaulted municipal bonds return -1.5% year-to-date

The Rieger Report: Junk Bond Market Performance Varies in 2015

Two ugly views of the energy debt markets

By the Numbers: ETF Investment and the Indian Market

Contributor Image
Utkarsh Agrawal

Associate Director, Global Research & Design

S&P Dow Jones Indices

Since the introduction of ETFs, the dynamics of investing has changed dramatically. Apart from being more transparent, with lower costs and improved tax efficiency, ETFs have helped create the opportunity for smaller investors to access asset classes previously available only to institutional investors. Emerging markets tend to be riskier than developed markets, but can also offer diversification opportunities. With emerging market ETFs, it has become possible to incorporate the objectives and constraints of investors who desire exposure to emerging markets in their portfolio construction process. Among emerging markets, India has been one of the preferred countries. The assets under management (AUM) and the number of the ETFs that provide exposure to India have increased tremendously. All of these ETFs are based on Indian equities. As of July 2015, there were 27 of them, with combined AUM of USD 12.80 billion, domiciled across seven countries (see Exhibit 1). The U.S. has been the greatest contributor in terms of both AUM and the number of ETFs, followed by France, Singapore, and other countries. Since August 2015, the combined AUM has decreased by more than USD 2.27 billion, amounting to a decline of almost 18%, and it stood at USD 10.53 billion as of September 2015. This reduction in AUM has also contributed to the volatility of the equity market and the exchange rate in India.

Exhibit 1: International Equity ETFs That Provide Exposure to India

ETF Exhibit 1
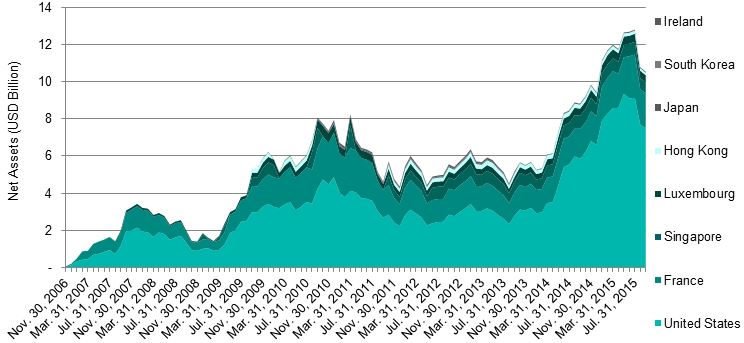
Source: Morningstar. Data as of Sept. 30, 2015. Chart is provided for illustrative purposes. 

As opposed to the international Indian ETFs, India’s domestic ETFs are not only limited to equities. They also include commodities, fixed income investments, and money markets (see Exhibit 2). As of September 2015, the total number of domestic ETFs was 51, and the combined total AUM stood at USD 2.09 billion. The proportion of domestic equity ETFs in the combined total AUM was almost 48%, at USD 1.00 billion as of September 2015. The AUM of the domestic equity ETFs in India account for just 10% of that of the international equity ETFs that provide exposure to India. The recent rise in AUM of India’s domestic equity ETFs can be attributed to the introduction of the Central Public Sector Enterprise (CPSE) ETF, as well as the investment by the Employees’ Provident Fund Organization (EPFO). The Central Board of Trustees (CBT), the apex decision-making body of the EPFO, has recently decided to invest in India’s domestic equity ETFs within the prescribed limit of 5%-15% of the total corpus.

Exhibit 2: Domestic ETFs in India 

ETF Exhibit 2
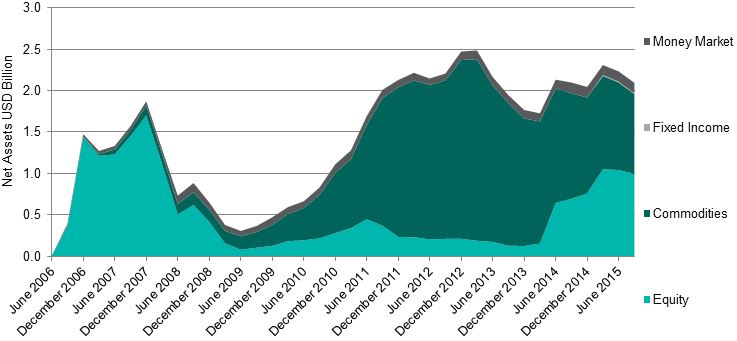
Source: Morningstar, Association of Mutual Funds in India and Reserve Bank of India. Data as of Sept. 30, 2015. Chart is provided for illustrative purposes.

The S&P BSE SENSEX, India’s heavily tracked bellwether index, is designed to measure the performance of the 30 largest, most-liquid, and financially sound companies across key sectors of the Indian economy. As of September 2015, it has served as the underlying index to one international equity ETF, which provides exposure to India, and five domestic Indian equity ETFs. Over the past 10 years, ending in September 2015, the S&P BSE SENSEX has yielded an annualized total return of 13.32% in Indian rupees (see Exhibit 3). Apart from domestic Indian equity ETFs based on other indices, the EPFO will also invest in the domestic S&P BSE SENSEX ETF, leading to expectations of a further boost to the AUM of this established index.

ETF Exhibit 3
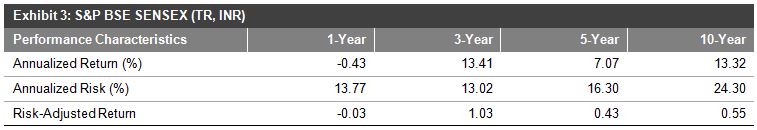
Source: S&P Dow Jones Indices. Data as of Sept. 30, 2015. Chart is provided for illustrative purposes. Past performance is no guarantee of future results. 

The posts on this blog are opinions, not advice. Please read our Disclaimers.

Survivorship Bias

Contributor Image
Craig Lazzara

Former Managing Director, Index Investment Strategy

S&P Dow Jones Indices

This morning’s Wall Street Journal interviews Peter Lynch, the legendary and erstwhile manager of the Fidelity Magellan Fund, who, unsurprisingly, turns out to be an advocate of active equity management.  “People accept that active managers can’t beat the market and it’s just not true,” says Mr. Lynch, who certainly did beat the market in his day.

In support of this view, we learn that “a Fidelity spokesman says about three-quarters of its 49 equity funds managed by the same portfolio manager for at least five years were beating their benchmark over the manager’s tenure…”  A casual perusal of Fidelity’s website reveals a total of 110 actively-managed equity funds (41 U.S., 25 international, and 44 sector-specific), which means that less than half have had the same manager for five years.  If Fidelity wished to do so, they could implement a policy of changing the manager of any fund which hadn’t outperformed over the manager’s tenure (perhaps after a five-year probationary period).  Then their spokesman could announce that 100% of the funds managed by the same portfolio manager for at least five years had beaten their benchmark.  It would be a more impressive sound bite, but just as meaningless a statement about the nature of active management.

Otherwise said: suppose two new portfolio managers take over new funds this year, and after four years one is outperforming her benchmark while the other is underperforming.  Which of the two do you think has the better chance of making it to year five?  The Fidelity statistic is a classic illustration of survivorship bias.  When we control for survivorship, as in our SPIVA reports, the majority of active managers underperform most of the time.

What is true across the population of active managers does not mean that individual managers cannot be exceptions.  Indeed, Peter Lynch is famous precisely because his performance was exceptional.   If most active managers could outperform consistently, we wouldn’t celebrate the few who do.

The posts on this blog are opinions, not advice. Please read our Disclaimers.

The Rieger Report: Defaulted municipal bonds return -1.5% year-to-date

Contributor Image
J.R. Rieger

Former Head of Fixed Income Indices

S&P Dow Jones Indices

As the Puerto Rico municipal bond saga continues it may be helpful to look at how other distressed municipal bonds have performed through Friday December 4th 2015.

The S&P Municipal Bond Default Index tracks municipal bonds that have entered default by not paying all or part of the promised principal or interest when due.  It currently tracks over 250 bonds with a par value of over $5.4 billion.   Within the index there are several sectors which have historically had the majority of defaults take place.  Those sectors are the  land backed, health care, corporate Backed and multifamily sectors.

Table 1: Municipal bond indices tracking defaulted bonds:

Municipal Default 12 2015

So far, the S&P Municipal Bond Default Index is in negative territory with a return of -1.54%.  Corporate backed municipal bonds have seen a positive return of over 5.4%.  Smaller sectors such as the health care and multifamily sectors have seen significant negative results with health care bonds being crushed by over 35% in 2015.

If and as the Puerto Rico bonds default it can be expected that they will be added to the S&P Municipal Bond Default Index during a monthly index rebalancing and if they do they may have a significant weight in this index.

The posts on this blog are opinions, not advice. Please read our Disclaimers.

The Rieger Report: Junk Bond Market Performance Varies in 2015

Contributor Image
J.R. Rieger

Former Head of Fixed Income Indices

S&P Dow Jones Indices

The junk or high yield bond markets in the U.S. have seen diverse returns so far in 2015.  Municipal junk bonds are out performing both the senior loan and fixed rate corporate high yield segments of the market.  While municipal bonds are being buffeted by Puerto Rico corporate bonds and loans are seeing more significant head winds.

Table 1:  Select indices tracking below investment grade segments of the debt markets.

High Yield Asset Classes 12 2015

When looking a little deeper into  ratings categories within these segments the municipal bond market has continued to shine.  Starting with the investment grade BBB ratings category, municipal bonds have had a return of nearly 3.5% year-to-date while the large entities tracked in the S&P 500 BBB Investment Grade Corporate Bond Index has recorded a negative 0.46%.  Moving into the below investment grade category of BB+ and below municipal bonds are still outpacing their corporate counterparts.  The BB quality range is being impacted by energy bond issues, such as those from Chesapeake Energy, which are playing a big role in dragging down the corporate bond junk sector in 2015.

Table 2: Select indices representing specific ratings categories of the debt markets.

High Yield Ratings Categories 12 2015


The posts on this blog are opinions, not advice. Please read our Disclaimers.

Two ugly views of the energy debt markets

Contributor Image
J.R. Rieger

Former Head of Fixed Income Indices

S&P Dow Jones Indices

The impact of low energy prices is rippling through the debt markets for bonds issued by energy related companies.  The S&P 500 Bond Index has returned a modestly negative total return of -0.31% year-to-date while the energy bond sector tracked in the S&P 500 Energy Corporate Bond Index is down 5.79% year-to-date.

Table 1: Select Sector Indices from the S&P 500 Bond Index family:

500 bond sectors 12 2015

The credit default market also has reacted.  The cost of buying default protection on the debt of the 10 entities in the S&P/ISDA CDS U.S. Energy Select 10 Index has shot upward by over 150% since May 1st 2015 from 213bps to end December 3rd 2015 at 539bps.  This could be an indication that market participants are expecting more downward pressure for this sector over the near term.

Chart 1: Select S&P/ISDA U.S. CDS Indices

Energy CDS 12 2015

Table 2: The 10 entities in the S&P/ISDA U.S. Energy Select 10 Index as of December 3rd 2015:

 Anadarko Petroleum Corp.
Apache Corp
Chesapeake Energy Corp.
ConocoPhillips
Devon Energy Corporation
Halliburton Company
Kinder Morgan Energy Partners LP
Peabody Energy Corporation
Valero Energy Corp.
Williams Companies, Inc./The


The posts on this blog are opinions, not advice. Please read our Disclaimers.