Get Indexology® Blog updates via email.

In This List

The Greece Crisis is Not Our Concern, Say US Options Investors

The Small Respect it Deserves

Asia Fixed Income: A Closer Look at Indian Bonds

Risk On, Risk Adjusted: Retail and Institutional Money View Markets Differently

Looking Beyond This Week’s FOMC Meeting

The Greece Crisis is Not Our Concern, Say US Options Investors

Contributor Image
Reid Steadman

Former Managing Director, Global Head of ESG & Innovation

S&P Dow Jones Indices

English speakers have grown to love the German word schadenfreude. But what’s the single word for indifference to the suffering of others? We need to figure this out to describe what’s happening in the US options markets.

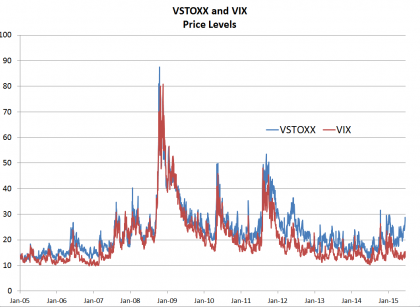
For the past decade, European and US options investors have been sympathetic to each other’s pains. When we chart the EURO STOXX 50 Volatility Index (VSTOXX) against the CBOE Volatility Index (VIX), we can see that the VSTOXX has typically been a little higher than VIX, but that these two indices have moved largely in sync.

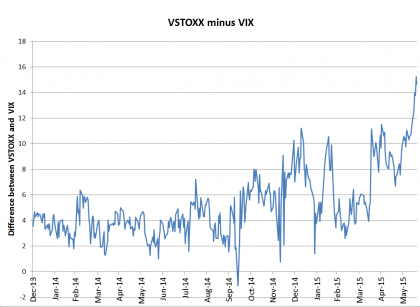
Something strange has happened, though, in the past year. VSTOXX and VIX have diverged. As VSTOXX has gone up, VIX has stayed near its floor in the low teens.

Capture

This is easier to see when we subtract the daily values of VIX from the daily values of VSTOXX and chart the difference. For only the third time in the past decade, the gap between these two measures has hit 15 volatility points.

Capture2

The chart below shows the same measure, but just over the past 18 months. The trend is unmistakable.

Capture3

Why this decoupling? One explanation I have heard is that investors see the troubles in Greece more as a political crisis than a financial one. Financial crises, such as the one that rocked the world in 2008, tend to more directly affect financial institutions that span multiple regions. Political crises, on the other hand, are less likely to spill over borders. Or so the theory says. Personally, I have difficulty seeing the difference between the two types of crises in this case.

The posts on this blog are opinions, not advice. Please read our Disclaimers.

The Small Respect it Deserves

Contributor Image
Shaun Wurzbach

Managing Director, Head of Commercial Group (North America)

S&P Dow Jones Indices

Some indices are favorites of mine.  It might be better for me to be agnostic and dispassionate.  But I can’t help myself when it comes to the S&P SmallCap 600.  As far as indices go, size does matter, and in the case of this index, being small comes with quite a bit of swagger.

I recently moderated a webinar for financial advisors where our objective was to discuss how the S&P SmallCap 600 compares to the Russell 2000.  Larry Whistler, CFA, and President and Chief Investment Officer of Nottingham Advisors, was our guest on that one to help us understand how a wealth manager and asset manager uses small cap US Equities in a portfolio.  Those who watched this webinar learned that these two indices are very different, even though on the surface, they measure the same asset class.  In fact, the S&P SmallCap 600 outperformed the Russell 2000 by 1.72% per annum since 1994.  And that outperformance by the S&P 600 came with less measured risk than in the Russell 2000.  Just to share one stat, through December 2014, the S&P 600 Sharpe Ratio was 0.47 with the Russell 2000 Sharpe Ratio at 0.34 for that same period.

Phil Brzenk, CFA, and part of our Global Research and Design team at S&P DJI, shared more during our webinar about the construction differences which exist between these two indices:

  • The S&P SmallCap and the Russell 2000 include some of the same companies, but the Russell 2000 reaches down into what we describe as MicroCap (companies with a market capitalization below $400 million).
  • Phil shared data and analysis from a recently published whitepaper, A Tale of Two Benchmarks: Five Years Later, indicating that the Russell 2000 annual reconstitution has also historically led to a performance drag.
  • The S&P SmallCap 600 has a rule that companies in that index must demonstrate financial viability. This earnings screening is not a feature that the Russell 2000 shares.  Phil showed us through factor decomposition that this index construction difference led to a higher value factor for the S&P 600 which was a significant factor in explaining the returns difference.

Through year-end 2014, the S&P 600 had higher returns in 1-year, 3- year, 5-year, and 10-year measures.  Now, to be fair, there were 7 years out of 21 years since the inception of the S&P 600 index in 1994 that the Russell 2000 outperformed.   And that .333 batting average by the Russell 2000 (compared to .667 by the S&P 600) had some financial advisors on the webinar asking questions about whether our performance analysis is sensitive to the time period of measurement.  A financial advisor who likes using the Russell 2000 stated that to make our case in performance, we would have to show him rolling returns.  So, if that’s what it takes to persuade him (and those advisors with similar questions on the webinar), then here they are:

Capture

Larry Whistler was our concluding presenter for our webinar.  He stated that an Exchange Traded Fund (ETF) tracking the S&P SmallCap 600 meets his needs for small cap exposure because the index is effective, the ETF he chose for S&P 600 exposure is low cost, and the modularity, or building-block nature, of the three headline S&P indices are precise tools to help him allocate to his size views.

The posts on this blog are opinions, not advice. Please read our Disclaimers.

Asia Fixed Income: A Closer Look at Indian Bonds

Contributor Image
Michele Leung

Former Director, Fixed Income Indices

S&P Dow Jones Indices

The CPI inflation rate in India rose as expected to 5.0% year-over-year in May 2015(from 4.9% in April), led by a higher crude oil price.  The market is now expecting the Reserve Bank of India to remain on hold, in contrary to their expectation that most other emerging market policy rate decisions will have a more hawkish stance.  This may contribute to the fact that Indian bond funds have recorded moderate inflows in the last couple weeks, as opposed to the outflows seen in most other emerging countries.

In fact, Indian bonds have remained resilient on the back of rising rates and the FOMC announcement. The total return of the S&P BSE India Sovereign Bond Index rose 2.70% YTD, compared with the 0.10% gain of the S&P BGCantor U.S. Treasury Bond Index (see Exhibit 1).

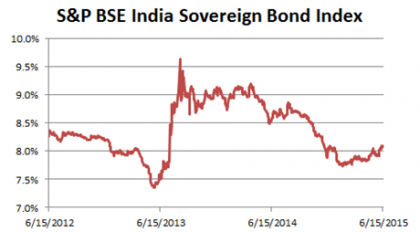
Also, the Indian sovereign bond index performance had a low correlation with the U.S. treasury market historically.  The YTM of the S&P BSE India Sovereign Bond Index currently stands at 8.08%, which has widened seven bps YTD, (see exhibit 2).  The rich sovereign bond yield may provide a cushion if global rates continue to edge up.

Exhibit 1: The Total Return of the S&P BSE India Sovereign Bond Index and the S&P/BGCantor U.S. Treasury Bond Index

Source: S&P Dow Jones Indices LLC. Data as of June 15, 2015. Past performance is no guarantee of future results. Chart is provided for illustrative purposes.

Exhibit 2: The Yield-to-Maturity of the S&P BSE India Sovereign Bond Index

Source: S&P Dow Jones Indices LLC. Data as of June 15, 2015. Past performance is no guarantee of future results. Chart is provided for illustrative purposes.

The posts on this blog are opinions, not advice. Please read our Disclaimers.
Risk On, Risk Adjusted: Retail and Institutional Money View Markets Differently

Contributor Image
Kevin Horan

Former Director, Fixed Income Indices

S&P Dow Jones Indices

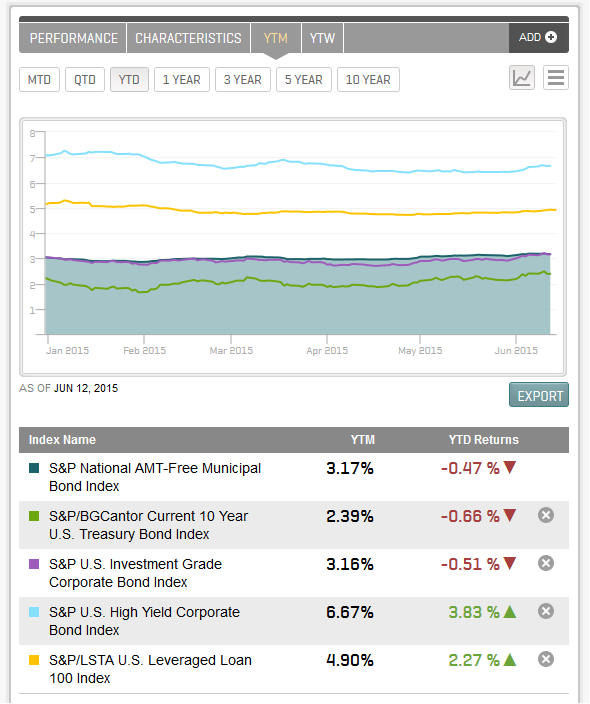
The yield-to-worst of the S&P U.S. Investment Grade Corporate Bond Index was relatively flat for the week, closing Friday, June 12, 2015, at a 3.15%.  For the previous week, Lipper data reported positive flows into investment-grade corporate bonds (June 3, 2015), which appeared to be buying on the dip, as the index moved from a yield of 2.89% on May 29, 2015, to the June 3, 2015, level of 3.10%.  The move into investment-grade corporate bonds may be opportunistic buying that resulted from the USD 2.6 billion of outflow in the high-yield market during the week of June 10, 2015.1 Current performance of the index is down, with the index having returned -1.60% month to date (MTD) and -0.51% year to date (YTD).

When comparing municipal bonds to investment-grade corporate bonds, the S&P National AMT-Free Municipal Bond Index has a yield-to-maturity of 3.17%, compared with the S&P U.S. Investment Grade Corporate Bond Index’s 3.16% pre-tax.  This traditionally retail-investor-heavy sector has a tax equivalent yield of 4.87%.  Coincidentally, the municipal bond index has only lost 0.47% both MTD and YTD.

According to the recent Financial Times article, “US junk bond rout entices asset managers”, market participants continue to require higher yields from speculative-grade investments in the face of outflows.  Professional investors tend to see the rise in yields as a potential buying opportunity for this sector.  The yield of the S&P U.S. High Yield Corporate Bond Index has moved from 6.11% at the beginning of the month to its current level of 6.46%.  The index has returned -0.94% MTD and 3.83% YTD.  Similar to high-yield bonds, speculative-grade senior loans, as measured by the S&P/LSTA U.S. Leveraged Loan 100 Index, have returned -0.36% MTD and 2.27% YTD.

Market participants’ attention will likely be on this week’s Federal Open Market Committee (FOMC) rate decision scheduled for Wednesday, June 17, 2015.  The current range of 0.00% to 0.25% is expected according to surveys.  Many investors are looking to September rather than this week’s meeting for any kind of decision.  The  week before saw the yield of the S&P/BGCantor Current 10 Year U.S. Treasury Index close two bps tighter at 2.39%, after a 27-basis-point widening the week before.  The index has lost 2.23% MTD and is down 0.66% YTD.  The S&P U.S. TIPS Index has not faired any better, as the index has returned -1.36% MTD and -0.40% YTD.  The May CPI level is due to be announced on Thursday, June 18, 2015, with 0.1% expected after having had levels of zero or slightly below since the start of the year.

1 Financial Times, US junk bond rout entices asset managers, June 15, 2015. (http://www.ft.com/intl/cms/s/0/f452f81e-129e-11e5-8cd7-00144feabdc0.html#axzz3d90M5lC9)
Fixed Income Yield Comparison

The posts on this blog are opinions, not advice. Please read our Disclaimers.

Looking Beyond This Week’s FOMC Meeting

Contributor Image
David Blitzer

Former Managing Director and Chairman of the Index Committee

S&P Dow Jones Indices

The Federal Reserve’s policy makers, the FOMC, meet today and tomorrow (Wednesday) to review the economy and monetary policy.  The minutes of the April meeting and recent comments by various FOMC members point to no change in interest rate policy at this meeting.   Recent economic news is upbeat and the debates over the weak first quarter GDP have been largely forgotten. Barring a combination of a renewed plunge in oil prices and sluggish economic reports, the Fed funds rate is likely to be 25 bp later this year, possibly as soon as September.

The first rate hike isn’t something to worry about. Developed country financial markets should react quickly and briefly and settle down within a day or two. The big question is how long the Fed waits before making another move to a 50 bp Fed Funds rate.  If a quick second step comes before the end of this year,  market participants will either think that the Fed sees a lot more inflation than anyone else or that it feels it is behind the curve and waited too long to act. Either way, markets are likely to push yields higher.

The prospects are different in emerging markets.  While the funds rate is a US benchmark and the Fed is the American central bank, both the rate and the Fed matter around the world. The reason the IMF argued recently that there is no reason to raise rates until 2016 was to delay reactions in emerging markets.  Many emerging economies took on new debt in the last few years. Many also depend on exports of oil or other commodities and are suffering with lower prices. This combination of higher debt and less income means that some emerging markets are likely to investors look for other opportunities as markets decline when the Fed moves.

The FOMC will issue a statement tomorrow at about 2 PM Eastern time. It will be carefully read for hints of when a move might come: September, October or December. Further signs of a strong economy with gains in housing and business investment as well as labor markets will point to September.

The posts on this blog are opinions, not advice. Please read our Disclaimers.