Gold, traditionally, has been perceived as a safe haven that investors flock to during periods of uncertainty and high inflation. The question we are interested in examining is whether or not the safe-haven argument holds true for protecting against homes’ falling prices.
Home prices are generally considered a leading economic indicator since a drop in housing prices implies excess demand and houses being overvalued. Price declines can reduce homeowner’s wealth and employment opportunities in the construction sector as well as government resources through the reduction in property taxes collected.
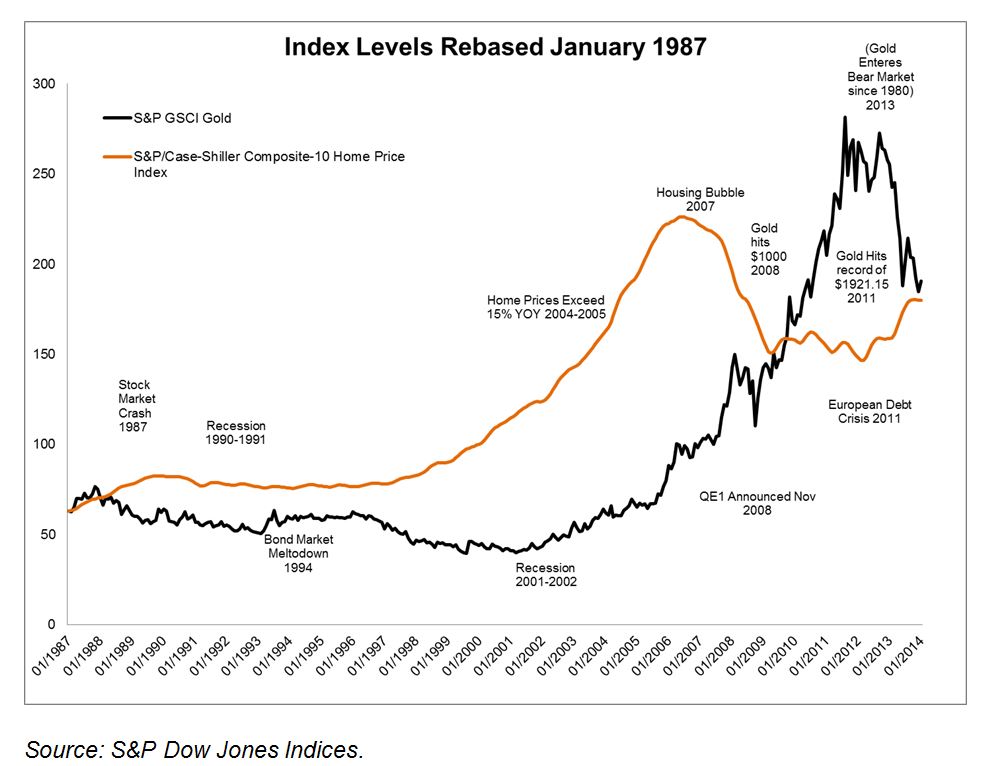
Gold and home prices, with regard to this post are represented by the S&P Case-Shriller 10-City Home Price Index and the S&P GSCI® Gold.
The chart below depicts the index levels – rebased on January 1987- of the gold and home price indices. It can be seen that during the housing trough in 2011, gold peaked. In fact, during that time period, physical gold reached a record high of $1,921 per ounce.
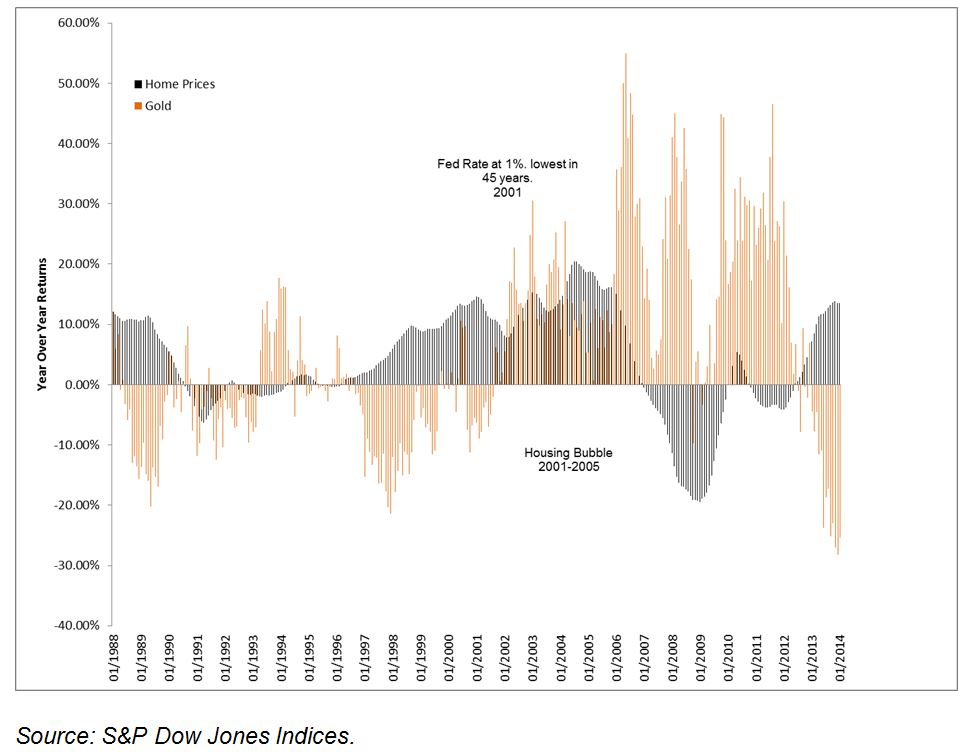
The chart below illustrates the year–over-year returns of the S&P Case-Shiller 10-City Home Price Index and the S&P GSCI Gold. Not taking into account the period between 2001 and 2006, yearly returns moved in opposite directions. During the 2001-2006 period, interest rates were historically low and reached a record 1% in 2001. In short, low interest rates make housing more affordable, driving up demand and prices. Low interest rates also make gold investments more attractive, which again drives prices up. In addition during that time period demand for physical gold from China was strong due to its strengthening economy.
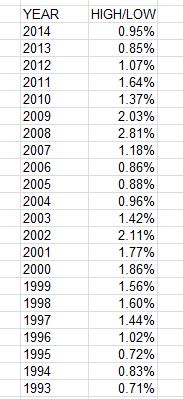
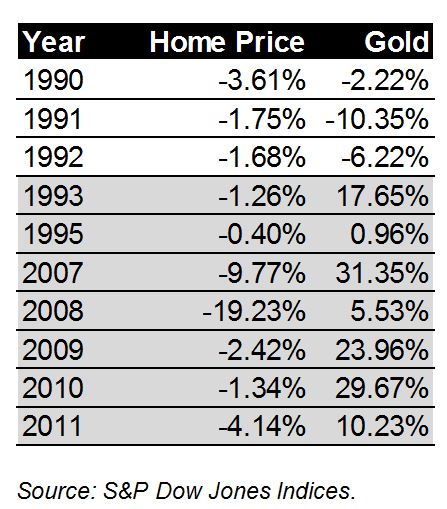
Out of the 27 year period covered in the analysis for this post, home prices had 10 annual year-to-date declines. Within the same time frame gold prices recorded seven year-to-date increases. See table below.
Will your floors be paved with Gold?