Get Indexology® Blog updates via email.

In This List

Sentimental Markets

The (Exponential) Power of Interest Rates on Commodities

Dividends Matter

Blurred Lines: Institutional Adoption of Alternative Beta

Inside the S&P 500: What makes a Company U.S.?

Sentimental Markets

Contributor Image
David Blitzer

Former Managing Director and Chairman of the Index Committee

S&P Dow Jones Indices

The Fed’s QE policy is credited with, or blamed for, inflating prices of homes and stocks. The forces pushing prices up in these markets may be the same, but buyers’ perspectives are very different.  When the S&P/Case-Shiller home price numbers were released yesterday (November 26th) there were fears that bubbles were back, especially in San Francisco and two notorious housing markets: Phoenix and Las Vegas.  `The stock market story is different.  It has risen farther, faster and for longer than homes.  For each commentator or forecaster who evidences nervousness, there are three, four or more ex-bears abandoning fear and buying stocks.  Everyone says the market can’t go up forever, but they also expect it to keep rising.  There is a minority worried about bubbles or crashes and an even smaller minority selling stocks or buying puts.

The S&P/Case-Shiller indices show that monthly price gains have been shrinking since April.  As home prices rise, some would-be buyers are priced out of the market or into smaller homes.  Further, rising prices attract new sellers, increasing supply and leading to smaller price gains, or even declines.  This is the way most markets work.  Current market sentiment and supply-inducing price increase make bubbles in house prices unlikely. Stocks are different: rising prices of either specific stocks or indices attract more buyers. The different reactions in house and stocks affect the market sentiments; and the sentiments drive the markets.

Why aren’t more people worried about the stock market?  The most common answer is fundamentals.  Earnings are rising, the PE ratio is close to its long term average, and we’ve reached these levels before without a collapse.  Looking back to the period since the market bottom in March, 2009, earnings and stock prices have risen almost in tandem. Both the PE ratio and the price-to-book ratio on the S&P 500 are only modestly higher than when the current bull market began.  However, some members of that minority of worriers are looking farther back.  Corporate earnings as a percentage GDP are at record levels. Moreover, the ratio of corporate earnings to GDP tends to mean revert – when it gets too far out of line, it heads back towards its average.  Sustaining strong earnings growth will require strong GDP growth, something we haven’t had much of lately. Maybe the Fed’s QE will work its magic on GDP growth.

The posts on this blog are opinions, not advice. Please read our Disclaimers.

The (Exponential) Power of Interest Rates on Commodities

Contributor Image
Jodie Gunzberg

Former Managing Director, Head of U.S. Equities

S&P Dow Jones Indices

Literally – or at least mathematically – there are two equations that tell the tale of interest rate impacts on commodities.

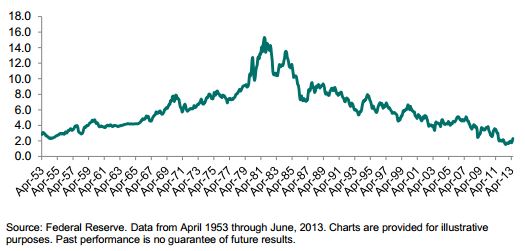
As my colleagues Fei Mei Chan and Craig Lazzara pointed out in a recent paper they authored, Much Ado About Interest Rates, “Since yields peaked in 1981, the three subsequent decades have witnessed a remarkable bull market for bonds. The yield of the 10-year Treasury bond fell from more than 15% in 1981 to its current level of less than 3%. With interest rates at historically low levels, investors might reasonably assume that it’s not a matter of if but a question of when rates will increase.

10-Year Treasury Yield from 1953-2013 Interest Rates

I’m not in the position to answer the question of when interest rates will rise but can explain how rising interest rates factor into the equations of commodity pricing and index returns.

The most direct and measurable impact of interest rates on commodities can be observed from the formal relationship between spot and futures prices, as defined by the theory of storage equation which can be written as:

F0,T = S0 exp[(r+c-y)T]

Where:

F0,T= the futures price today for delivery at time T;
S0 = the spot price today;
r = the riskless interest rate, expressed in continuous time;
c = the cost of physical storage per unit time, expressed in continuous time;
y = the convenience yield, expressed in continuous time.

This equation is often used to explain the futures price in terms of the spot price, the interest rate, the cost of storage and the convenience yield as discussed by Gunzberg and Kaplan (2007).

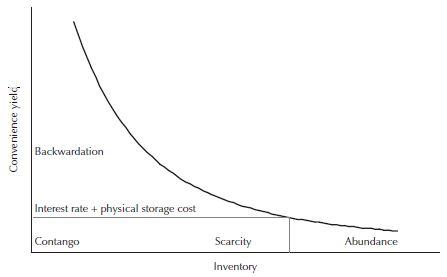
Although the interest rate and cost of storage are straightforward, the convenience yield is more complex.  It’s defined by the flow of benefits to inventory holders from a marginal unit of inventory. Generally, inventory levels have an inverse relationship with convenience yield.  This means that there is a low convenience yield when inventories are high.  However, as inventory levels fall, the convenience yield increases at an accelerated pace as inventories are depleted.

The Demand For Storage

Source: “The Long and Short of Commodity Index Investing”, by Jodie Gunzberg and Paul Kaplan, Intelligent Commodity Investing, edited by Hilary Till and Joe Eagleeye 2007.
Source: “The Long and Short of Commodity Index Investing”, by J. Gunzberg and P. Kaplan, Intelligent Commodity Investing, edited by H. Till and J. Eagleeye 2007.

Simply put, there is a price consumers are willing to pay to have immediate access to a commodity during a shortage. As an example, a refiner is likely to pay a premium to have oil when there is a shortage so that its production of gas is not disrupted.

Storage can be used by both producers and consumers to fill gaps between production and sales, or between purchases and consumption.  When a commodity is placed in storage to be delivered at a set time in the future at the futures price, then the opportunity to earn interest from selling the commodity in the spot market, then investing in a t-bill is lost. Also, one will pay the cost of the storage facility plus will gain (or lose) from the difference between the spot price and futures price.

Based on the above theory, two probable implications can be drawn about the effect of rising interest rates on commodities:

  1. Futures prices rise, and
  2. By storing, the opportunity cost is higher from the forgone interest so the incentive to store diminishes.  Not only does the incentive to store diminish, but the rising rates may motivate investors to shift investments from commodities to yield-generating capital assets.  

The second equation that demonstrates the direct impact of interest rates on commodity index returns is the total return (TR) calculation:

S&P GSCI TRd = S&P GSCI TRd-1* (1 + CDRd + TBRd)* (1 + TBRd)days

Where:

S&P GSCI TRd = the value of the S&P GSCI TR on any S&P GSCI Business Day, d

CDRd = the Contract Daily Return value represented as the percentage change in the Total Dollar Weight of the S&P GSCI on any S&P GSCI Business Day, d

TBRd= the Treasury Bill Return on any S&P GSCI Business Day, d =[1/(1-91/360*TBARd-1)1/91-1, where TBARd-1 = the 91-day discount rate for U.S. Treasury Bills, as reported by the U.S. Department of the Treasury’s Treasury Direct on the most recent of the weekly auction dates prior to such S&P GSCI Business Day, d.

days = the number of non S&P GSCI Business Days since the preceding S&P GSCI Business Day.

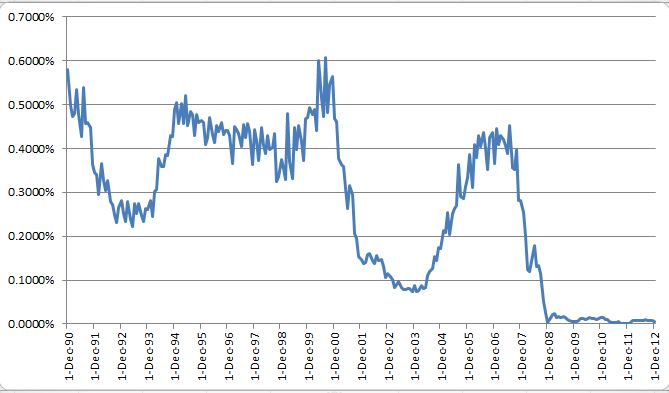
By definition, total return versions of commodity indices, such as the DJ-UBS CI and the S&P GSCI®, that incorporate the returns of the excess return (ER ) plus the Treasury Bill Return are positively impacted by rising interest rates which earn interest on the collateral of the futures contracts. Below is a chart showing the monthly return difference between the S&P GSCI TR and S&P GSCI ER:

S&P GSCI Total Return – S&P GSCI Excess Return

Source: S&P Dow Jones Indices. Data from Dec 1990 to Dec 2012. Past performance is not an indication of future results. This chart reflects hypothetical historical performance. Please see the Performance Disclosure at the end of this document for more information regarding the inherent limitations associated with backtested performance

Source: S&P Dow Jones Indices. Data from Dec 1990 to Dec 2012. Past performance is not an indication of future results. This chart reflects hypothetical historical performance. Please see the Performance Disclosure at the end of this document for more information regarding the inherent limitations associated with backtested performance

Since these indices are fully collateralized, this means that no leverage is used to gain exposure to the commodities through futures.  As such, for every dollar of exposure, there is 100% cash in margin earning interest.  The benefits are: the expected inflation plus real rate of return as well as an increase in the total return, by definition, as interest rates rise.

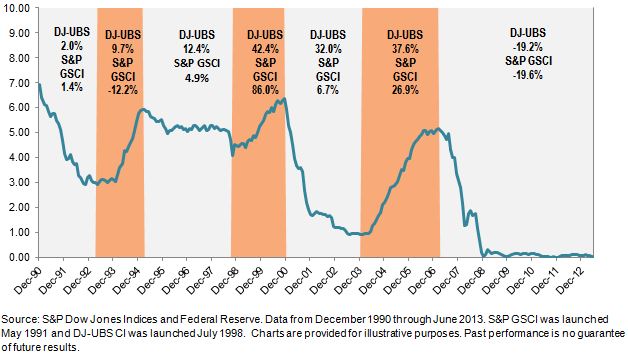
In isolation the relationship between interest rates and commodities is clear from the math. However in reality, there are other simultaneous factors so the results have been less obvious but there is potential for high commodity index returns in rising rate environments.

Commodity Index Performance during Periods of Rising and Falling Interest Rates

(Notice the similarity between the interest rates plotted below and the S&P GSCI TR- S&P GSCI ER in the graph above.)

Rates Commodities Returns

Last, I would like to mention my colleagues and I are each contributing articles on impacts of rising interest rates on various asset classes in the next edition of the S&P Dow Jones Indices’ quarterly magazine called Insights, so be sure to check it out.  

The posts on this blog are opinions, not advice. Please read our Disclaimers.

Dividends Matter

Contributor Image
Craig Lazzara

Former Managing Director, Index Investment Strategy

S&P Dow Jones Indices

This morning’s Wall Street Journal brought word that the Dow Jones Industrial Average, which reached nominal all-times highs earlier this month, was in fact still 1% below “the record that counts,” which record is argued to be the all-time high in inflation-adjusted terms.  The analysis uses the price of the Dow Industrials (e.g., last Friday’s closing value of 16,064.97), but excludes the effects of dividend paymentsThis is an unfortunate — nay, fatal — omission.

Which the Journal admits, in a backhanded way: “If you add in the effect of dividends…the Dow probably hit a real record some months ago.”  To be specific: since the DJIA’s peak on January 14, 2000, the price of the Index has risen by 37%, while consumer price inflation has risen 38%.  On a total return basis, however, the Dow has appreciated 91% since 2000 — well above the same 38% inflation bogey.

Adding in the effect of dividends shows that the Dow did indeed hit a real record some months ago — 23 months ago, to be precise.  On December 20, 2011, the DJIA closed at 12,103.58, only 3% above its 2000 peak, and well below the intervening inflation rate of 34%.  On a total return basis, the Dow’s close that day was 37% above its 2000 peak level.  Between then and now, the DJIA’s total return has remained well above the rate of inflation — which means that the record that counts has already been broken.

The posts on this blog are opinions, not advice. Please read our Disclaimers.

Blurred Lines: Institutional Adoption of Alternative Beta

Contributor Image
Xiaowei Kang

Former Senior Director, Co-Head of Global Research

S&P Dow Jones Indices

Over the recent years, the traditional divide between passive and active management has become increasingly blurred. In particular, institutional investors have shown growing interests in so call “alternative beta” or “smart beta” strategies that aim to deliver better risk adjusted performance than the market by taking active bets on systematic risk factors, while retaining the core benefits of passive investing such as low cost and transparency.

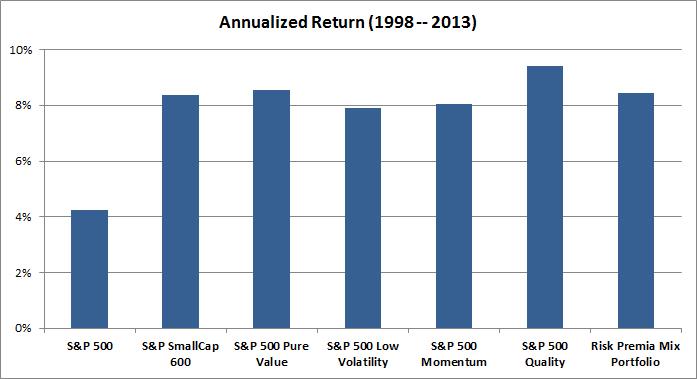
This trend is partly driven by the recognition that systematic risk premia explain the majority of long-term portfolio returns, and that a significant portion of the alpha delivered by active managers can be attributed to these systematic factors. The below Exhibit shows that, over the last 15 years, alternative beta strategies that capture exposures to factors such as value, low volatility, momentum and quality have significantly outperformed the S&P 500 by about 4% per annum.Annualized Return (1998-2013)

Source: S&P Dow Jones Indices. Data from June 30, 1998 to June 30, 2013. Charts are provided for illustrative purposes. Past performance is not a guarantee of future results. Some data reflected in this chart may reflect hypothetical historical performance.

However, there are many challenges for institutional investors to evaluate and potentially implement alternative beta strategies. For instance, investing in alternative beta strategies involves active decisions and passive implementation, thus may require significantly different investment processes and governance than traditional passive or active mandates. In addition, the recent proliferation of these strategies makes the strategy selection and due diligence process a complex and time-consuming exercise. Last but not least, as risk premia factors are cyclical, these strategies may experience sustained periods of underperformance relative to the market.

Join us for a live 60-minute webinar on December 5, 2013 to hear our panel of industry thinkers from BlackRock, Mercer and S&P Dow Jones Indices discuss the trends, opportunities and challenges in alternative beta investing. Register here.

The posts on this blog are opinions, not advice. Please read our Disclaimers.
Inside the S&P 500: What makes a Company U.S.?

Contributor Image
David Blitzer

Former Managing Director and Chairman of the Index Committee

S&P Dow Jones Indices

The S&P 500 is an index of U.S. companies.  But, exactly what a U.S. company is can be complicated.  Traditionally being U.S. company meant being incorporated in the US. However, in the last few years companies that many think of as being American are not incorporated here.  Nielsen Holding, the company which compiles ratings of television shows and other entertainment is one, Seagate Technology; a manufacturer of computer components is another.  Oil drillers, insurance companies and many more are also US companies incorporated someplace else. On the other hand, there are companies with little business here that incorporate in the U.S. or other developed countries because of the legal system or the financial markets.

All this moving around is recognized by investors who no longer judge which country a company is in only by its incorporation.  Other things are more important: where does the stock trade?  Which country’s financial reporting rules apply? Which regulator will go after the company? Where is the company doing business? Where are its competitors?  All these things matter, often far more than incorporation. Indices and index construction should reflect the markets as seen and understood by investors, not as mapped by the lawyer who filed incorporation papers many years ago.

Over the last several years S&P Dow Jones Indices consulted with investors about the best way to assign companies to countries so that our indices are most useful for analyzing markets and supporting investment products.  The results of this effort can be seen in the methodology for the S&P 500 and our U.S. indices.  These guidelines good back several years and haven’t changed recently.

The approach focuses on some key factors: U.S. companies are listed on either the New York Stock Exchange or NASDAQ and file their financial reports with the SEC as a US company on form 10-K. (Foreign companies often file financials with the SEC, but on a different form). Additionally, we consider where the assets, revenues and employees are located and how corporate governance is structured.  And we do look at where the company is incorporated.

If the index only considered incorporation, several companies and some key industries would be missing from the 500.  And, they might be replaced by companies incorporated here but with little or any local business or employees or presence, or investors, in the U.S.

The posts on this blog are opinions, not advice. Please read our Disclaimers.