




Get Indexology® Blog updates via email.

In This List

Going Against the Grain: El Niño’s Impact on Agribusiness

Diversification Across the Cap Spectrum: Why The S&P Composite 1500 Matters

Global Customers, Changing Leaders: Inside the S&P Global 100

Introducing the S&P 500 & HKEX Tech 100 Index: A Complementary Tech-Focused Blend

Introducing the S&P Kaiko Digital Asset Indices

Going Against the Grain: El Niño’s Impact on Agribusiness

Contributor Image
Vidushan Ragukaran

Director, Global Equities & Thematic Indices

S&P Dow Jones Indices

In today’s age of prediction markets and AI-driven forecasts, little is still certain. El Niño is no exception.

Its consequences can ripple across producers, supply chains, consumers and investors, offering plenty of food for thought. Shifting weather patterns can pressure harvests, commodity markets and food prices, bringing the resilience of the global food system into sharper focus.

Weathering the Forecast

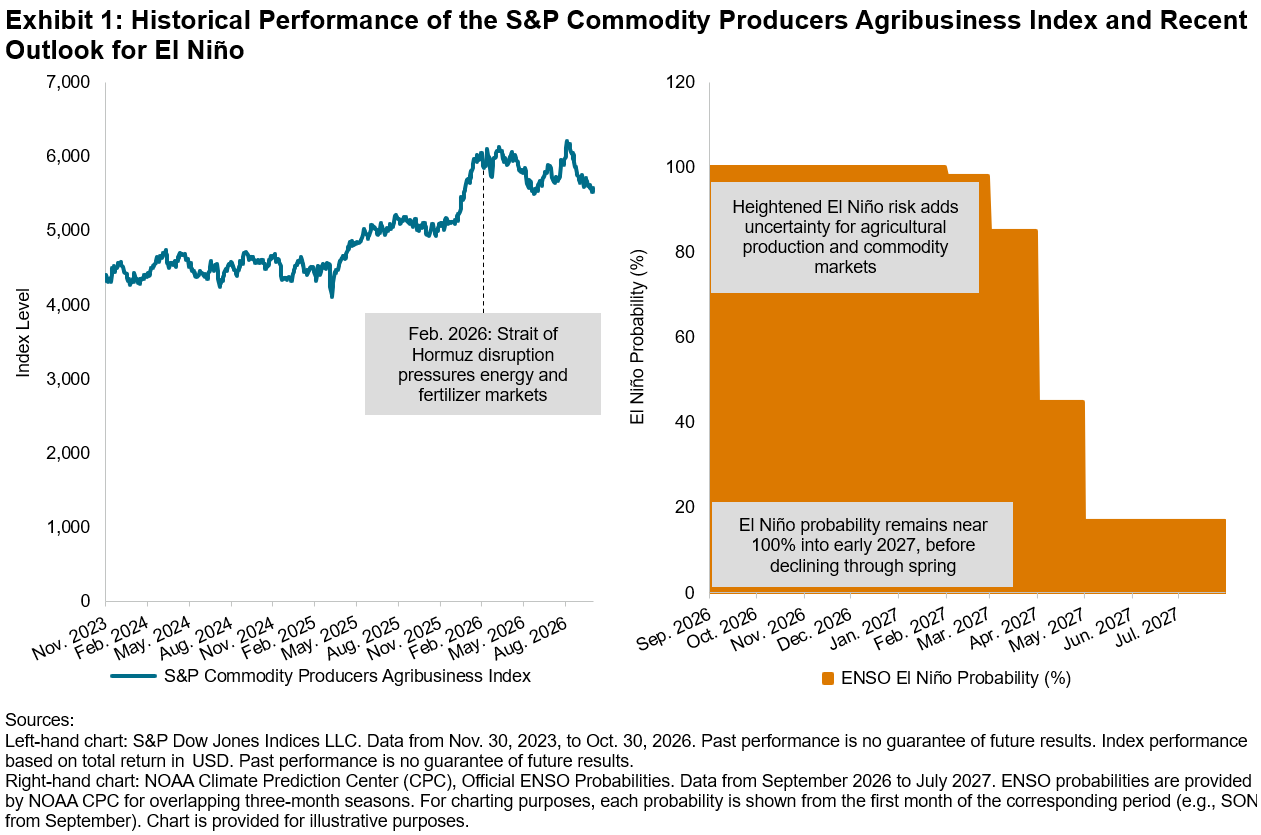
El Niño, the periodic warming of the tropical Pacific Ocean, can alter rainfall and temperature patterns around the world. Its effects are neither uniform nor certain, with the risks of drought, flooding and temperature extremes varying across regions. By October 2026, the probability of a very strong El Niño had reached 100% through October-December 2026, with strong conditions expected into early 2027.1

Agriculture provides one of the clearest transmission mechanisms. Weather anomalies can affect planting windows and crop yields, influencing farm input decisions, inventories and trade flows. Those impacts can reach commodity prices, creating potential winners and losers. S&P Global’s 2026 agriculture modeling cut its Brazilian corn forecast by 6 million metric tons to 137 million, with a further 10 million of downside if El Niño strengthens, while wetter conditions lifted Argentina’s corn forecast by 2 million metric tons.2

Exhibit 1 charts the S&P Commodity Producers Agribusiness Index alongside the latest El Niño outlook.
Growing Appetite for Resources

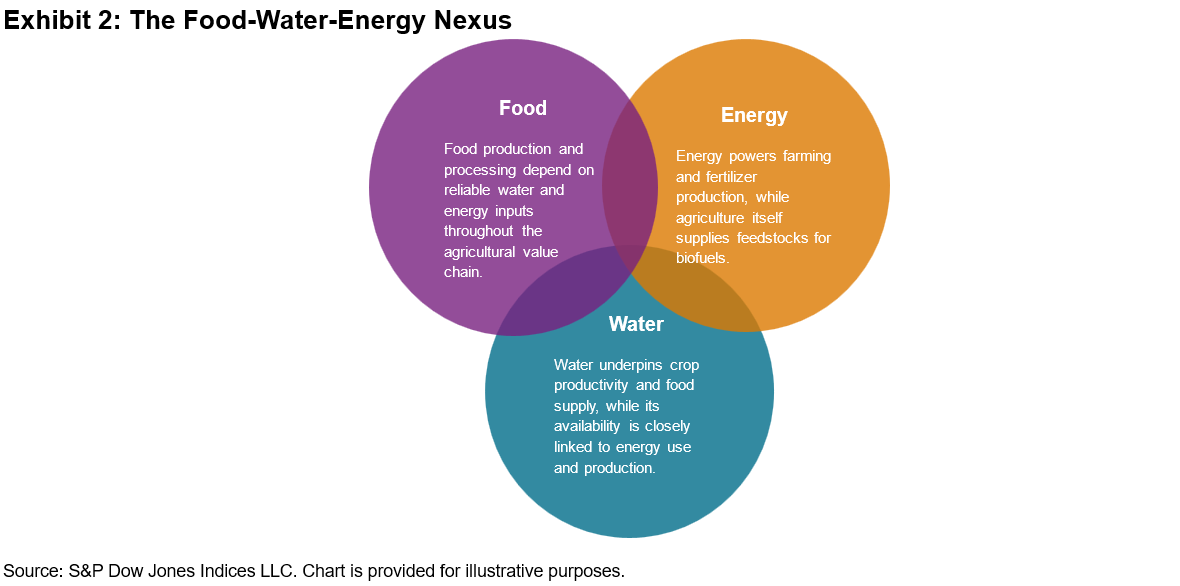
El Niño does not stop at the farm gate. A rainfall shock affecting crops can also constrain water for irrigation and hydropower, linking food and energy systems. Energy has charted its own odyssey, but remains a critical input into agriculture through fertilizer production, machinery and transport.

Resources are increasingly contested. Agriculture accounts for more than 70% of global freshwater withdrawals, while AI infrastructure is adding another source of water and energy demand.3 By 2030, AI data centers are projected to consume 945 TWh of electricity per year, with an associated water footprint equivalent to the annual basic domestic needs of 1.3 billion people.4

The result is an increasingly interconnected food-water-energy system, where pressure on one resource can quickly flow through to others (see Exhibit 2).
Those interdependencies matter particularly in 2026. El Niño is arriving against a stressed backdrop, with energy disruption and constrained fertilizer availability adding pressure across the food system. In other words, El Niño is less a single shock than a potential force multiplier for pressures already moving through the food system.

Betting the Farm on Innovation

Greater weather variability also sharpens the incentive to produce more efficiently with constrained resources. Across agriculture, 2026 innovation spans autonomous and precision machinery, AI-enabled crop management, advanced genetics, biological crop protection and more efficient plant nutrition.

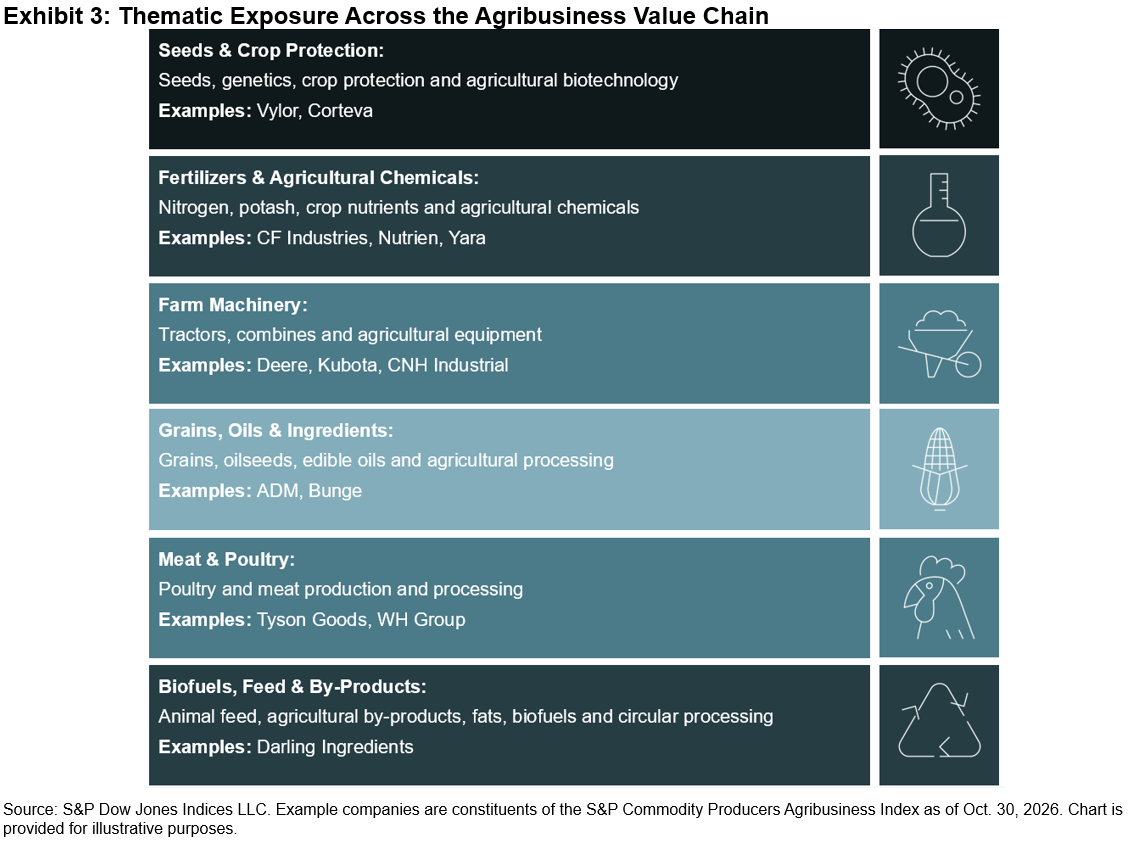
That innovation is visible across areas represented in the index. For example, Deere & Company continues to advance autonomy and precision-application technologies, while Corteva, following the spin-off of its seed business, Vylor, has highlighted a USD 11 billion innovation pipeline spanning biologicals and differentiated crop-protection technologies.5 Innovation is also extending into plant nutrition, with the International Fertilizer Association launching its first industry-wide innovation benchmark in 2026.6

Together, these developments point toward technologies designed to improve agricultural productivity, resource efficiency and resilience.

The Whole Food Chain

The agribusiness opportunity is not a prediction about which crop will benefit from the current or next El Niño. The S&P Commodity Producers Agribusiness Index spans the systems required to grow, process and ultimately deliver food, including companies involved in seeds and crop protection, fertilizers, agricultural machinery, grains and oils, meat and poultry, and feed and by-products (see Exhibit 3).
The challenge of feeding a growing, evolving world extends beyond any single El Niño cycle, with the S&P Commodity Producers Agribusiness Index tracking companies across a food system where productivity, resource efficiency and resilience are enduring priorities.


References:

1 NOAA Climate Prediction Center. “Official NOAA CPC ENSO Strength Probabilities”. October 2026.

2 S&P Global Institute. “Energy Disruption and El Niño: Leading to a Global Food Crisis?”. Oct. 19, 2026.

3 Food and Agriculture Organization of the United Nations. “The State of the World’s Land and Water Resources for Food and Agriculture 2025”. Dec. 1, 2025.

4 United Nations University Institute for Water, Environment and Health (UNU-INWEH). “Environmental Cost of Artificial Intelligence: Carbon, Water, and Land Footprints.” June 2026.

5 Corteva Agriscience, “Corteva Begins New Chapter as Focused, Innovation-Led, Global Crop Protection Leader”. Oct. 1, 2026.

6 International Fertilizer Association. “Fertilizer Innovation Unleashed”. June 2026.

The posts on this blog are opinions, not advice. Please read our Disclaimers.

Diversification Across the Cap Spectrum: Why The S&P Composite 1500 Matters

Contributor Image
Liam Flaherty

Associate Director, Index Investment Strategy

S&P Dow Jones Indices

The S&P 500® fell 1% in October and dropped by 4% on Nov. 5, 2026, its worst day since April 2025, as AI-related worries weighed on tech stocks.1 Smaller caps have offered a refuge: in October, the S&P MidCap 400 and S&P SmallCap 600 outperformed the 500 by 3% and 4%, respectively.

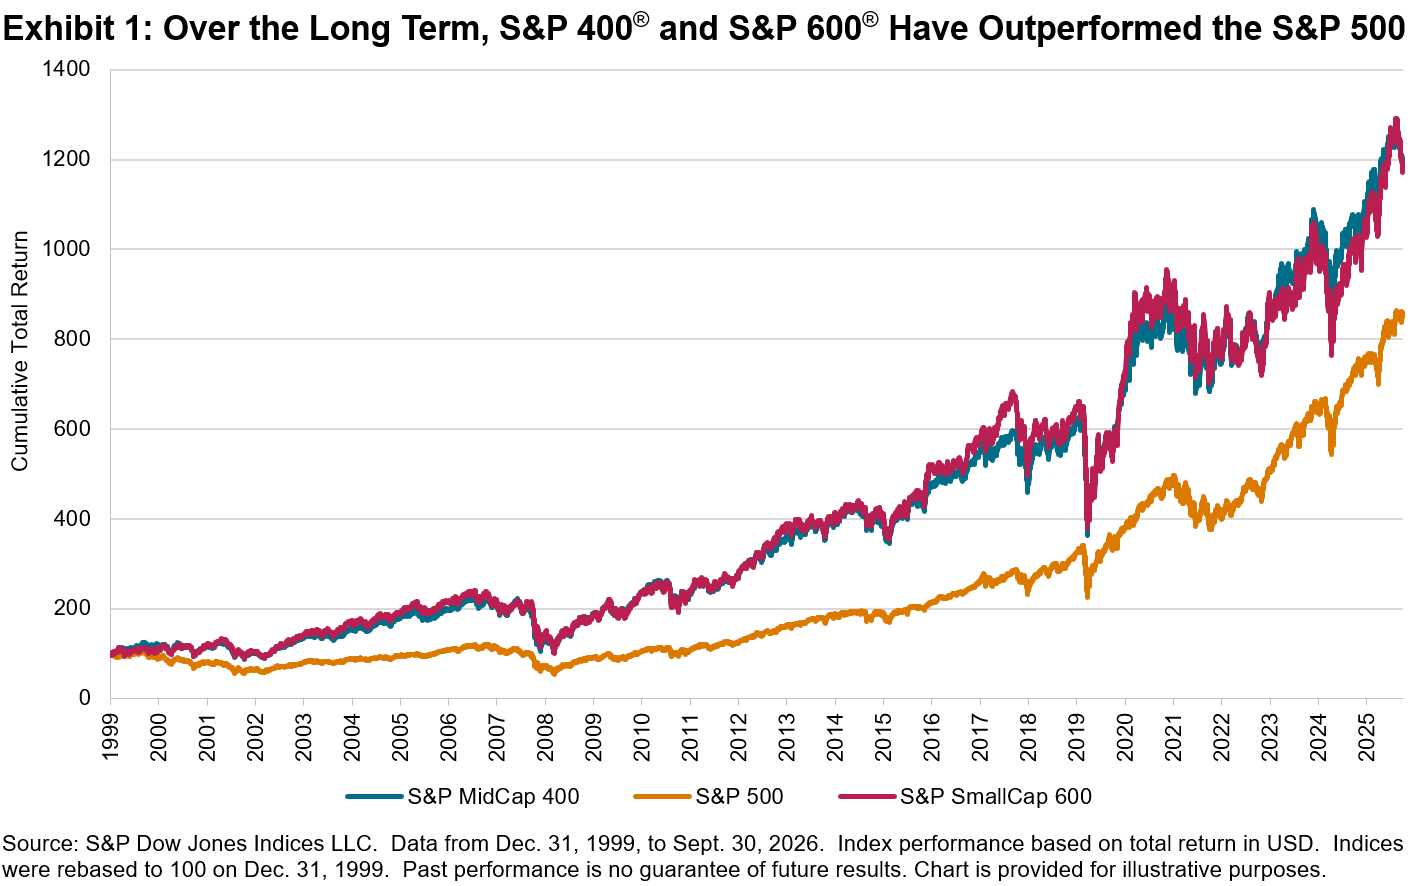
Mega-cap stocks have dominated headlines, but historically, smaller companies have had an outsized impact on market returns. In particular, the S&P MidCap 400 and the S&P SmallCap 600 outperformed the S&P 500 over the past quarter century.2

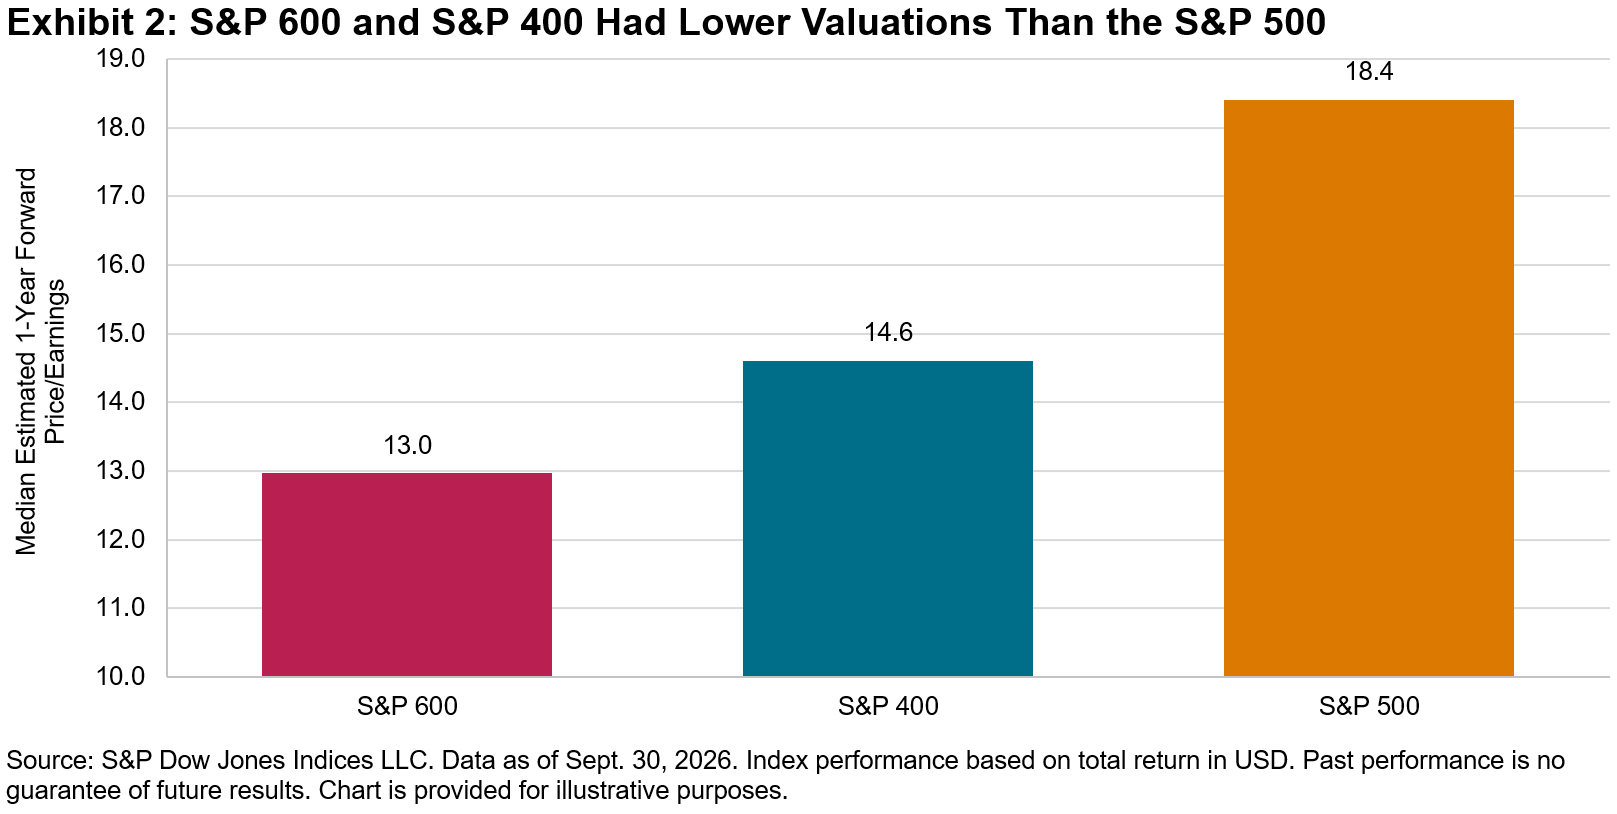
One mechanism that may help explain why small caps have tended to outperform larges caps is their value tilt, as small caps have typically traded at lower valuations than large caps.3 Exhibit 2 shows that, as of Sept. 30, 2026, the S&P 600 and S&P 400 traded at forward price-to-earnings (P/E) ratios of 13.0 and 14.6, respectively, compared to a forward P/E of 18.4 for the S&P 500.4

By combining the S&P 500 with the S&P MidCap 400 and the S&P SmallCap 600, the S&P Composite 1500® encompasses larger and smaller stocks, offering a more comprehensive view of the domestic stock market. Notably, the S&P Composite 1500 covers more than 95% of the cumulative U.S. equity market capitalization,5 as proxied by the S&P Total Market Index.

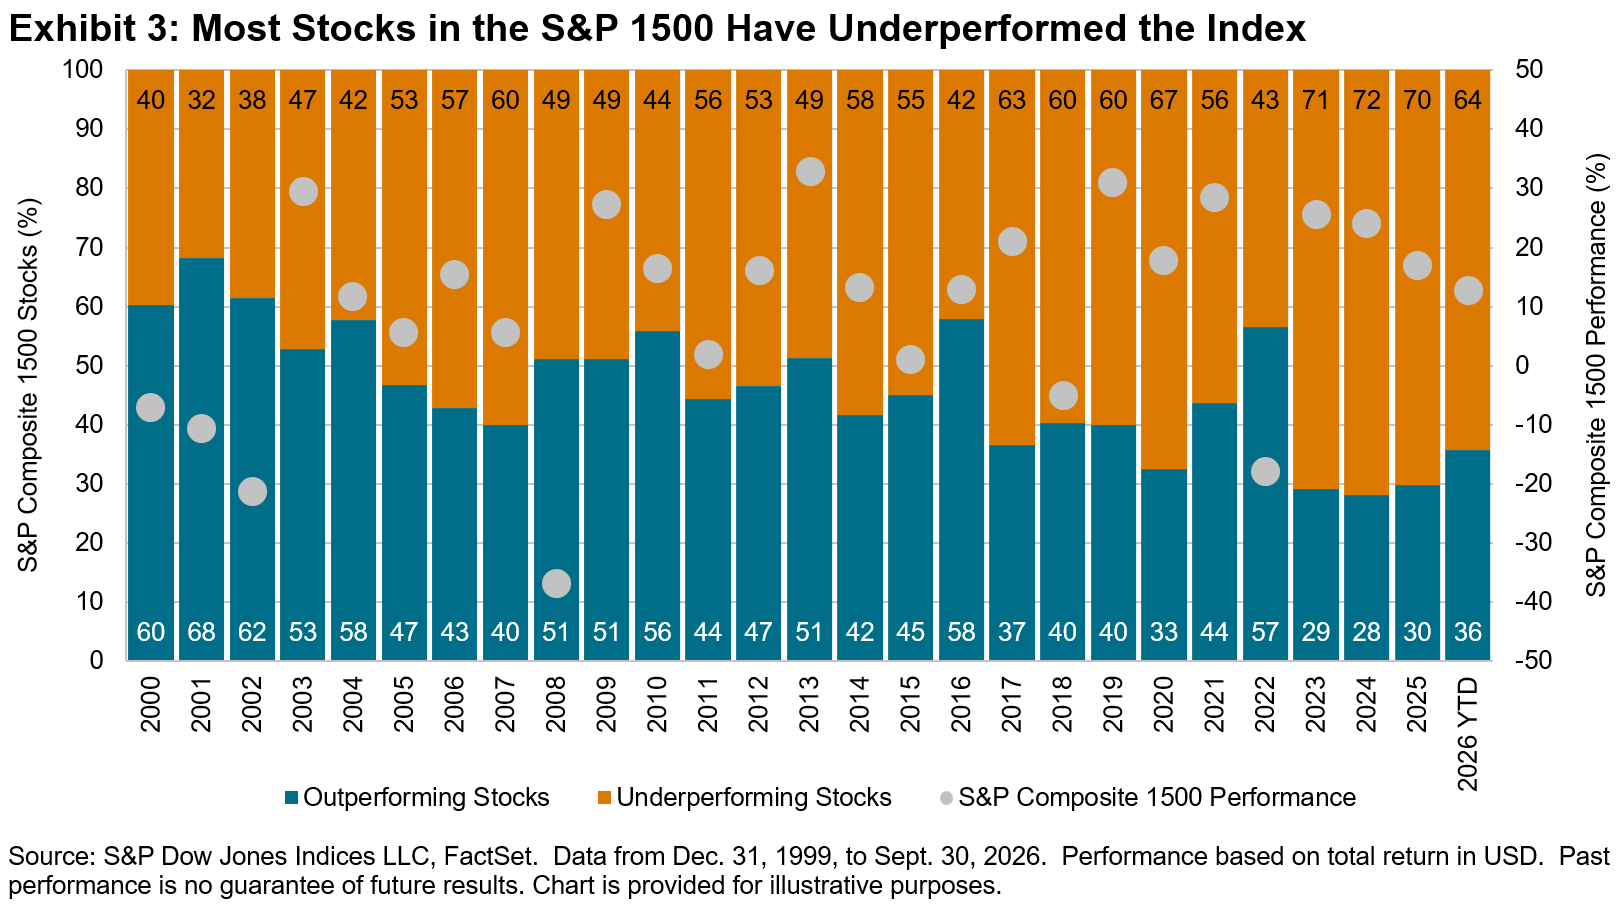
This inclusion of smaller companies has meant that the S&P 1500™ has outperformed the S&P 500 over the long term.6 However, the outperformance of the index as a whole does not necessarily extend to the performance of the component stocks in the index. For example, 70% of companies within the S&P 1500 underperformed the index in 2025.

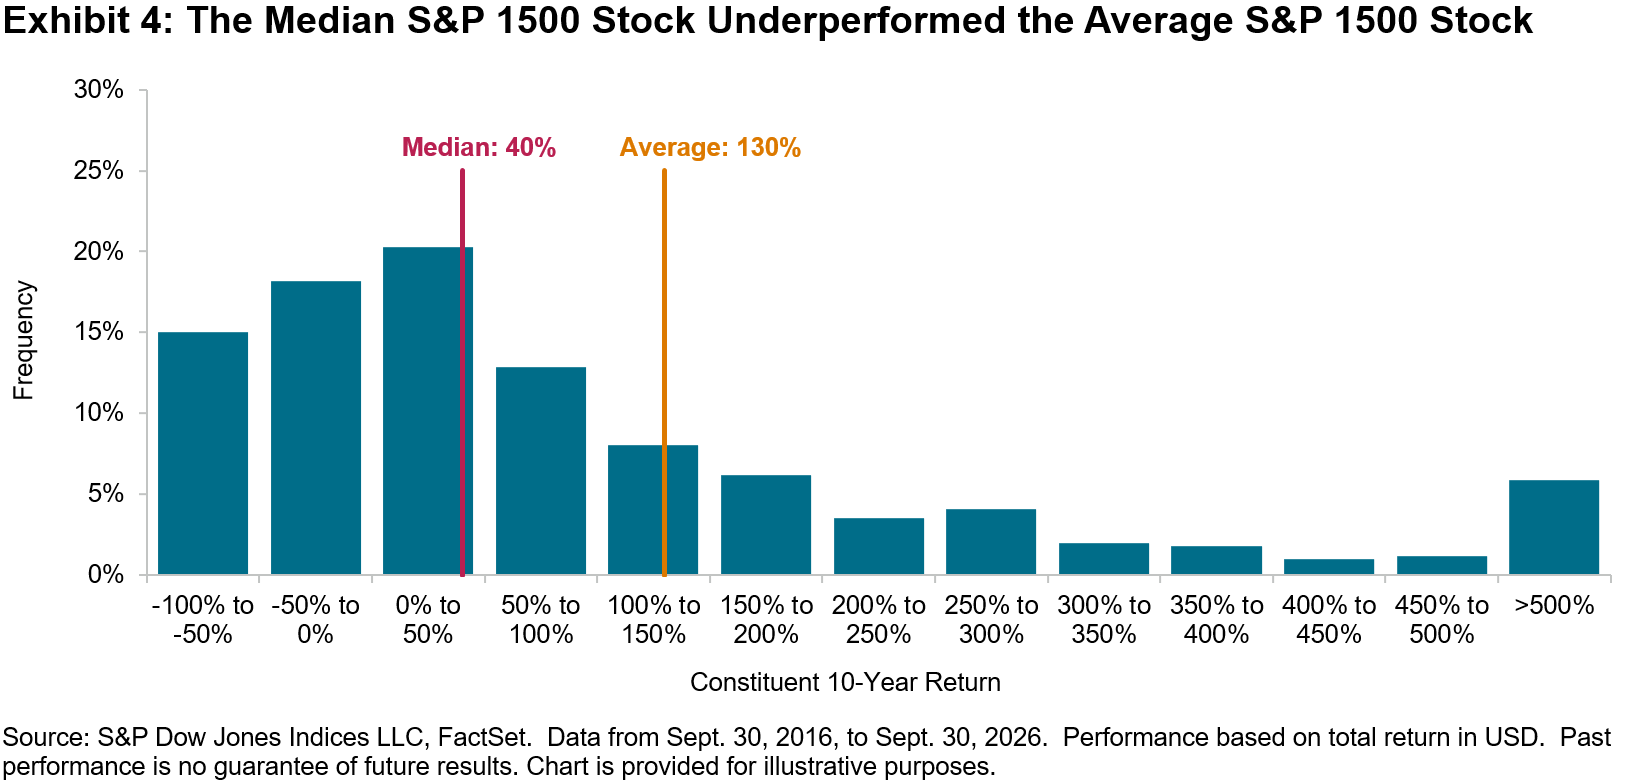
The minority of outperforming stocks is evidence of the positive skew seen in equity returns,7 with the average return exceeding the median. This skew highlights a possible benefit of indexing over active stock selection, since when fewer stocks outperform, active management tends to be more difficult.

The S&P Composite 1500 brings together companies from across the U.S. equity market, combining the size and stability of large-cap companies with the growth potential of mid- and small-cap stocks. As empirical evidence underscores the challenge of identifying tomorrow’s winners through individual stock selection,8 this index can provide a simple and diversified way to measure the breadth of the U.S. market.

1 Ganti, Anu. “AI Anxiety or Opportunity.” S&P Dow Jones Indices LLC. Oct. 28, 2026.

2 Brzenk, Phillip and Hamish Preston. “The S&P Composite 1500: An Efficient Measure of the U.S. Equity Market.” S&P Dow Jones Indices LLC. May 28, 2020.

3 Fama, Eugene F., and Kenneth R. French. “Common Risk Factors in the Returns on Stocks and Bonds.” Journal of Financial Economics Volume 33, Issue 1, 1993, Pages 3-56.

4 Edwards, Tim and Sherifa Issifu. “Hidden in Plain Sight: U.S. Equities Beyond the S&P 500®.” S&P Dow Jones Indices LLC. April 13, 2021.

5 Preston, Hamish. “Celebrating 30 Years of the S&P Composite 1500.” S&P Dow Jones Indices LLC. May 19, 2025.

6 8.5% annualized total return for the S&P 1500 versus 8.3% for the S&P 500, from Dec. 31, 1999, to Sept. 30, 2026

7 Ganti, Anu. “Skewing Success.” S&P Dow Jones Indices LLC. Sept. 30, 2025.

8 For more information, please see our SPIVA® U.S. Mid-Year 2026 Scorecard. Note that more than 90% of funds in the All Domestic Funds Category underperformed the S&P Composite 1500 over trailing time periods longer than five years.

The posts on this blog are opinions, not advice. Please read our Disclaimers.
Global Customers, Changing Leaders: Inside the S&P Global 100

Contributor Image
Darius Nass

Associate Director, Global Equity Indices

S&P Dow Jones Indices

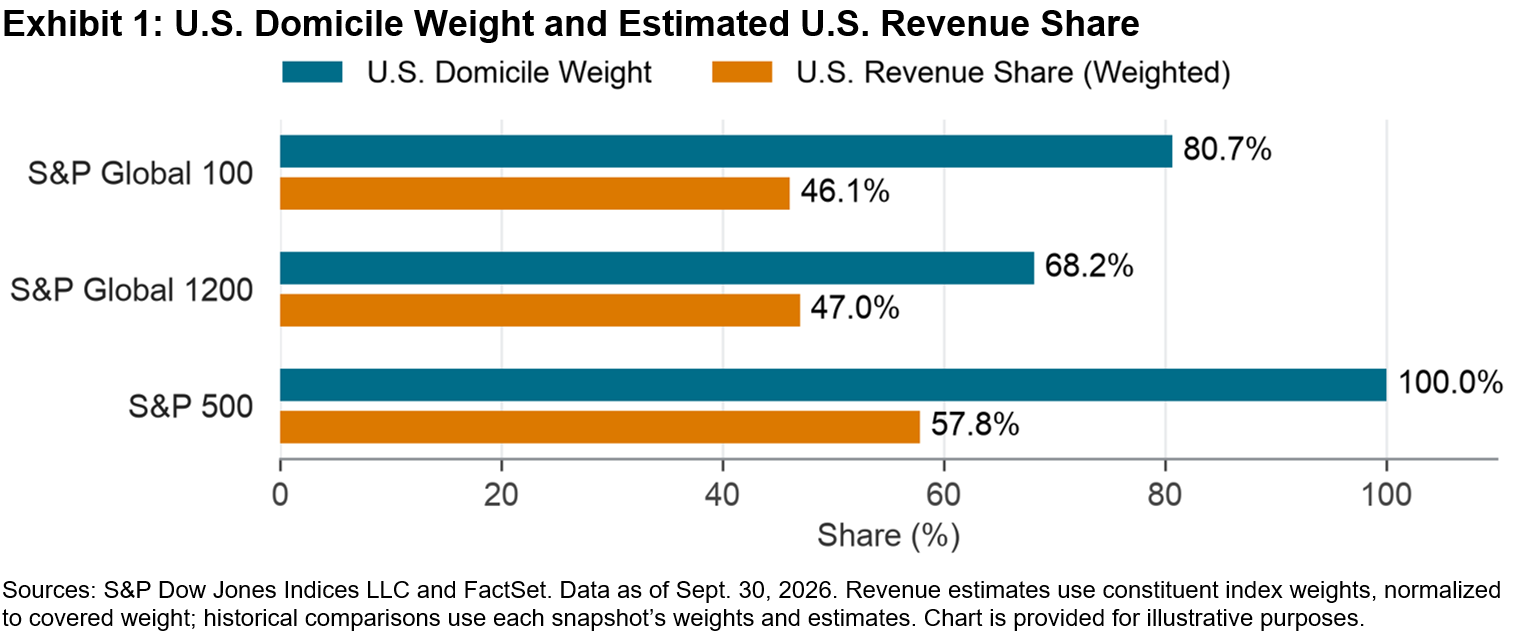
A company’s commercial address tells only part of its story. Its customers tell another. In the S&P Global 100, U.S.-domiciled companies represented 80.7% of index weight as of Sept. 30, 2026, yet 53.9% of estimated index-weighted revenue came from outside the U.S. For this group of 100 multinational companies, the location of sales brings the index’s international character into focus.

Since our June 2025 review, the largest companies have increased their weight in the index, and sector leadership has shifted from Financials to Information Technology (IT). For investors assessing international business activity as trade policies change, the index provides a focused view of major multinationals.

Where Domicile and Revenue Diverge

As of Sept. 30, 2026, the S&P Global 100®’s U.S. revenue share of 46.1% was close to the S&P Global 1200’s 47.0%; the corresponding U.S. domicile weights were 80.7% and 68.2%, respectively. The S&P 500® had a 100% U.S. domicile weight and a 57.8% U.S. revenue share. The S&P Global 100’s selection rules require eligible companies to generate more than 30% of revenue and hold more than 30% of assets outside their country of domicile. This screen applies across sectors, including IT.

That footprint was also evident in the earlier snapshot. Estimated U.S. revenue share was 43.8% on May 30, 2025, leaving more than half of weighted revenue generated outside the U.S. at both dates. The latest comparison therefore reinforces the multinational character highlighted in our earlier review.

Larger Companies and a Bigger Role for IT

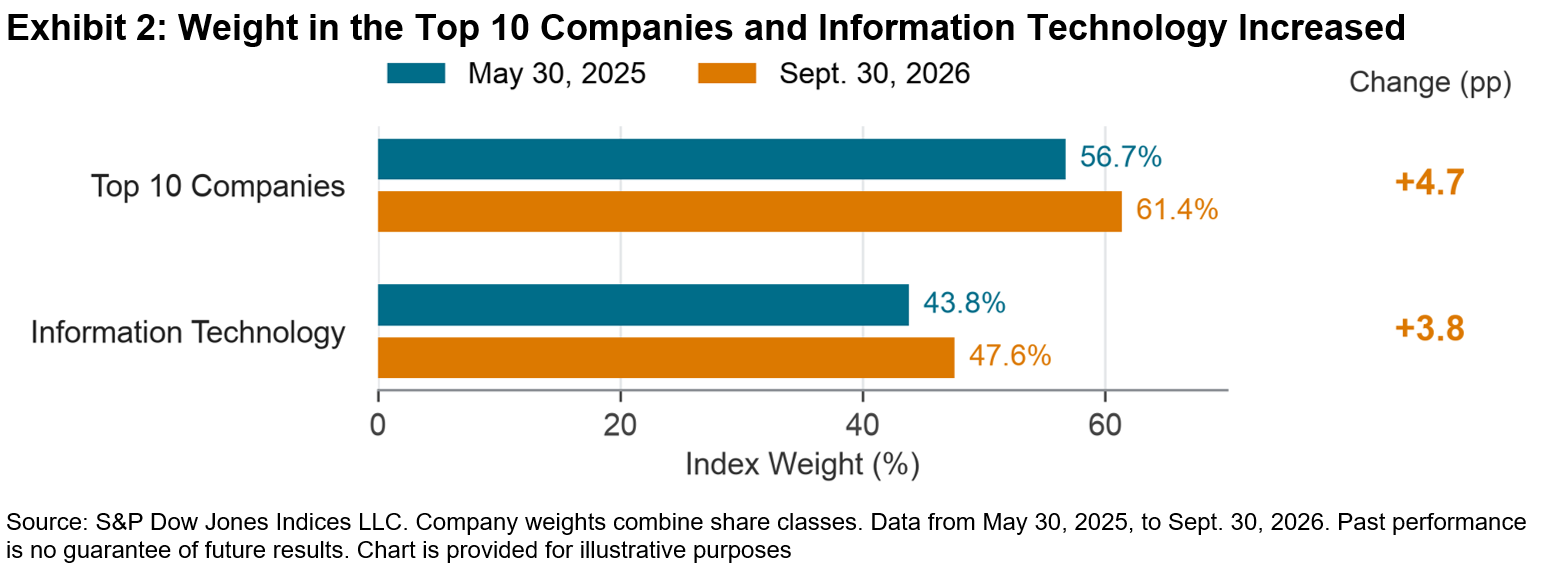
IT’s growing prominence adds a practical dimension to this global story. Semiconductor value chains connect design, equipment and manufacturing across borders, illustrating the international networks behind technology businesses. The S&P Global 100 is float-market-cap weighted. Between May 30, 2025, and Sept. 30, 2026, its top 10 companies’ combined weight rose from 56.7% to 61.4%, an increase of 4.7 percentage points.

IT’s weight also rose from 43.8% to 47.6%. Exhibit 2 reflects both changes; more than three-fifths of index weight is in the top 10 companies and almost half is in IT. These overlapping measures show the growing influence of the largest businesses and technology within the multinational benchmark.

From Financials to IT

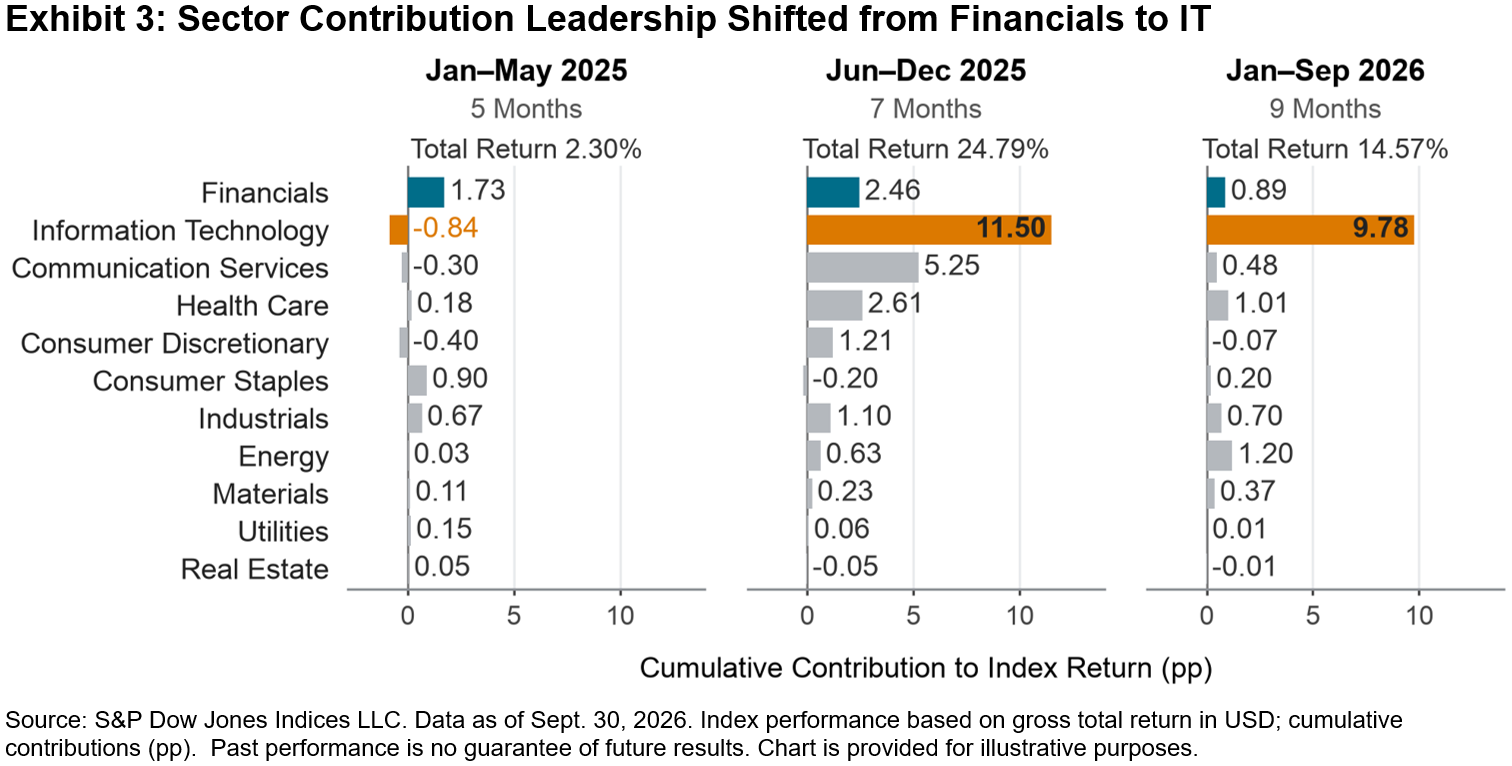
The sector contributions show how leadership changed within this multinational benchmark, from Financials in early 2025 to IT in the subsequent periods (see Exhibit 3).

January 2025-May 2025: Financials led, contributing 1.73 percentage points to the S&P Global 100’s 2.30% total return, while IT detracted 0.84 percentage points. By company domicile, non-U.S. constituents supplied positive contributions that more than offset the drag from U.S. companies. In the wider market, resilient profits and shareholder distributions supported European bank shares.

June 2025-December 2025: IT took the lead. The index gained 24.79%, with IT contributing 11.50 percentage points and Communication Services adding 5.25 percentage points. Together, the two sectors supplied approximately two-thirds of the net gain. 9 of the 11 sectors contributed positively. The broader U.S. technology rally in 2025 reflected enthusiasm for artificial intelligence (AI) and digital infrastructure.

January 2026-September 2026: IT’s share of the gain increased, accounting for approximately two-thirds of the index’s 14.57% gain and contributing 9.78 percentage points. Nine sectors again contributed positively, including Energy and Health Care. Across the wider technology market, AI disruption concerns weighed on software in early 2026 as investors favored semiconductor and memory suppliers.

The S&P Global 100 brings a focused group of major multinationals into one benchmark. Its international revenue base remains evident as the balance of company weights and sector contributions changes. Following revenue geography and sector contribution to index performance provides a more complete picture of the global businesses represented in the index and how their collective performance evolves.

The posts on this blog are opinions, not advice. Please read our Disclaimers.
Introducing the S&P 500 & HKEX Tech 100 Index: A Complementary Tech-Focused Blend

Contributor Image
Sean Freer

Director, Global Exchange Indices

S&P Dow Jones Indices

The S&P 500® & HKEX Tech 100 Index combines Hong Kong-listed technology and innovation leaders and U.S. large caps within a single, rules-based benchmark. Its focus is on targeted growth from Hong Kong and China’s most innovative technology-oriented sectors while benefiting from the scale, sector breadth and liquidity of the S&P 500.

Launched on Sept. 30, 2026, this blended “index of indices” gives a weight of 62% to the HKEX Tech 100 Index and 38% to the S&P 500, with quarterly rebalancing. The index design is based on eligibility for the HKEX ETF Connect program.

The HKEX Tech 100 Index

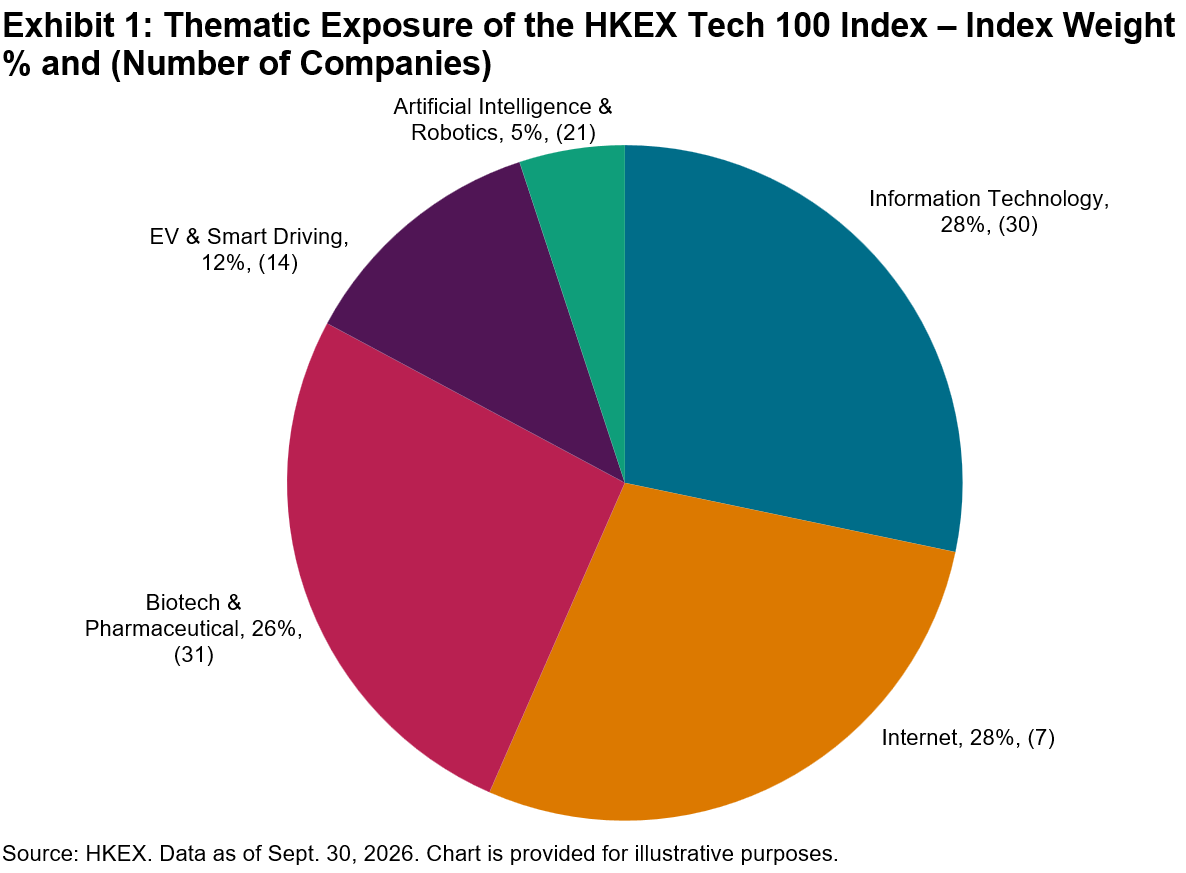
As Hong Kong’s equity market continues to grow and evolve, technology- and innovation-driven companies are playing an increasingly important role. The HKEX Tech 100 Index reflects the performance of leading and emerging companies whose revenues are aligned with high-growth themes across Artificial Intelligence, Biotech & Pharmaceutical, Electric Vehicles & Smart Driving, Internet, Information Technology (IT) and Robotics. Industry (25%) and single-stock (8%) caps help mitigate concentration risk while maintaining meaningful weights in innovation leaders such as Tencent, Alibaba, Xiaomi and BYD.

The HKEX Tech 100 Index incorporates a fast-entry mechanism and quarterly adjustment to facilitate the timely inclusion of newly listed stocks if ranked in the top 35 by free float market capitalization and eligible for Southbound Stock Connect.

Why Add the S&P 500 to the Mix?

The S&P 500 component adds U.S. large-cap equities to the Hong Kong-listed universe, extending the blended index’s coverage across markets and sectors.

The S&P 500 is widely regarded as a leading gauge of U.S. large-cap equities. It includes 500 leading companies and covers approximately 85% of the U.S. equity market and more than half of global equity market capitalization. At year-end 2025, more than USD 23 trillion1 in assets was benchmarked or indexed to the S&P 500 across passive and active strategies, supporting efficient implementation and a highly liquid trading ecosystem.

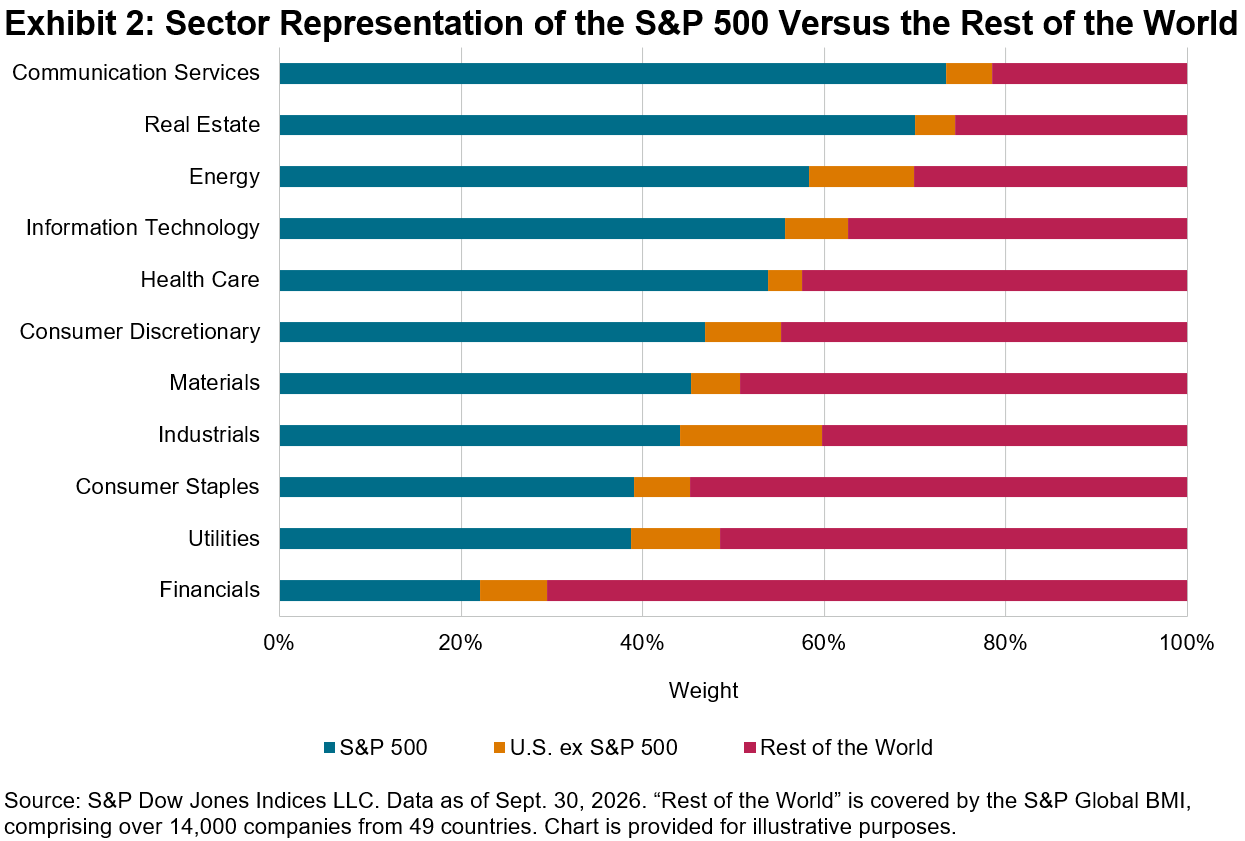
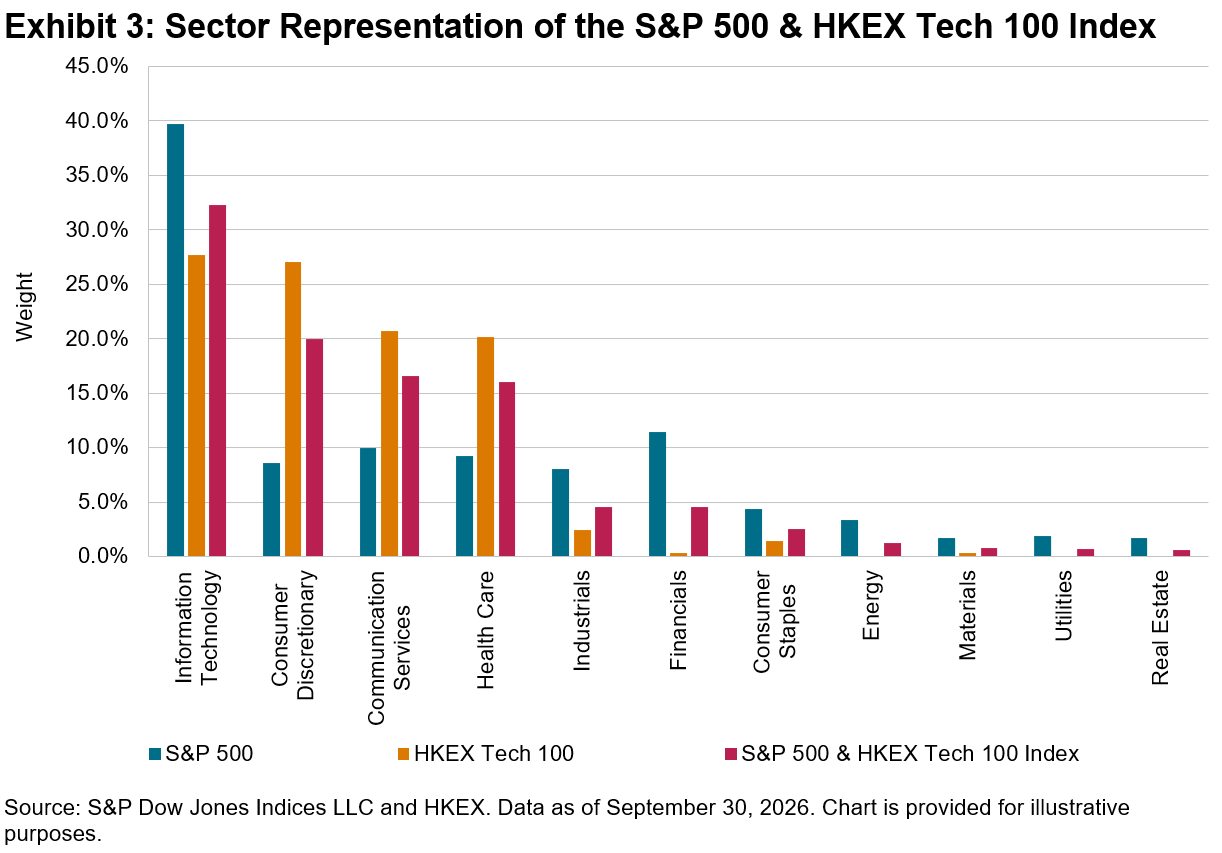
A key characteristic of the S&P 500 is its broad sector coverage, reflecting the U.S. large-cap equity market. Although its industry and constituent composition evolves over time, the index has maintained a dominant global presence in several sectors. As of Sept. 30, 2026, Information Technology (including Nvidia, Apple and Microsoft) and Communication Services (including Alphabet, Meta and Netflix) represented 39.7% and 9.9% of the S&P 500, respectively. S&P 500 constituents in these sectors accounted for 55.7% and 73.4% of their respective global equity market capitalization, as represented by the S&P Global Broad Market Index (BMI). The S&P 500’s Real Estate, Energy and Health Care sectors also accounted for more than 50% of their respective global market capitalization.

The S&P 500 & HKEX Tech 100 Index: Sector Diversification in a 62/38 Blend

The S&P 500 & HKEX Tech 100 Index brings together two distinct equity markets with relatively low historical correlation in a single benchmark. The S&P 500 aligns with the tech-oriented growth theme via sectors such as Information Technology, Communication Services and Consumer Discretionary (which includes Amazon and Tesla). It also provides meaningful representation of traditionally non-tech sectors such as Financials, Industrials, Energy and Consumer Staples. The broader sector coverage complements the targeted technology and innovation approach of the HKEX Tech 100 Index.

By pairing broad representation of large- and mid-cap technology companies listed in Hong Kong and eligible for Southbound Stock Connect with U.S. large-cap equities, the S&P 500 & HKEX Tech 100 Index is more diversified while maintaining a meaningful focus on tech-driven growth.

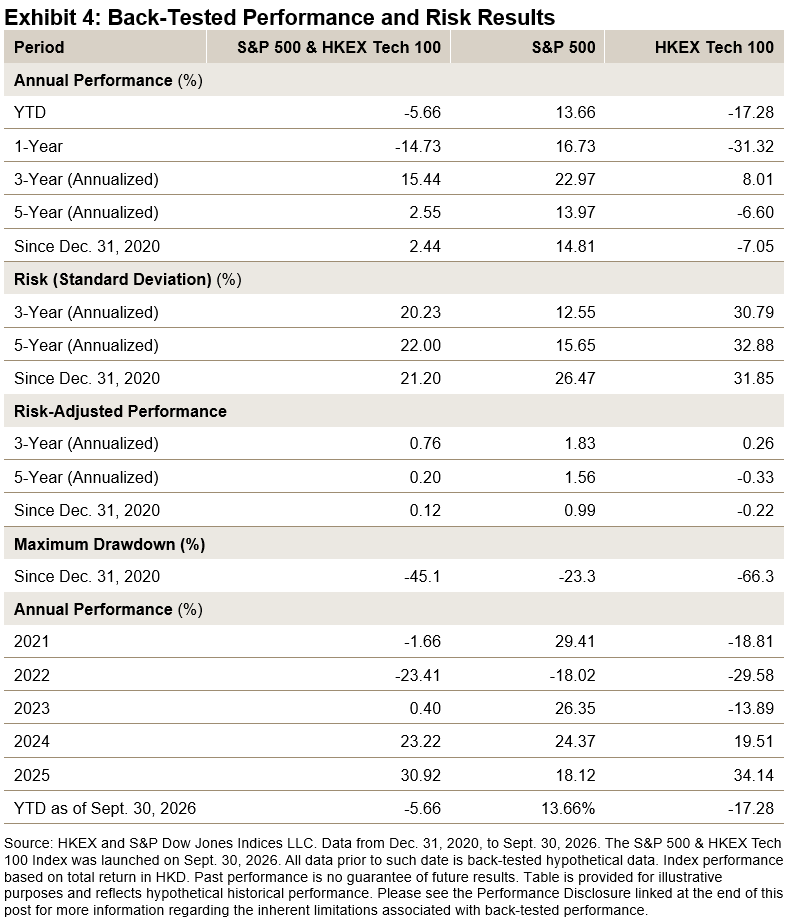
The three-year historical correlation between the S&P 500 and the HKEX Tech 100 Index averaged below 0.20, based on monthly performance. This relatively low correlation suggests that the two markets have historically responded to different performance drivers and have experienced differing market cycles.

Combining the S&P 500 with the HKEX Tech 100 Index reduced volatility and drawdowns relative to the standalone HKEX Tech 100 Index. Over the back-tested period from Dec. 31, 2020, to Sept. 30, 2026, the blended index showed a materially lower maximum drawdown and lower longer-term volatility.

Conclusion

The S&P 500 & HKEX Tech 100 Index brings together two complementary market segments within a single benchmark. It combines Hong Kong-listed technology and innovation companies with the broader sector coverage and scale of the U.S. large-cap market.

The low historical correlation between the two underlying indices underscores the potential diversification of the 62/38 weighting, which historically reduced volatility while retaining a meaningful focus on technology-driven growth. With quarterly rebalancing, Southbound ETF Connect eligibility and calculation in both HKD and USD, the index is a versatile benchmark for tracking the next wave of technology-driven growth across multiple sectors in China and abroad.

1 S&P Dow Jones Indices Annual Survey of Assets, Dec. 31, 2025.

The posts on this blog are opinions, not advice. Please read our Disclaimers.
Introducing the S&P Kaiko Digital Asset Indices

Contributor Image
Sherifa Issifu

Associate Director, Global Exchanges

S&P Dow Jones Indices

Combining Institutional and Crypto-Native Indexing Expertise

2026 has marked a significant milestone for S&P Dow Jones Indices (S&P DJI) in digital asset markets. In early September, S&P DJI announced the integration of the S&P Digital Asset Indices with Kaiko’s Digital Asset Indices1 into a unified framework.

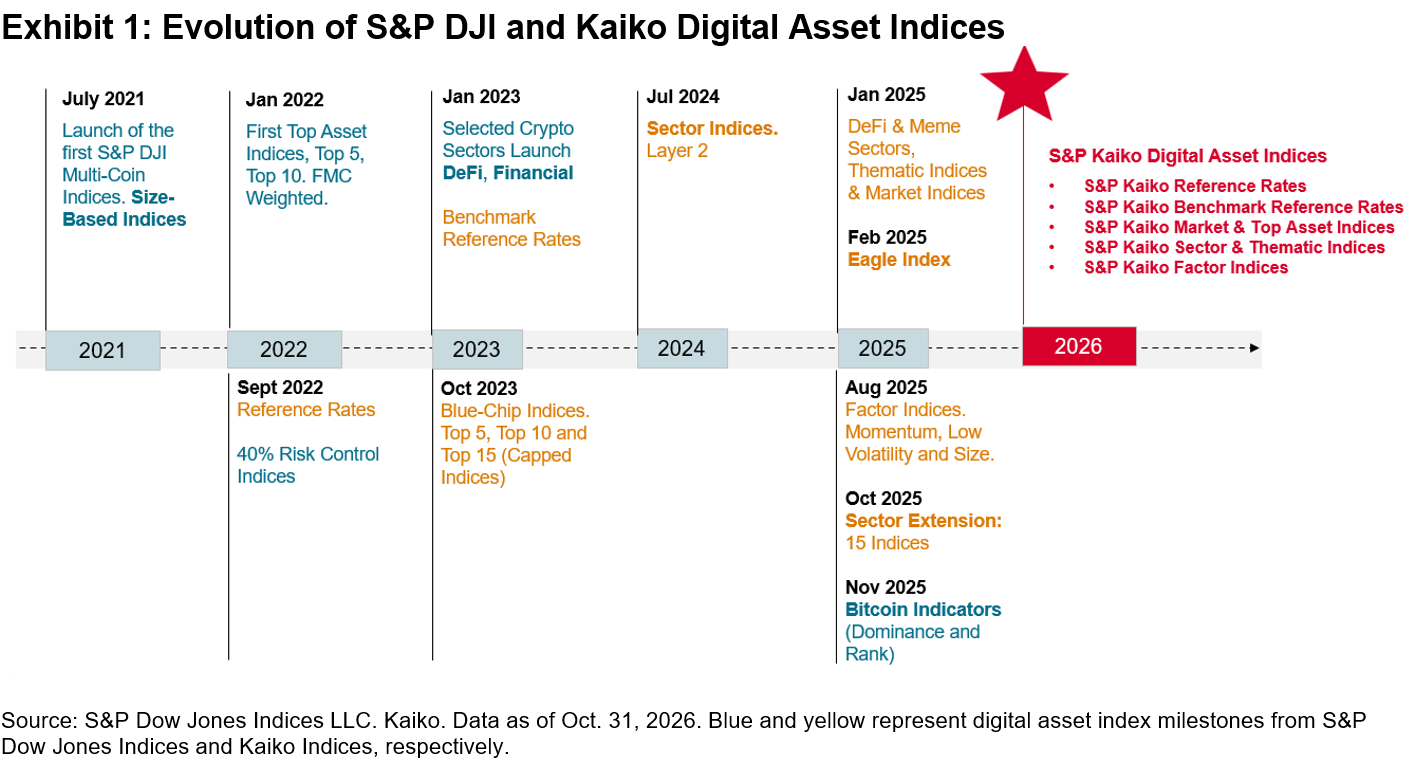
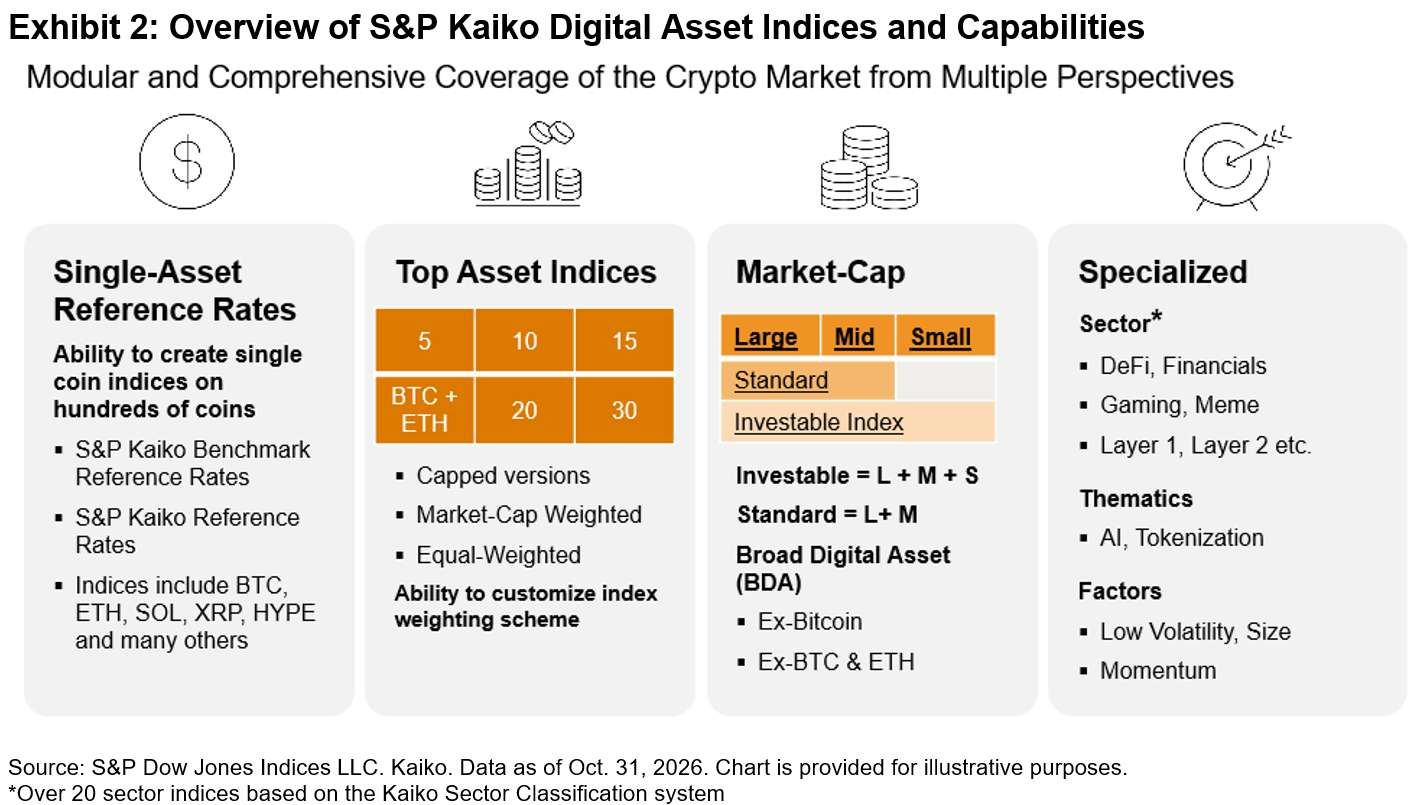
Exhibit 1 demonstrates the multi-year commitment of S&P DJI and Kaiko to crypto indexing, including the development of indices across various market segments, from single-asset indices to multi-coin basket strategies, as well as specialized segment indices by sector and factor. Crypto indexing is evolving in a manner similar to traditional indexing in other asset classes, providing a comprehensive set of building blocks for reflecting different market views.

Single-Coin/Asset Indices

As of October 2026, the S&P Kaiko Digital Asset Indices offer two types of single-coin reference rates: S&P Kaiko Single-Asset Reference Rates (RFR) and S&P Kaiko Single-Asset Benchmark Reference Rates (BRR). The standard reference rates use a minimum of one vetted exchange in the calculation of prices, while the benchmark reference rates require a minimum of three vetted exchanges used in the price calculation. These options address varying levels of rigor needed by index users. Exchange-traded funds and traditional futures typically require higher pricing rigor, which may limit the number of eligible assets and result in pricing differences. Standard reference rates provide continuous pricing and are primarily used for perpetuals and other crypto-native product wrappers.

Similar to traditional indexing, there is an increased need for customization in crypto indices, including selection of exchanges, currency pairs (fiat versus stablecoins such as USDC and USDT), calculation window, lookback period and calculation frequency. These customizations allow reference rates to align with client requirements.

Size-Based Indices: Top Assets and Market Cap

In the multi-coin space, the S&P Kaiko Digital Asset Indices offer indices for both index-linked products and active managers seeking to outperform benchmarks. The S&P Cryptocurrency Broad Digital Asset (BDA) Index2 and investable indices are segmented by the largest 5, 10, 15, 20 or 30 assets. In addition to the top asset indices, the series includes a range of indices that exclude the largest assets such as Bitcoin (BTC) and Ethereum (ETH) with a focus on “altcoins.” The S&P Kaiko Digital Asset Indices are also offered in alternative weighting schemes such as equal weighting, capped percentages (e.g., 30% or 35%) or dual capping to mitigate concentration in single assets.

Specialized Indices: Sectors, Thematics and Factors

Specialized multi-coin indices are offered in recognition that cryptocurrencies serve different use cases and may exhibit distinct performance characteristics. For example, the DeFi and Financials sectors may perform differently from the Gaming sector. Kaiko’s sector classifications, similar to GICS®, follow a one-to-one mapping. Thematic strategies group indices by themes such as tokenization and AI. Factor indices include price-based factors and crypto-native fundamentals, such as low volatility, momentum and size. Notably, the momentum factor in crypto turns over faster, requiring monthly rebalancing instead of the standard quarterly schedule to reflect changing market dynamics.

Because crypto trades continuously (24/7), without a natural end-of-day, assessments for exchange-traded products need to align with regional market conventions. The combined capabilities of S&P DJI and Kaiko support the needs of both traditional and crypto-native clients. All indices are available in four versions: APAC (16:00 Singapore), EMEA (16:00 London), Americas (16:00 New York) and real-time, providing global coverage with the ability to customize to alternative times and currencies.

Conclusion

S&P DJI offers comprehensive index solutions across asset classes. In collaboration with Kaiko, the S&P Kaiko Digital Asset Indices apply institutional standards to digital assets. For more information, please see our brochure, press release and investment theme page.

1 S&P Dow Jones Indices and Kaiko Introduce S&P Kaiko Digital Asset Indices, Sept. 1, 2026.

2 To be renamed S&P Kaiko Broad Digital Asset Index from Dec. 18, 2026.

The posts on this blog are opinions, not advice. Please read our Disclaimers.