The S&P 500®, the S&P MidCap 400® and the S&P SmallCap 600® measure the performance of the large-, mid- and small-cap segments of the U.S. equity market, respectively. When considered together, they provide broad coverage of the U.S. equity market; however, each index represents a distinct segment with a unique constituent profile, sector composition and risk/performance characteristics.
Large caps typically offer scale and global reach, small caps can be associated with earlier-stage company growth and mid caps tend to occupy the space in between. Often overlooked, mid-cap companies can be established enough to offer operating scale and access to capital, yet still early enough in development for growth to matter.1
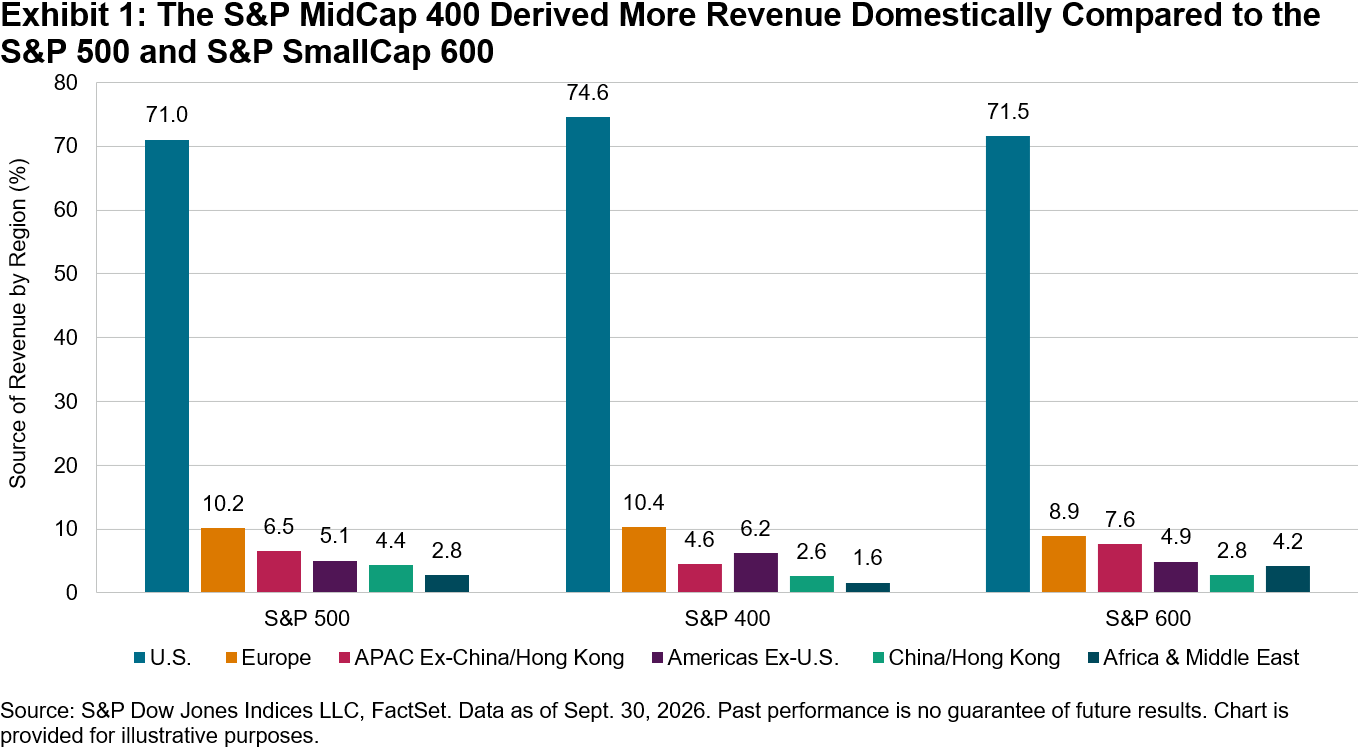
One example of how differing constituent profiles can translate into distinct characteristics is geographic revenue. Exhibit 1 shows the revenue breakdown by geography for the S&P 500, S&P 400® and S&P 600® as of the end of September 2026. On a sales-weighted basis, the S&P 400 had the highest domestic revenue exposure of the three indices, with 74.6% sourced from the U.S., compared with 71.0% and 71.5% for the S&P 500 and S&P 600, respectively. This higher domestic revenue exposure reflects, in part, the S&P MidCap 400’s sector composition, with relatively greater weights in more domestically oriented sectors such as Industrials and Real Estate.2
Differences in index characteristics can be informative when market attention shifts between global and domestic drivers. One historical lens through which to examine this dynamic may be the U.S. mid-term elections, which are held every four years, midway through a presidential term.3 Mid-term elections can coincide with a shift from pre-election uncertainty toward changing expectations for domestic policy and the U.S. economic outlook.
Exhibit 2 compares the performance of the S&P MidCap 400 with that of the S&P 500 and S&P SmallCap 600 over the six-month period before and after each of the five U.S. mid-term elections since 2006.
The S&P 400 outperformed the S&P 500 in four of the past five six-month periods following the mid-term elections. The mid-cap benchmark also outperformed the S&P SmallCap 600 in three of these periods. Across the five election cycles examined, the post-election performance ranged from 1.8% to 21.3% for the S&P 400, compared with -3.4% to 20.5% for the S&P 600 and 6.2% to 15.2% for the S&P 500. While the magnitude of performance varied from one cycle to the next, mid caps were strong performers in most of the post-election windows examined. While the drivers of performance varied across market cycles, these results highlight how differences in constituent profile, sector composition and economic sensitivity can contribute to distinct outcomes across market-cap segments.
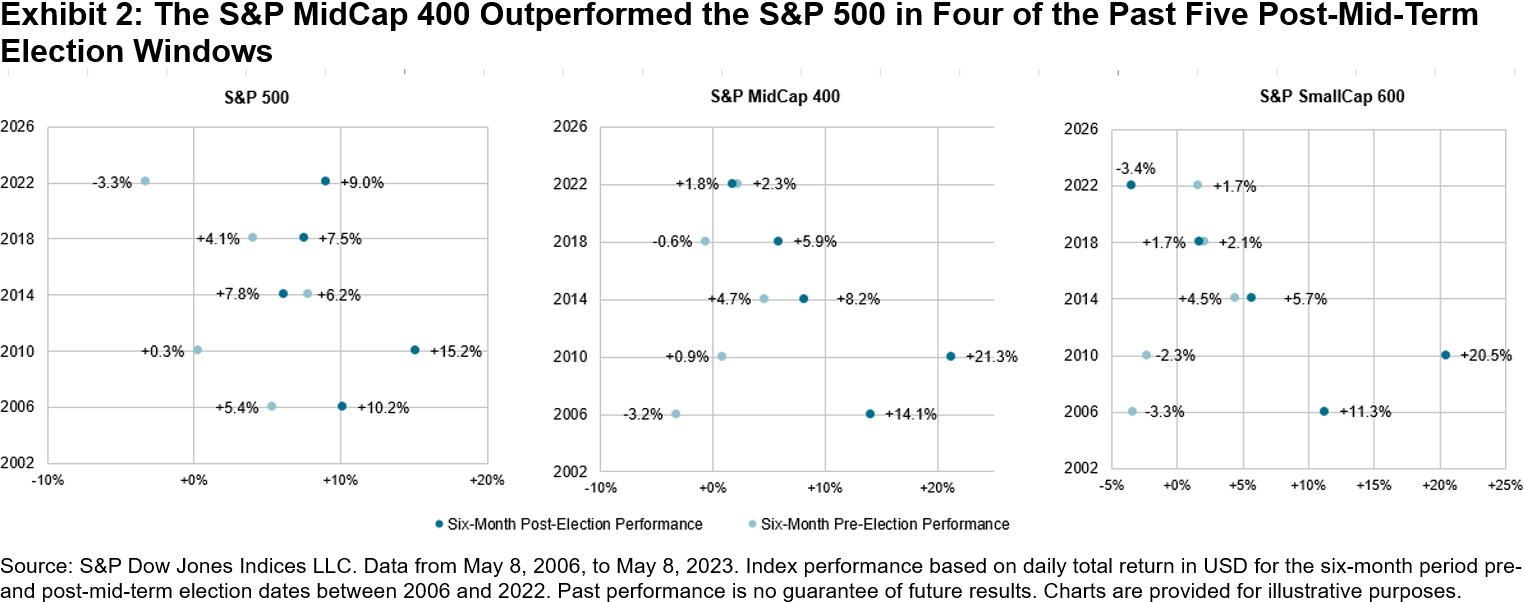
More notably, perhaps, Exhibit 2 also shows the change in performance on either side of the election date. In four of the five cycles, mid caps posted stronger performance in the six months following the election than in the six months prior. The improvement ranged from 3.5% in 2014, to more than 20% in both 2006 and 2010, with 2022 representing the only exception. Although stronger post-election performance was also observed in four and three of the five cycles for the large and small caps, respectively, the increase between the pre- and post-election periods was the largest for the S&P MidCap 400.
Applying the same analysis to equivalent dates in non-election years4 showed a weaker relationship between pre- and post-period performance, suggesting that the historical post-mid-term pattern may not be explained by calendar timing alone. One possible explanation is that market participants may have historicaly reasessed the domestic outlook more positively following mid-term elections.
Conclusion
Historical index performance around mid-term elections provides one example of how the distinct characteristics of the S&P MidCap 400 have translated into different outcomes from its large- and small-cap counterparts. While these observations do not establish a persistent relationship, they illustrate how differences in constituent profile, sector composition and economic sensitivity have impacted performance across market-cap segments. More broadly, these differing characteristics can reinforce the case for looking beyond large caps when considering the breadth of U.S. equities.
1 Explore these characteristics in greater detail in the S&P MidCap 400 Brochure.
For further reading, see Bellucci, Louis and Hamish Preston, “The S&P MidCap 400: Outperformance and Potential Application,” S&P Dow Jones Indices, July 9, 2019.
2 For current detail on sector weights, see the S&P MidCap 400 webpage.
3 For a broader analysis on the relationship between election cycles and index performance, see Hyman, Lucas, “Ballots and Benchmarks: How Elections Shake Markets around the World,” S&P Dow Jones Indices, Aug. 31, 2026.
4 Analysis based on equivalent mid-term calendar dates in the following years: 2007, 2011, 2015, 2019 and 2023.
The posts on this blog are opinions, not advice. Please read our Disclaimers.