Indices are constructed from components brought together by methodology and the market. Unlike stocks in an equity index, the constituents in the S&P USD Select Leveraged Loan Index are retired or reweighed as new loans are issued and existing loans are paid down. As a result, loan vintages from different years are mixed within the index and its composition evolves over time to reflect changes in the underlying credit market.
To illustrate how a loan benchmark evolves, we will examine the markedly different economic environments of December 2020 and June 2026 through the lens of the index and see how it responded to such changes.
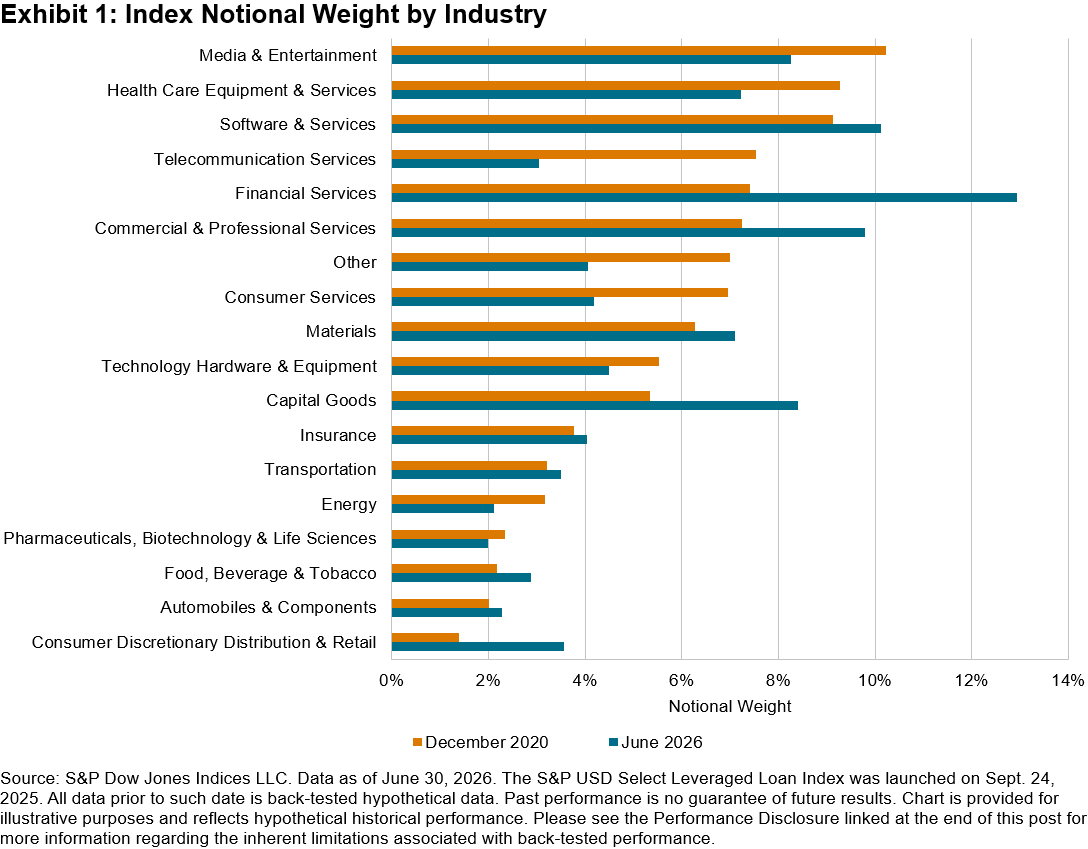
A helpful starting point is to assess industry concentration to see what types of companies are receiving public leveraged loans. Over this period, the S&P USD Select Leveraged Loan Index observed the largest relative shifts of weight into Financial Services and Capital Goods (see Exhibit 1). Both of these industries can be relatively capital intensive, so it is not surprising to see more loan volume flowing in to support these businesses.
Another metric to review is how the loans’ maturities have changed over time. In the 2020 data, the final legal maturity follows a normal, bell-shaped distribution, which could have been the result of borrowers choosing not to aggressively refinance and instead allowing loans to mature in a low interest rate environment (see Exhibit 2). In contrast, the current maturity wall of the index has been pushed further out (see Exhibit 3).
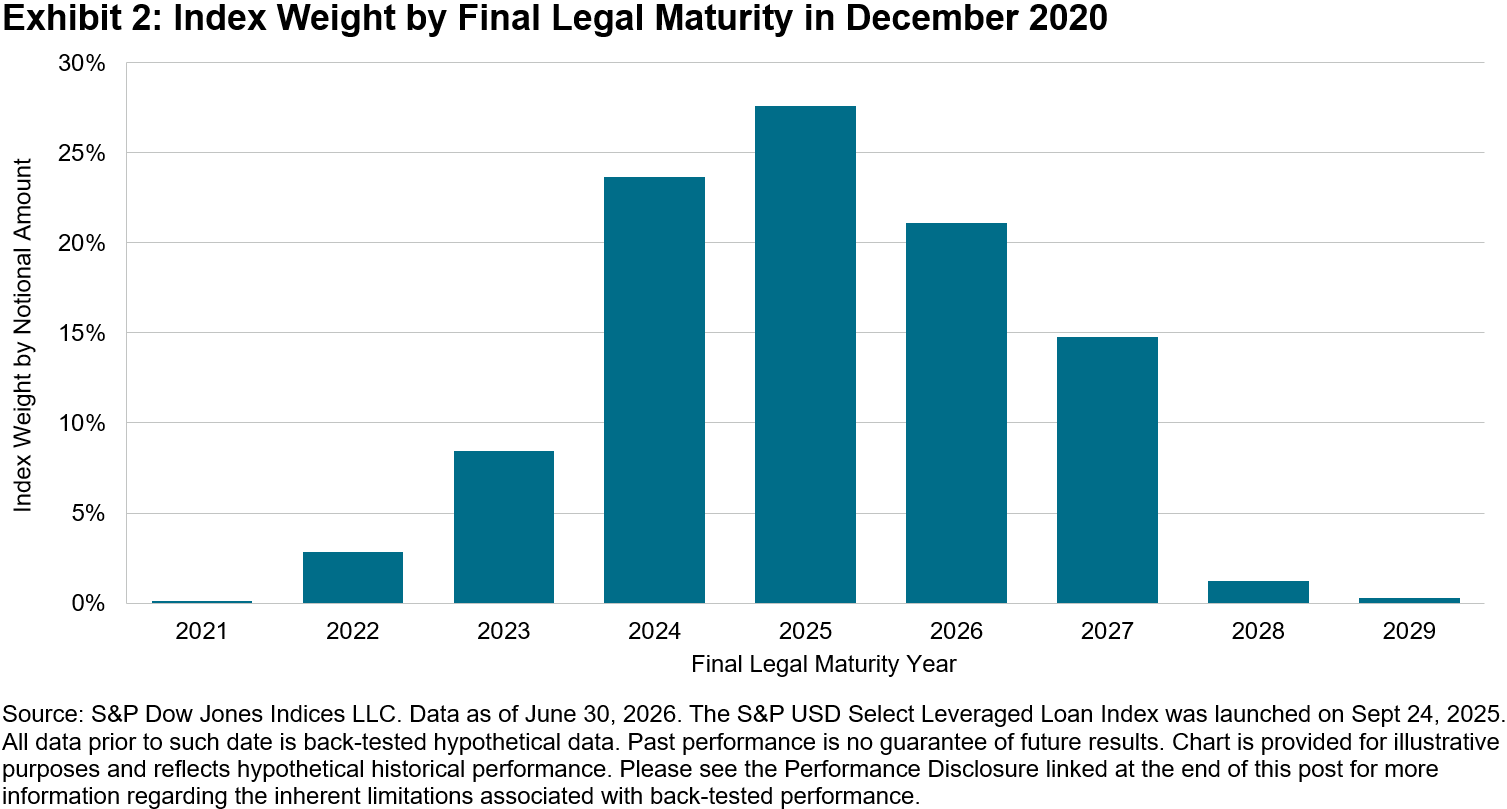
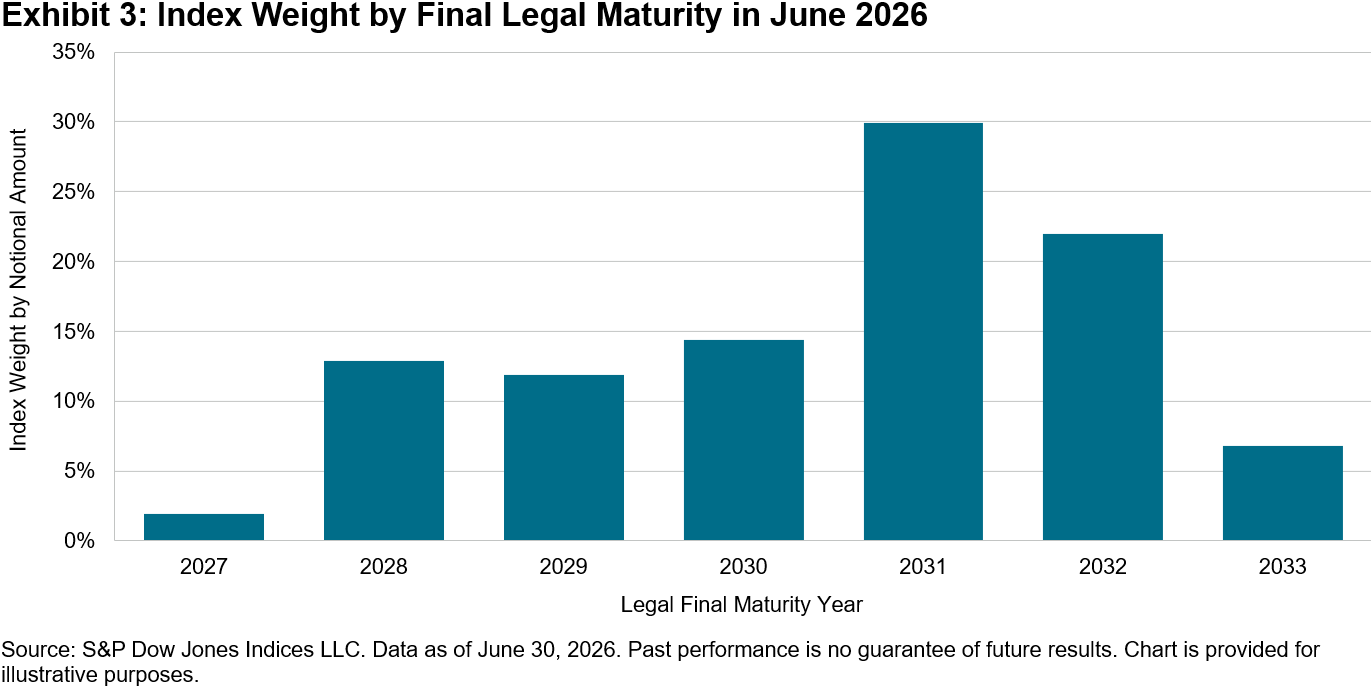
These shifts in maturity may indicate a market that is pushing refinancing and loan repayment out over a longer time horizon. This suggests market participants may be reflecting concerns that, in the short term, the U.S. may see additional rate hikes from the Federal Funds current target of 3.50%-3.75% to combat inflation and that borrowers may seek to avoid refinancing in this environment.
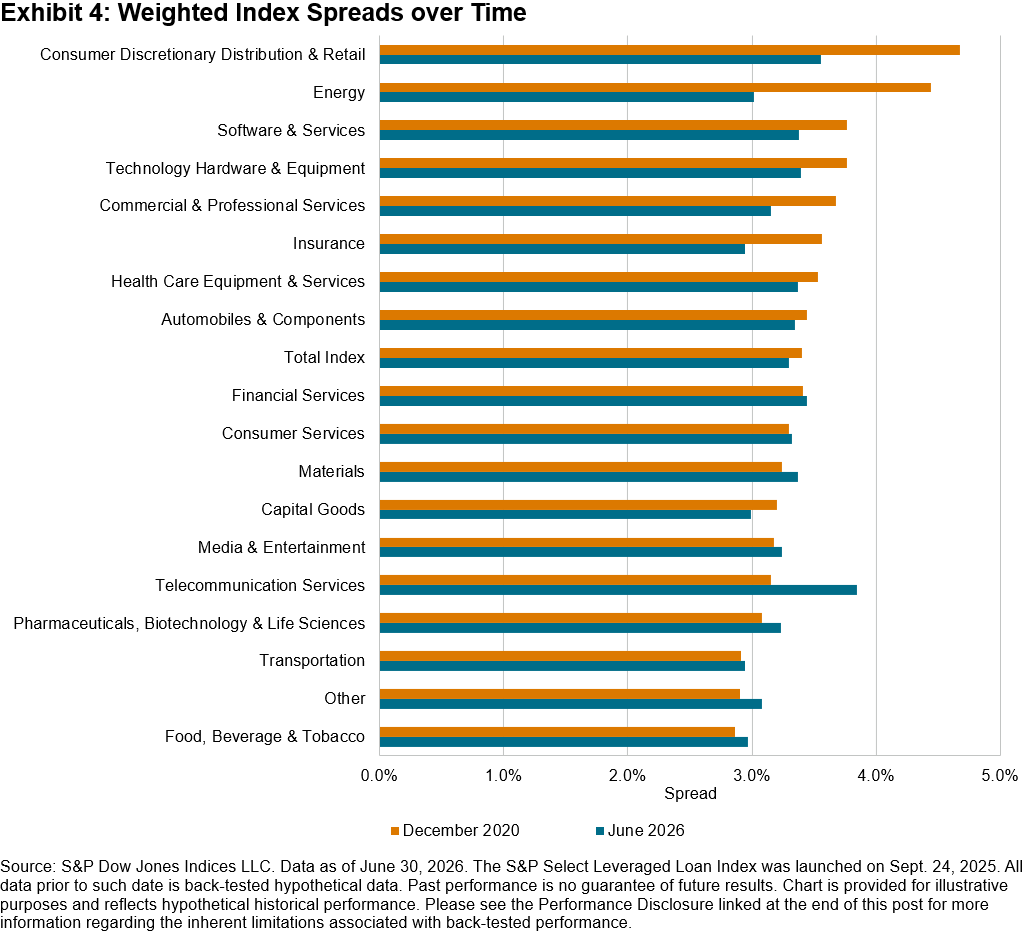
Despite differences in maturity and industry mix as well as the changing rate environment, spreads have not changed meaningfully over the period examined, which may be relevant to market participants seeking to deploy capital consistently and may help contextualize concerns about spread compression across the whole asset class (see Exhibit 4).
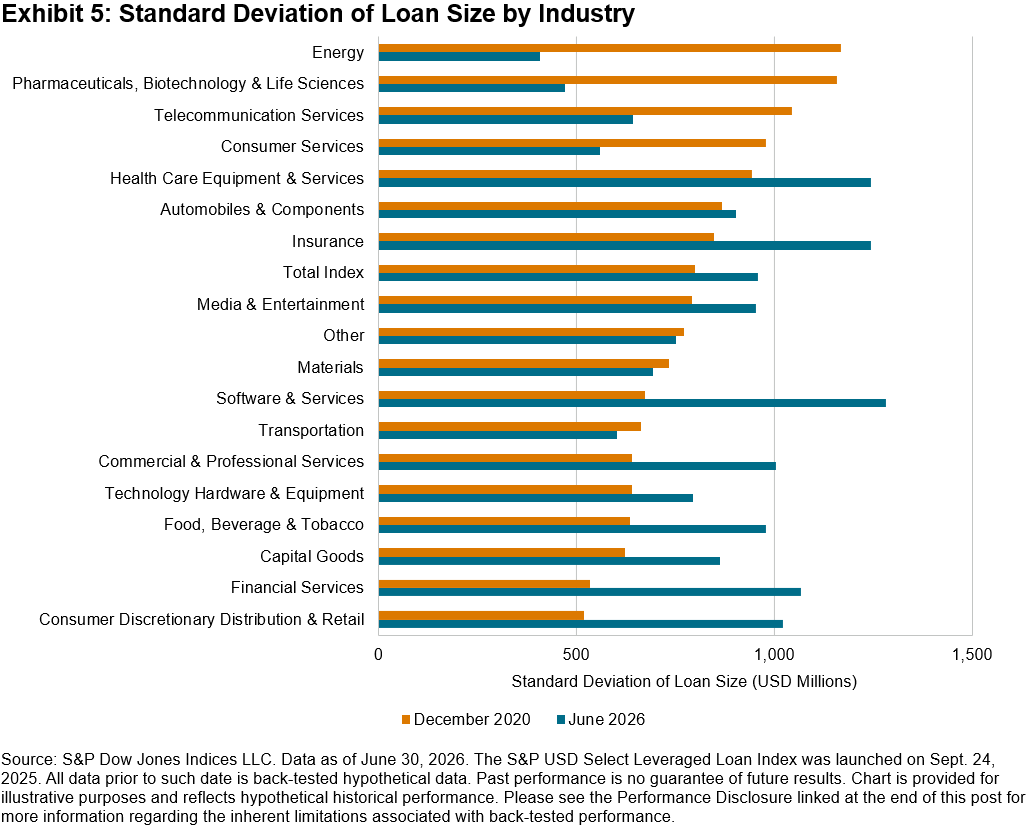
Lastly, while the distribution of index weight across industries is changing, the deviation in loan sizes across companies in the index can also be assessed to determine whether concentration risk is changing over time. In certain categories such as Software & Services, for example, there was a much higher standard deviation in June 2026 than in December 2020 (see Exhibit 5).
What can be derived from these exhibits is that while some characteristics of the index may change, others remained stable, showing how the asset class has evolved in response to changing economic conditions. Accordingly, the S&P USD Select Leveraged Loan Index continued to serve as a gauge of lending conditions and demonstrated stability across multiple dimensions.
This content may be AI-assisted and is composed, reviewed, edited, and approved by S&P Global.
The posts on this blog are opinions, not advice. Please read our Disclaimers.