Get Indexology® Blog updates via email.

In This List

An Alternative Approach to Autocall Indices

What SPIVA Measures: A New Zealand Perspective

Can South Korea Steal the Spotlight in Emerging Markets?

Tracking the African Sovereign Debt Market with the iBoxx LSF USD African Sovereigns Index

Private Credit Is Evolving, How Are Benchmarks Keeping Pace?

An Alternative Approach to Autocall Indices

Contributor Image
Parth Shah

Parth Shah, CFA, FRM

Director, Derivative Indices

We recently published the blog Indexing Autocalls, where we highlighted the continued investor demand for solutions that facilitate income generation—in particular, autocalls.

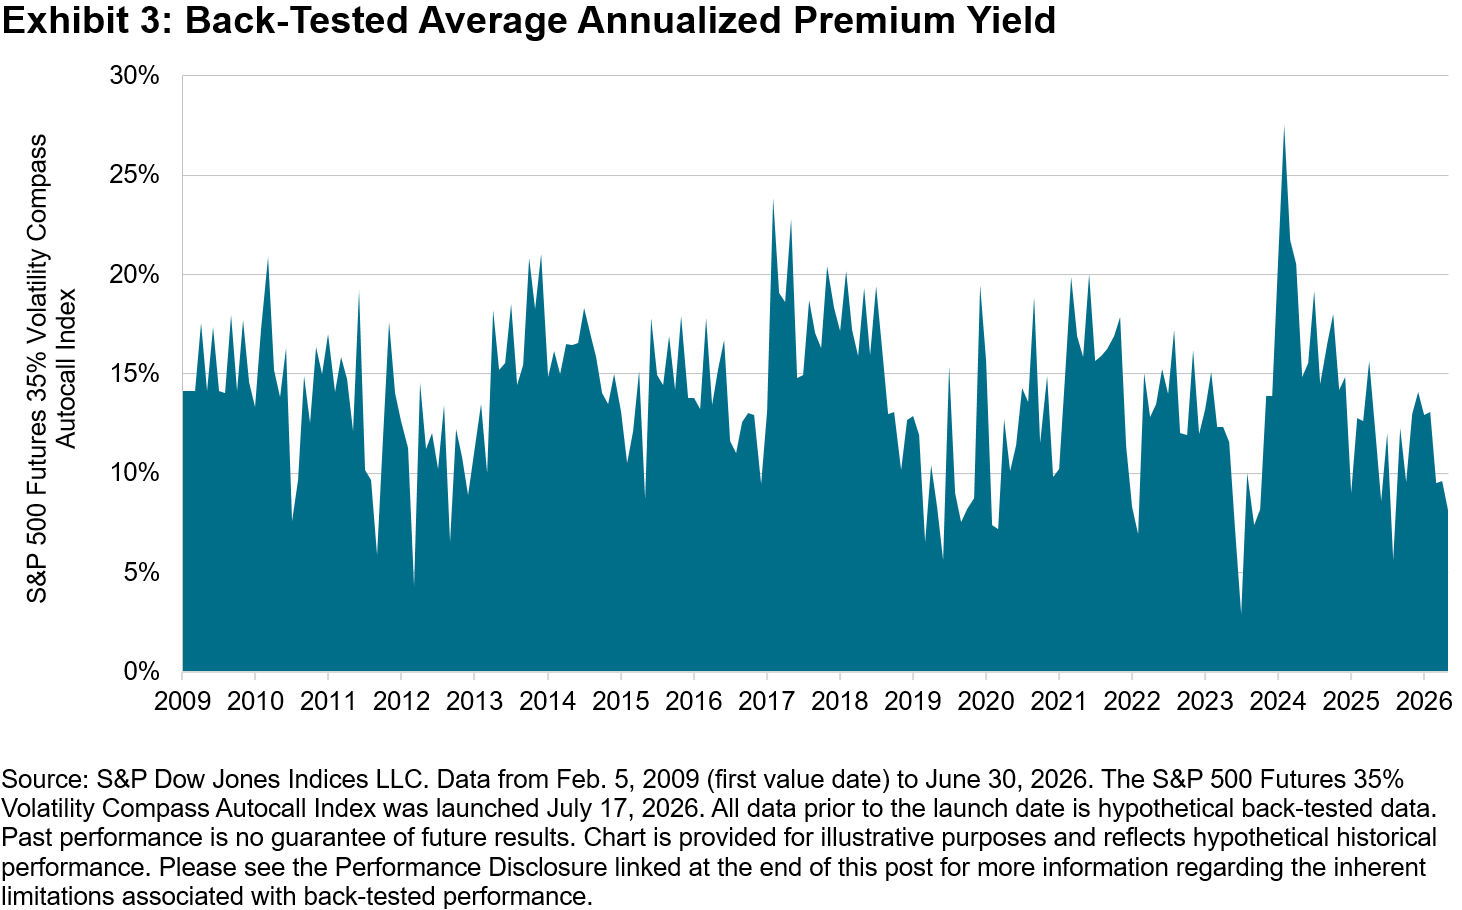
S&P Dow Jones Indices recently launched the S&P 500 Futures 35% Volatility Compass Autocall Index, which takes a unique approach to incorporating autocall features within an index framework. The index measures the performance of a continuously refreshing portfolio of hypothetical weekly issued put-barrier instruments on the S&P 500 Futures 35% Volatility Compass TCA 6% Decrement Index. Each instrument includes an autocall feature that allows for early redemption on a scheduled observation date if the index has recovered to, or exceeded, its level at issuance. In this way, the index seeks to generate hypothetical income through the premiums received from the issuance of new barrier instruments with an autocall feature, as opposed to fully replicating a hypothetical portfolio of autocall instruments.

Because an index is not an investment product, one cannot invest directly in an index but rather an investment product based on an index. As a result, descriptions of the index’s instruments and autocall features, for example, are hypothetical in nature.
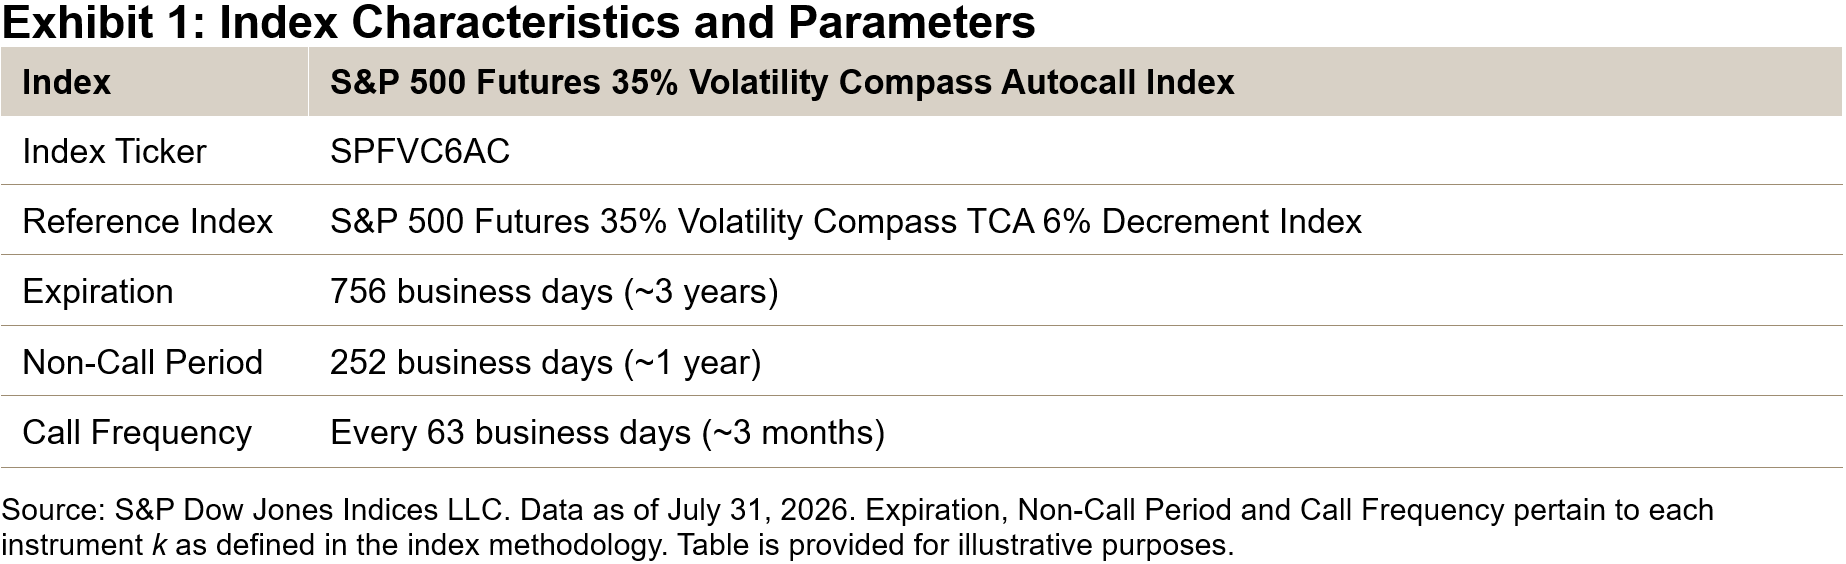
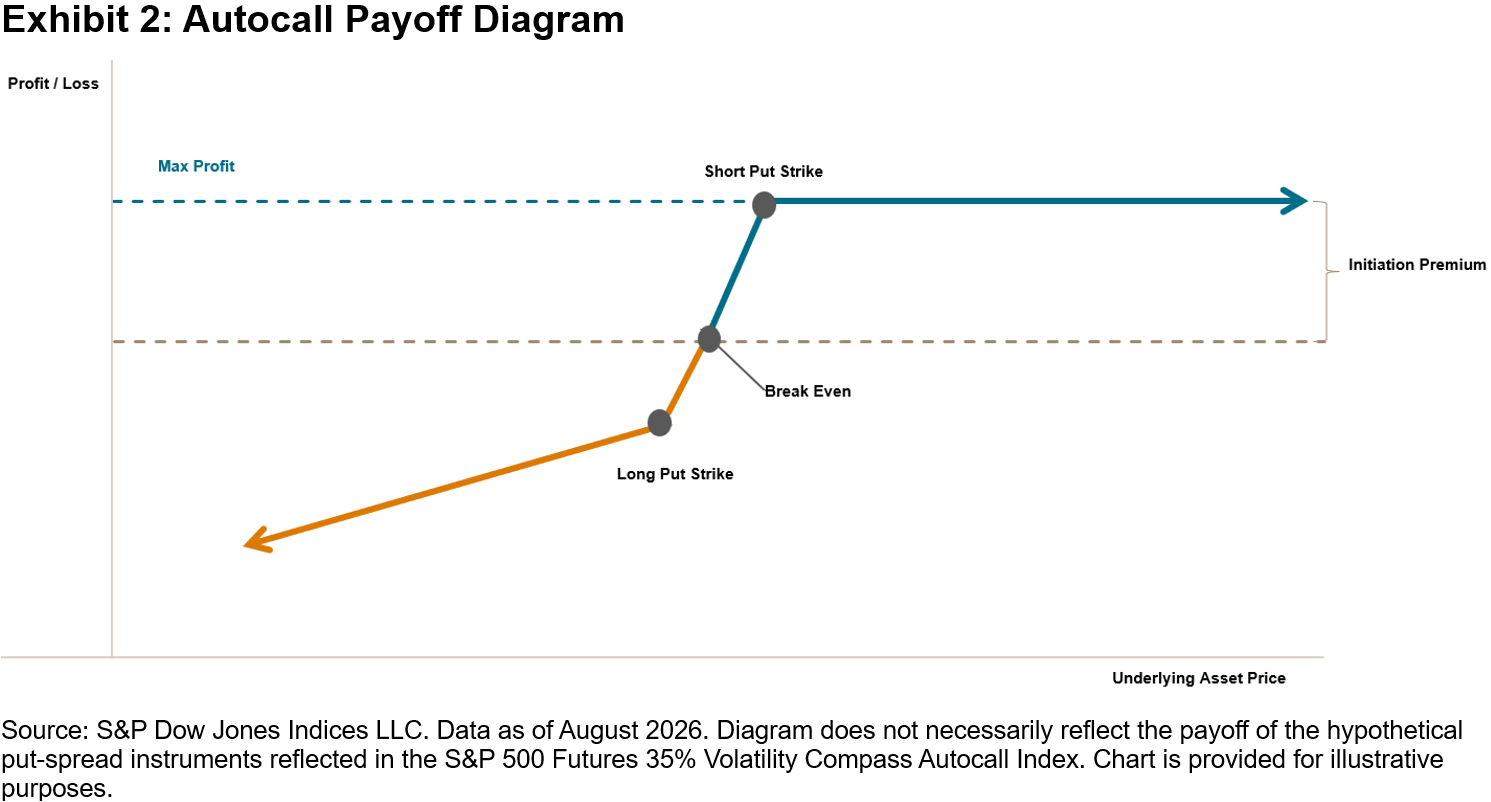
The S&P 500 Futures 35% Volatility Compass Autocall Index incorporates a laddered put-barrier structure designed to generate hypothetical income from option premiums. The put barrier is constructed using a short put struck at 65% of the initial index level and a long put struck at 63% of the initial index level to replicate the desired barrier payoff. By laddering issuances over time, the index seeks to reduce timing risk across varying market conditions. Overall, the structure seeks to provide limited downside and premium buffer protection, helping to mitigate moderate losses before the put-barrier level is reached.
Because the S&P 500 Futures 35% Volatility Compass Autocall Index features an autocall mechanism, when the underlying index recovers to its issuance level, the relevant instrument can be redeemed early at fair value, allowing the portfolio to refresh rather than remain locked into the same position until final maturity. Additionally, new put-barrier instruments are issued on a recurring basis, creating a different yield profile compared to static option strategies.
As investor demand for income strategies remains strong, S&P DJI is committed to bring to market indices that reflect varied approaches to hypothetical income generation to a broader set of market participants.

The posts on this blog are opinions, not advice. Please read our Disclaimers.

What SPIVA Measures: A New Zealand Perspective

Contributor Image
Sue Lee

APAC Head of Index Investment Strategy

S&P Dow Jones Indices

For more than two decades, the SPIVA® Scorecards have contributed to the active versus passive debate by measuring the performance of active funds against market benchmarks. Since the publication of the first SPIVA U.S. Scorecard in 2002, the methodology has been applied consistently across regions, asset classes and market cycles.1

Performance measurement can be approached from different perspectives. Before interpreting the results, it is therefore important to understand the question an analysis is designed to answer. SPIVA is designed to answer a specific question.

Of the actively managed funds available to an investor at the beginning of a period, what proportion survived and outperformed an appropriate market benchmark by the end of that period?

The methodology is designed around this objective and is applied consistently across markets and through time.

Different Questions Require Different Metrics

Not all investment strategies seek the same outcome. Active funds seek to outperform a benchmark, while passive funds seek to track a benchmark as closely as possible. The appropriate evaluation metrics therefore differ.

For active funds, a key question is whether the fund outperformed a relevant benchmark. For passive funds, the focus is typically on tracking difference and tracking error, which measure how closely a fund follows its benchmark. A passive fund that follows benchmark performance, less fees, would generally be considered to have fulfilled its objective. Applying an analytical framework designed for active funds to passive funds would therefore not address the objective that passive funds are designed to achieve.

Different approaches to evaluating active management can produce different perspectives. For example, one could focus on the average fund, the average invested dollar, surviving funds only or performance relative to a collection of investment products. Each approach may be informative, but each addresses a different question.

SPIVA focuses on active funds’ ability to outperform relative to benchmarks and applies that framework consistently across time periods and fund categories.

Benchmarks Matter

Benchmark selection is a critical part of performance measurement. A useful benchmark should represent the market opportunity set that a fund category intends to access and provide a consistent reference point for comparison across funds.

SPIVA begins with independently defined fund categories supplied by external fund-data vendors and then selects representative market benchmarks based on the characteristics of the category, the historical performance characteristics of its funds as a group and relevant market practices.

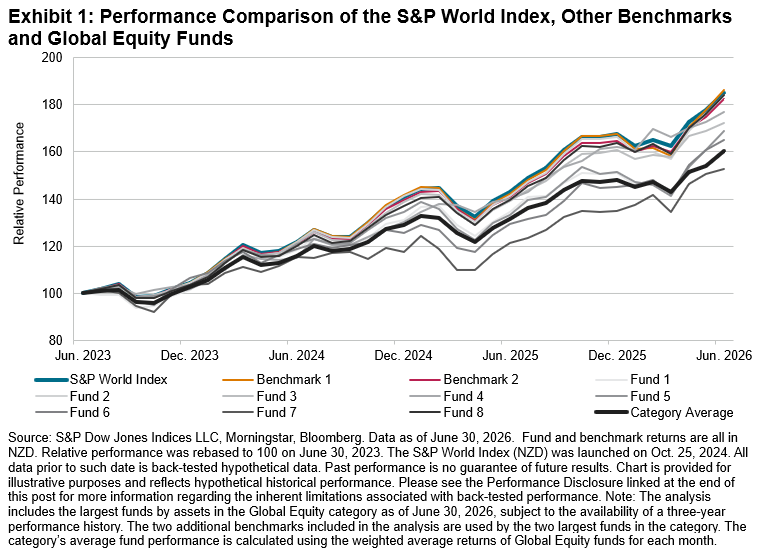
For example, the SPIVA New Zealand Scorecard uses the S&P World Index in NZD total return terms2 as the benchmark for Global Equity funds. As shown in Exhibit 1, the S&P World Index exhibited correlations of 0.99 to 1.00 with two widely used benchmarks in the category and a correlation of 0.97 with the category’s asset-weighted average return over the three years ending June 30, 2026. Longer-term correlations are in a similar range. These results support its use as a closely aligned and consistently applicable category benchmark.

Why SPIVA Starts with the Original Opportunity Set

Survivorship is an important consideration in long-term fund performance analysis. When investors select funds, they cannot know which will survive, merge or liquidate over the intended investment horizon. All funds available at the outset therefore form part of the investor’s opportunity set.

SPIVA evaluates performance using the original fund universe rather than limiting the analysis to funds that survive until the end of the period. This helps address survivorship bias and prevents the analysis from benefiting from hindsight. Excluding non-surviving funds would remove part of the opportunity set investors actually began with and could present an incomplete picture of their eventual outcomes.

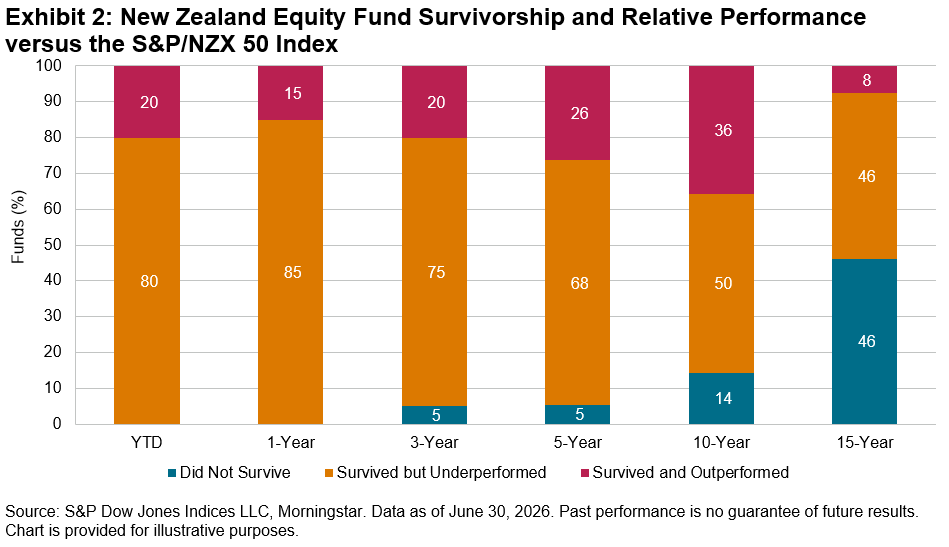
Exhibit 2 illustrates this effect using New Zealand Equity funds. Over the 15-year period ending June 30, 2026, 46% of the original fund universe did not survive, and only 8% both survived and outperformed. Among surviving funds alone, approximately 86% underperformed, compared with an overall underperformance rate of 92% when the original opportunity set was retained.

More than One Headline Number

SPIVA’s underperformance rate is often its most cited statistic, but it is only one part of the scorecard. SPIVA also reports equal-weighted and asset-weighted performance, survivorship statistics and quartile performance.

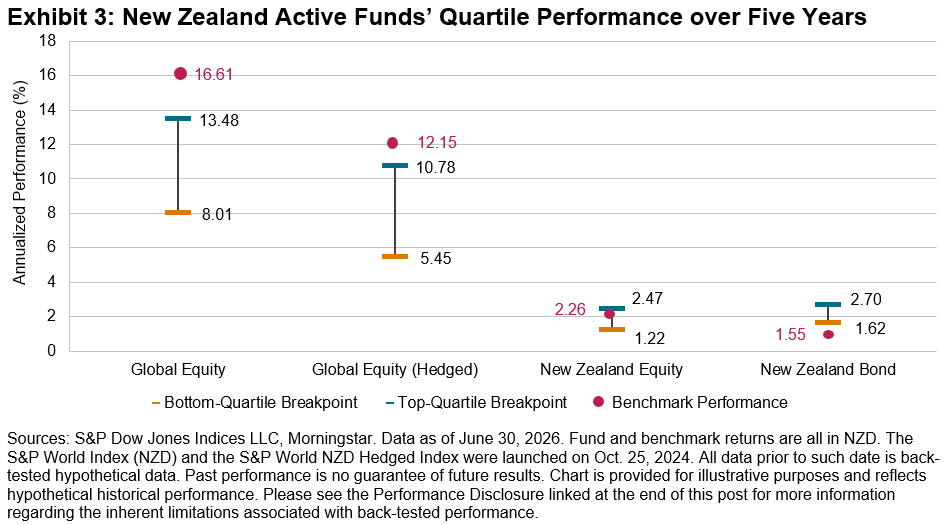
Exhibit 3 shows the range of outcomes among surviving funds over the five-year period ending June 30, 2026. In the Global Equity fund category, top- and bottom-quartile breakpoints were 13.5% and 8.0%, respectively, compared to 16.6% for the S&P World Index. For Global Equity (Hedged) funds, the corresponding breakpoints were 10.8% and 5.4%, compared with 12.2% for the S&P World NZD Hedged Index. The comparison illustrates both the dispersion of active fund outcomes and the potential influence of currency treatment on performance.

Conclusion

Different methodologies may arrive at different conclusions because they are designed to answer different questions. SPIVA provides a transparent and consistent framework for examining how frequently active funds have survived and outperformed an appropriate market benchmark. Understanding the question being asked is the first step in interpreting the answer.


1 For more information and background on the SPIVA Scorecards, please see SPIVA By the Numbers: A Global Perspective and What is SPIVA?

2 The S&P World Index was launched on Feb. 13, 2009, while its NZD-denominated versions were launched on Oct. 25, 2024.

This content may be AI-assisted and is composed, reviewed, edited, and approved by S&P Global.

The posts on this blog are opinions, not advice. Please read our Disclaimers.
Can South Korea Steal the Spotlight in Emerging Markets?

Contributor Image
Diego Zurita

Senior Analyst, Global Equities & Thematics

S&P Dow Jones Indices

After political turmoil pushed it down in 2024,1 South Korea recovered and was the best-performing equity market globally in 2025 (as measured by the S&P Korea BMI), and it has continued to outperform as of August 2026 (up 78.7% YTD versus 14.8% for the S&P Global BMI). The performance of the stock market has fluctuated over the years, but one debate has remained constant: South Korea’s market classification. Whether South Korea is classified as a developed market or an emerging market can materially affect country weights in an index. A 2020 Indexology® Blog post2 explored how the inclusion of South Korea in emerging market indices could crowd out less-developed countries. Six years later, what has changed?

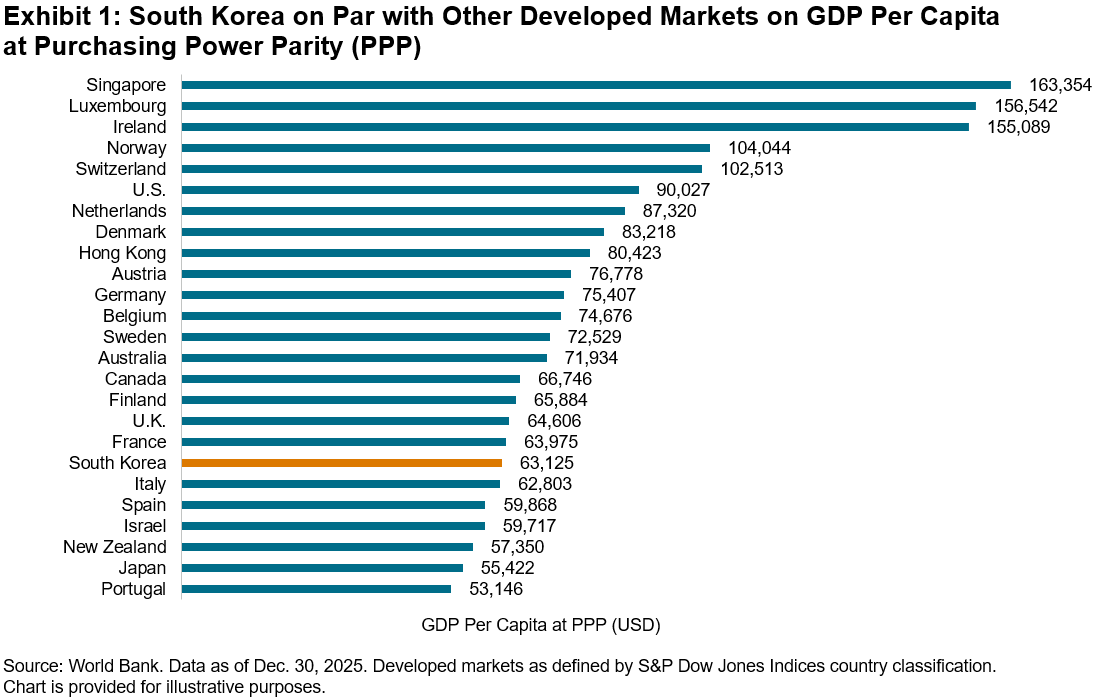
To answer that, it helps to revisit South Korea’s classification. Since 2001, S&P Dow Jones Indices (S&P DJI) has classified South Korea as a developed market, a decision reaffirmed over the years based on feedback from a wide range of market participants. Since 2020, the South Korean economy has remained healthy, with GDP growing an average of 2.3% annually3 and its GDP per capita holding steady alongside the levels of other developed markets (see Exhibit 1).

Consistent with this, the float-adjusted market capitalization (FMC) of the S&P Korea BMI went from USD 0.91 trillion on Dec. 31, 2024, to USD 2.98 trillion as of Aug. 31, 2026. Even as the amount of foreign capital entering the stock market has grown,4 the government has released a series of reforms aimed at further enhancing its accessibility and liquidity.5, 6, 7 Still, not all index providers share the same classification perspective, reflecting different market expectation frameworks. Let’s look at how South Korea’s inclusion impacts the composition of indices.

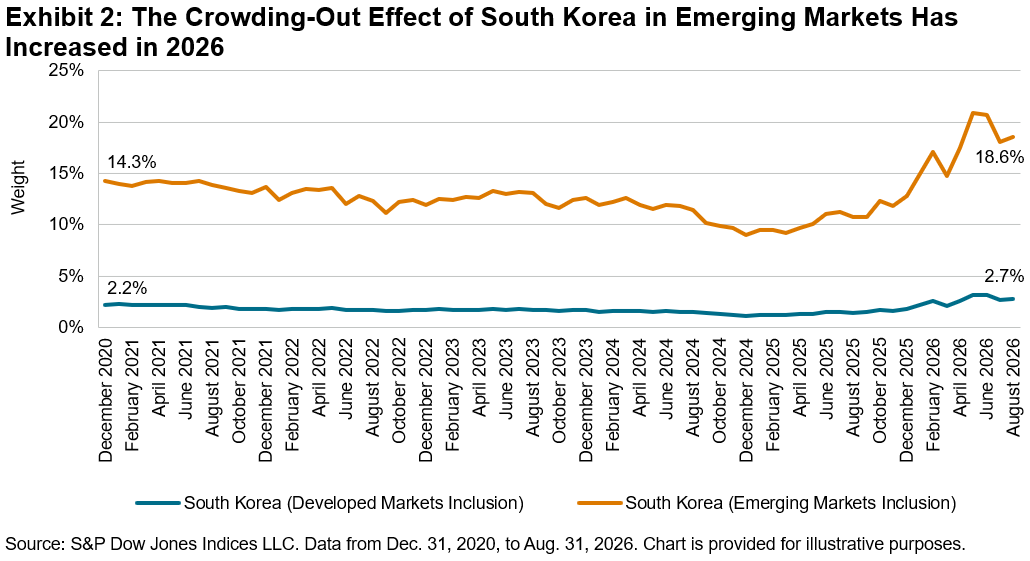
Amid the outperformance of South Korean equities, the market’s footprint on global benchmarks has increased. As of the end of August 2026, South Korea represented 2.7% of the total FMC of the S&P Developed BMI, up from 2.2% in December 2020. However, its weight has grown even more sharply when placing it within an emerging market classification. In the S&P Emerging Plus AllCap Index, which includes South Korea, the country’s weight went from 14.3% to 18.6% over the same period. As South Korea’s weight has increased, so has its crowding-out effect (see Exhibit 2). When including South Korea in emerging market indices, weight in other less-developed countries is reduced.

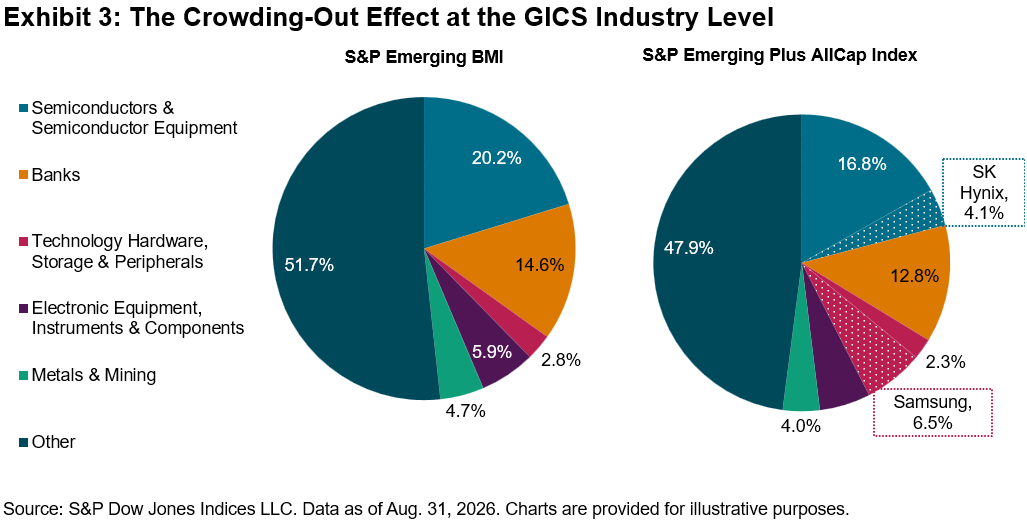
The soaring of South Korean equities can mainly be attributed to the hardware and semiconductor industries, which have outperformed in the country amid growing interest in companies central to the AI revolution.8 From December 2024 to August 2026, the S&P Korea BMI had a cumulative performance of 341.2%, with the main contributors to performance being Samsung (388.7%), from the Technology Hardware, Storage & Peripherals GICS® industry, and SK Hynix (862.7%), classified under the Semiconductors & Semiconductor Equipment GICS industry,. While the crowding-out effect of the semiconductors industry has remained modest at less than 1.0%, the impact has been more pronounced in the hardware industry, where the weight jumped from 2.8% to 8.8% when South Korea is included, largely due to Samsung’s dominant presence (see Exhibit 3). When South Korea was included in emerging market indices, Samsung and SK Hynix crowded out other industries.

Recent developments in the South Korean stock market and economy are consistent with S&P DJI’s developed market classification. Its inclusion in emerging market indices, however, has shown the potential to crowd out weights in less-developed countries and certain industries. S&P DJI offers indices that reflect a range of different perspectives, providing alternative lenses through which global equity markets can be viewed and measured.

1 River Akira Davis and Jason Karaian, “South Korea’s Already Shaky Markets Further Rattled by Political Turmoil,” The New York Times, Dec. 3, 2025.

2 John Welling, “Is South Korea Crowding Your Emerging Markets Allocation?” S&P Dow Jones Indices LLC, Nov. 23, 2020.

3 World Bank, GDP Growth, Republic of Korea.

4Foreign ownership of S. Korean stocks reaches highest in nearly 6 years,” The Korea Herald, Jan. 25, 2026.

5 Cynthia Kim, “South Korea starts 24-hour trading of dollar-won,” Reuters, July 5, 2026.

6 Ying-Shan Lee, “South Korea ends its longest short-selling ban after systemic reforms,” CNBC, March 30, 2025.

7 Heejin Kim and Jihoon Lee, “S. Korean President Lee vows more stock market reforms, triggering share rally,” Reuters, March 18, 2026.

8 Nick Didio, “Choppy Chips,” S&P Dow Jones Indices LLC, July 16, 2026.

The posts on this blog are opinions, not advice. Please read our Disclaimers.
Tracking the African Sovereign Debt Market with the iBoxx LSF USD African Sovereigns Index

Explore the structural forces shaping African sovereign debt markets and how they differ from their LatAm and APAC peers. 

The posts on this blog are opinions, not advice. Please read our Disclaimers.

Private Credit Is Evolving, How Are Benchmarks Keeping Pace?

Contributor Image
Ari Rajendra

Head of Private Markets Indices

S&P Dow Jones Indices

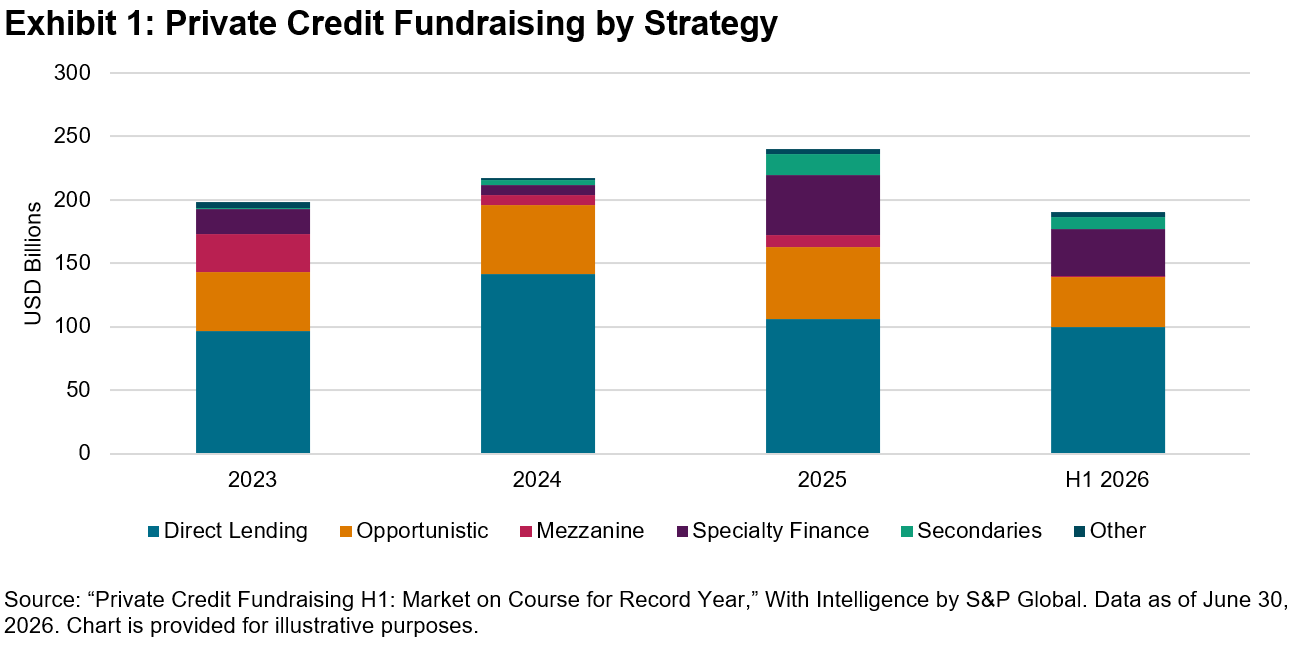
Private credit has become one of the fastest-growing asset classes within global capital markets. In the first half of 2026 alone, private credit fundraising reached USD 190 billion, which is on pace to surpass the 2025 full-year total of USD 240 billion (see Exhibit 1).1 Direct lending has driven much of private credit’s growth, having multiplied roughly sixfold between 2016 and 2024.2 It is now the largest segment within private credit and an increasingly important source of financing for middle-market companies in the U.S. and Europe.

However, the rapid growth of private credit has prompted increased scrutiny, reflecting concerns about the asset class’s inherent opacity, volatility and valuation uncertainty. These concerns have been reinforced by recent headlines focusing on valuation practices, liquidity risk, redemption pressures and credit quality. As private credit continues to grow in scale and significance, market participants looking to understand and measure these changing dynamics need transparent and trusted benchmarks, but are often limited by lagged, manager-reported fund-level data. So, how can benchmarks keep pace and offer market participants the insights needed to effectively monitor this fast-evolving space?

Going Beyond Headline Performance

Private credit benchmarks have existed for years, but many are built on fund-level performance rather than on the underlying loans. This has created an incomplete picture of risk and volatility. Unlike public credit benchmarks that are supported by more timely and readily available data sources, reporting practices, data availability and calculation standards vary across private credit managers. The result is often a fragmented view of the market that makes constituents harder to compare and private credit more difficult to assess alongside public markets.

Closing this benchmarking gap requires richer fund- and asset-level data, along with a common framework for translating that information into standardized market measures comparable to those used in public markets. Frequent valuations and deeper data are also key for ensuring market participants have access to timelier information, which is particularly important during periods of market uncertainty when visibility becomes even more critical.

Loan-level data provides transparency into credit quality, yield, maturity profiles and portfolio concentrations across industries, seniority bands and borrower EBITDA segments. This information enables investors to better understand the underlying drivers of performance and identify evolving risks that top-line performance measures cannot.

Credible loan-level data, however, is only one part of the solution. The next generation of private credit benchmarks should combine asset-level information with consistent methodologies, trusted calculations and robust index governance. That combination creates a common reference point for evaluating performance and risk across managers, constituents and markets over time.

Building the Foundation for Better Measurement

Developing an enhanced benchmarking infrastructure increasingly requires collaboration across the private credit ecosystem. Many leading industry specialists have access to data that has historically been difficult to aggregate, while index providers contribute the methodology and governance needed to make it comparable. Together, these capabilities can help transform fragmented observations into reliable market benchmarks.

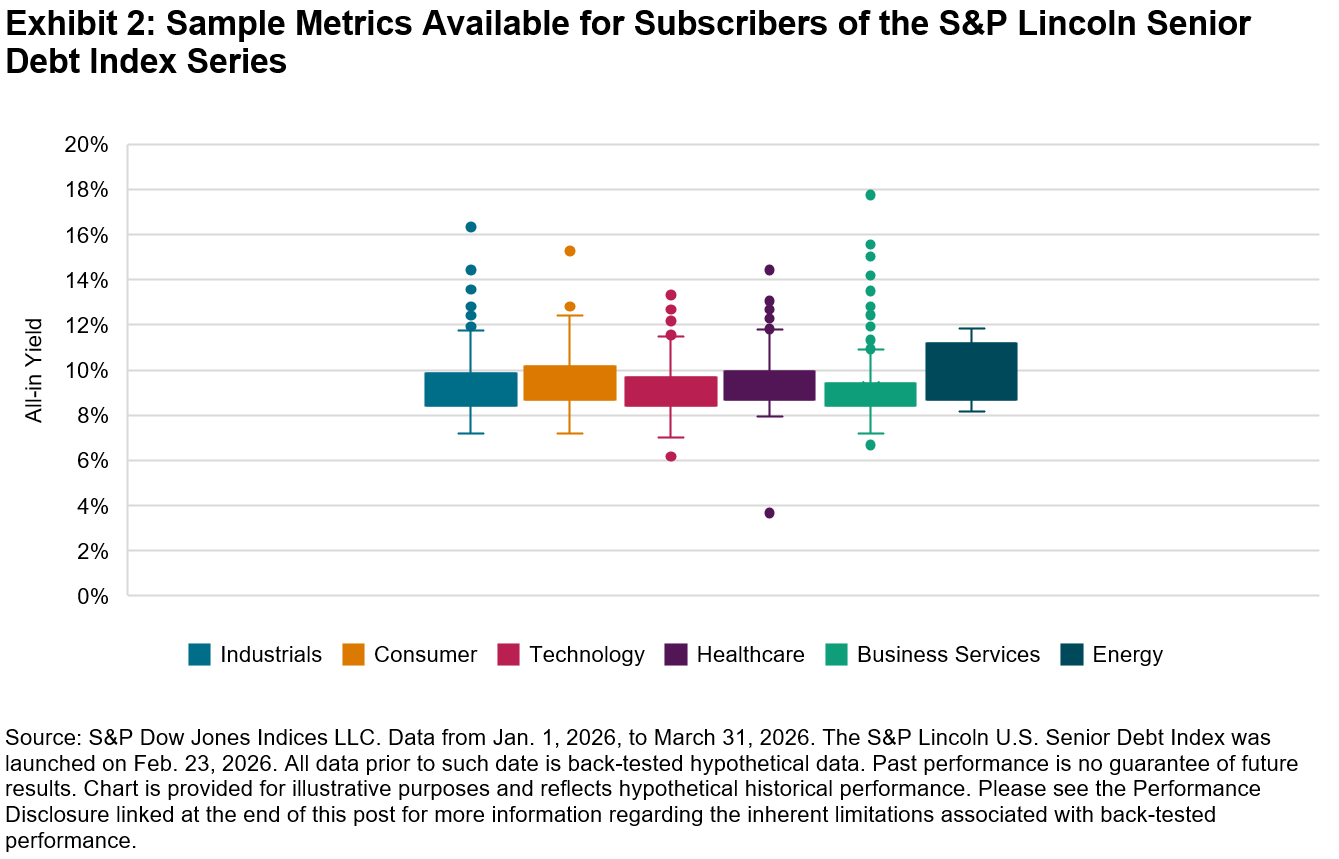
The S&P Lincoln Senior Debt Index Series, developed by S&P Dow Jones Indices (S&P DJI) in collaboration with Lincoln International, a global investment banking advisory firm, combines Lincoln’s private loan valuation data with S&P DJI’s transparent rules-based index methodology and governance framework. It measures illiquid senior debt facilities issued primarily to private-equity-sponsored companies in the U.S. and Europe, using granular loan-level insights to provide a systematic view of direct lending. This index series offers subscribers a rich set of credit metrics—including returns, fair value movements, yields, coupon spreads, leverage and borrower characteristics by firm size, sector and time period—that enable users to analyze how yields and spreads change over time, how risk differs between borrowers and how credit conditions vary across sectors (see Exhibit 2).

Better measurement will not erase the structural differences between private credit and public markets. It can, however, provide a clearer lens into performance, risk and market dynamics. As private credit continues to evolve, benchmarking infrastructure needs to evolve alongside it, helping the market move toward a new generation of benchmarks that offer greater transparency, comparability and possibility.

Learn more about the S&P Lincoln Senior Debt Index Series to see how we’re helping market participants assess performance and risk with greater transparency.


1Private Credit Fundraising H1: Market on Course for Record Year,” With Intelligence by S&P Global, Aug. 12, 2026.

2 Source: S&P Global, CapIQ. Data from Dec. 31, 2016, to Dec. 31, 2024, as presented in Exhibit 1 of S&P DJI’s “Measuring Direct Lending: Building Transparency in Private Credit Markets,” April 1, 2026.

The posts on this blog are opinions, not advice. Please read our Disclaimers.