Whether you call it soccer or football, there’s no denying the World Cup was a blast for North Americans and visitors alike. Off the field, one of the most enjoyable spectator sports was watching camaraderie emerge from road trips and cultural mashups. Whether it was the Tartan Army firing up the Miami Marlins, Samurai Blue fans discovering Buc-ee’s brisket, or Lawrence, Kansas embracing all-things Algeria, unexpected combinations often bring the greatest results.
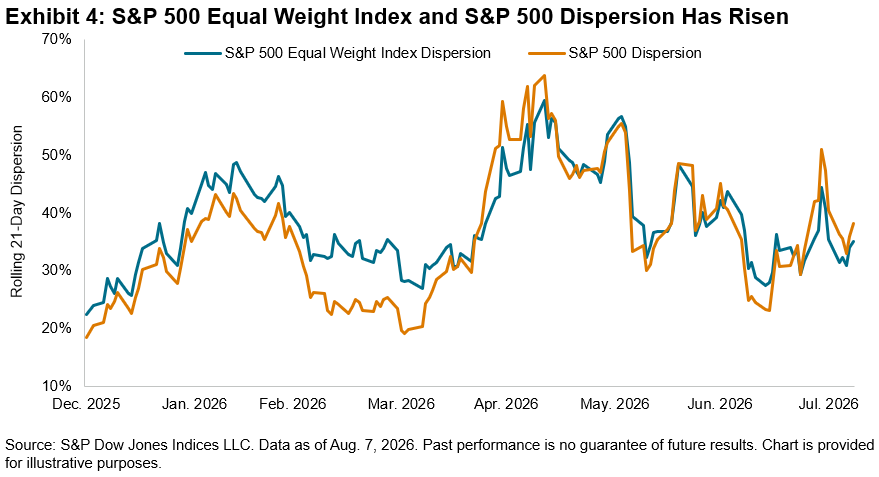
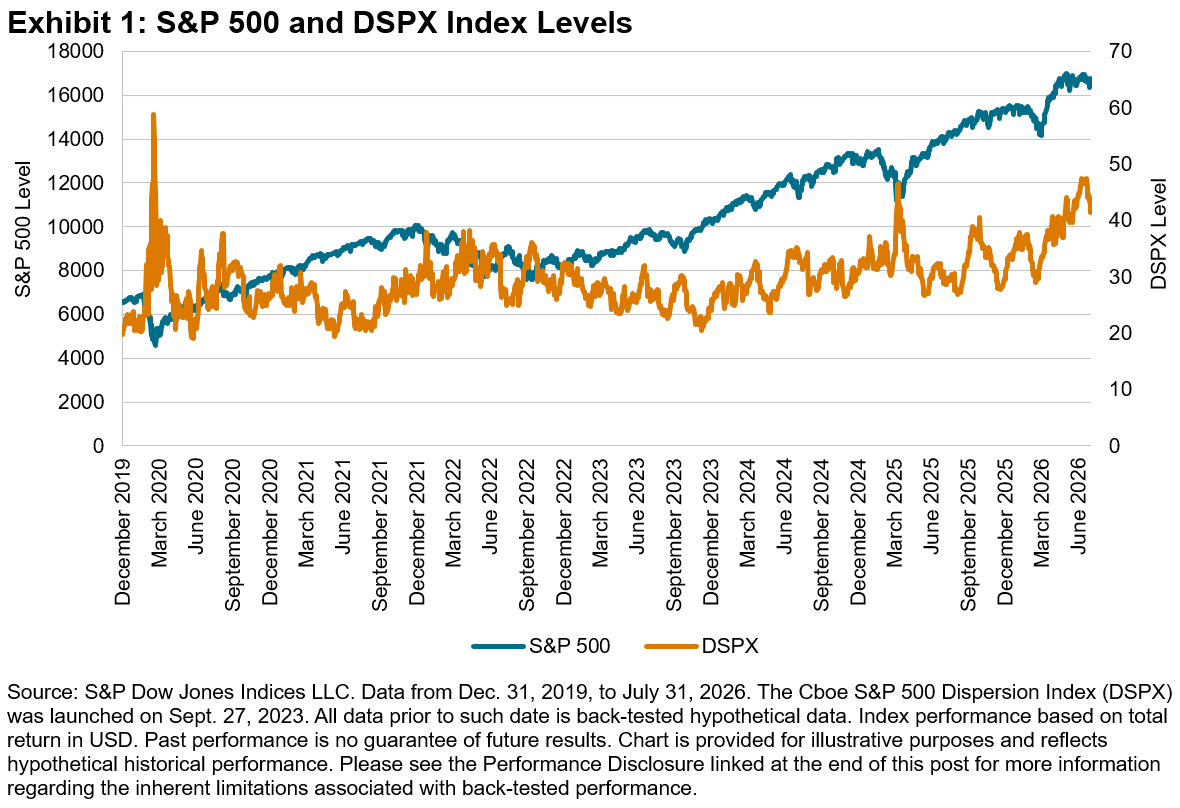
From a U.S. equities perspective, the first seven months of 2026 combined to produce sound results, but with strong headline index performance masking underlying macroeconomic uncertainty and broadening market leadership. A defining indicator of this current regime is the Cboe S&P 500® Dispersion Index (DSPX). As of July 21, 2026, the DSPX reached 47.5, its highest level since March 2020, as shown in Exhibit 1. Elevated dispersion indicates significant variance in constituent performance, potentially creating a more favorable environment for factor-based strategies.
Among the multiple factors that have benefitted from a high-dispersion environment, the S&P 500 Momentum Index stands out, rising 20.2% YTD (see Exhibit 2).
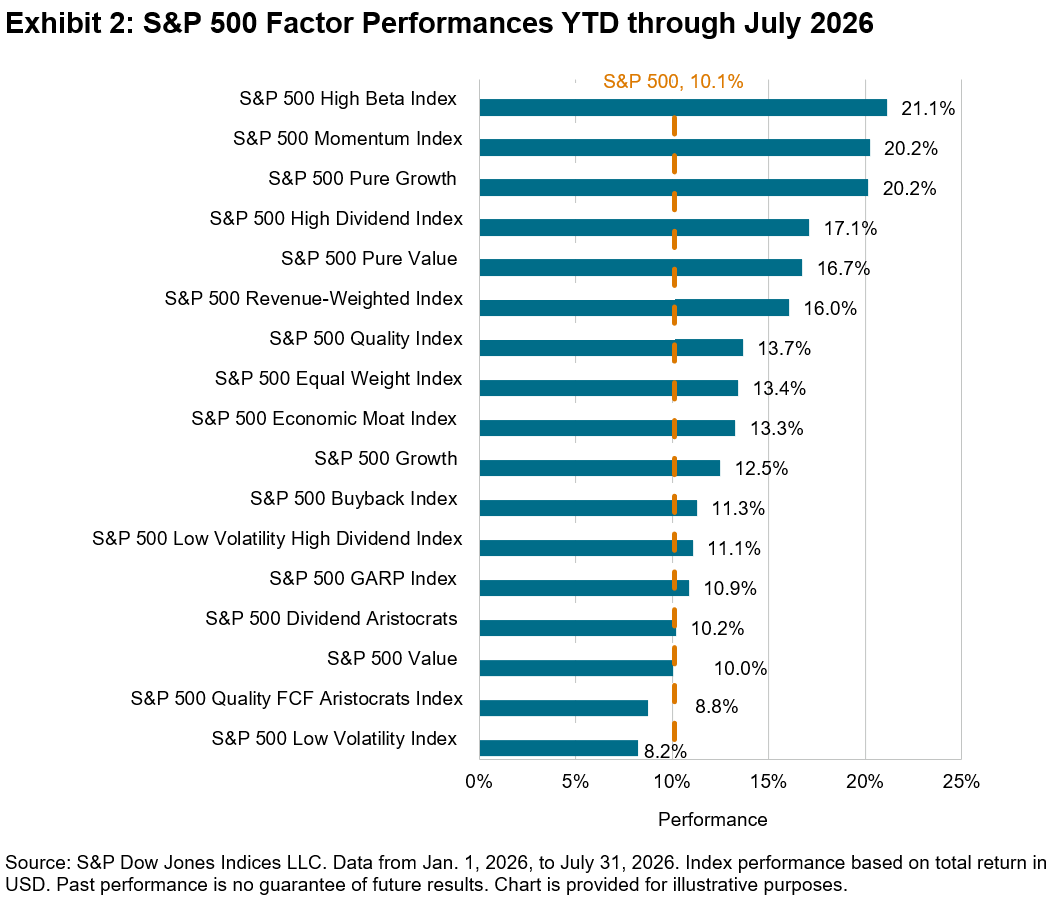
While the S&P 500 Momentum Index’s outperformance so far in 2026 has owed much to its current selection of semiconductors stocks, further down in Exhibit 2 sits a less discussed factor that has fared relatively well YTD despite completely eschewing the Semiconductor & Semiconductor Equipment industry group—the S&P 500 Low Volatility Index.
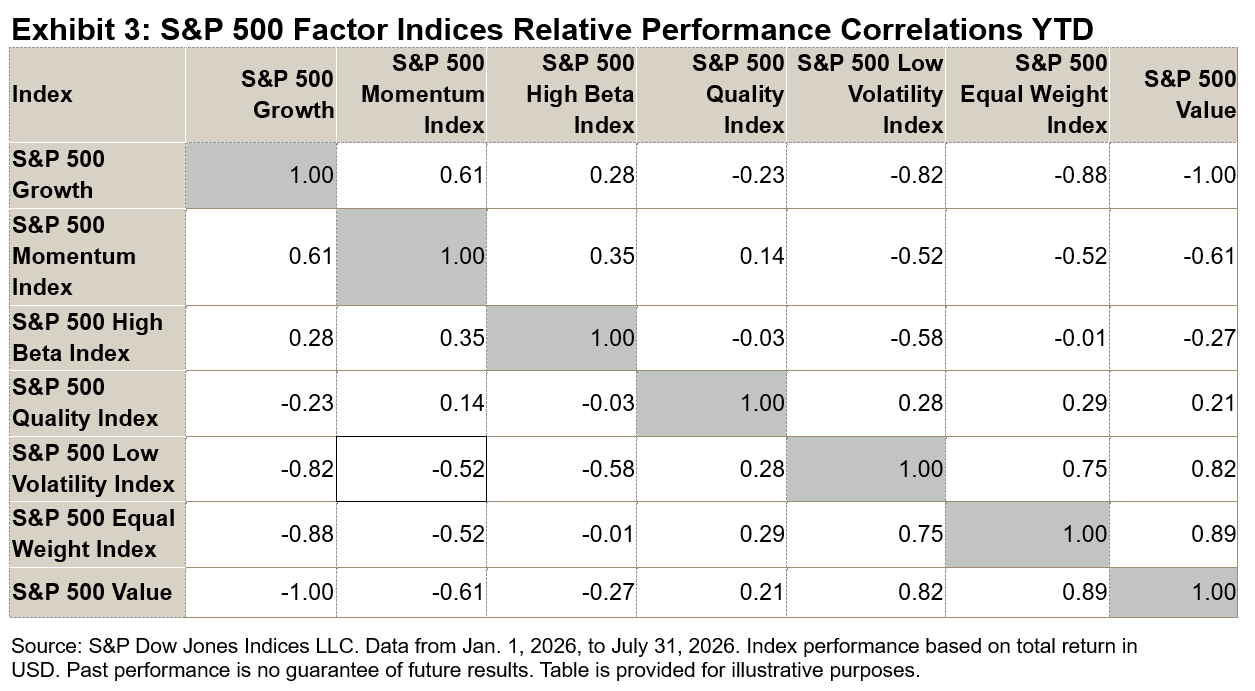
As the AI narrative cooled in July and the S&P 500 Momentum Index pulled back, the S&P 500 Low Volatility Index generated outperformance, a short-term result that points to a longer-term pattern of low, and even negative, correlation with the S&P 500 Momentum Index. As of July 2026, the one-year rolling correlation coefficient between the excess performance of the S&P 500 Low Volatility Index and the S&P 500 Momentum Index stood strongly negative, at -0.52 (see Exhibit 3).
In Exhibit 4, we take a closer look at these two factors through the lens of trailing one-year performance, underscoring how the S&P 500 Low Volatility Index and S&P 500 Momentum Index have behaved quite differently depending on the market regime.
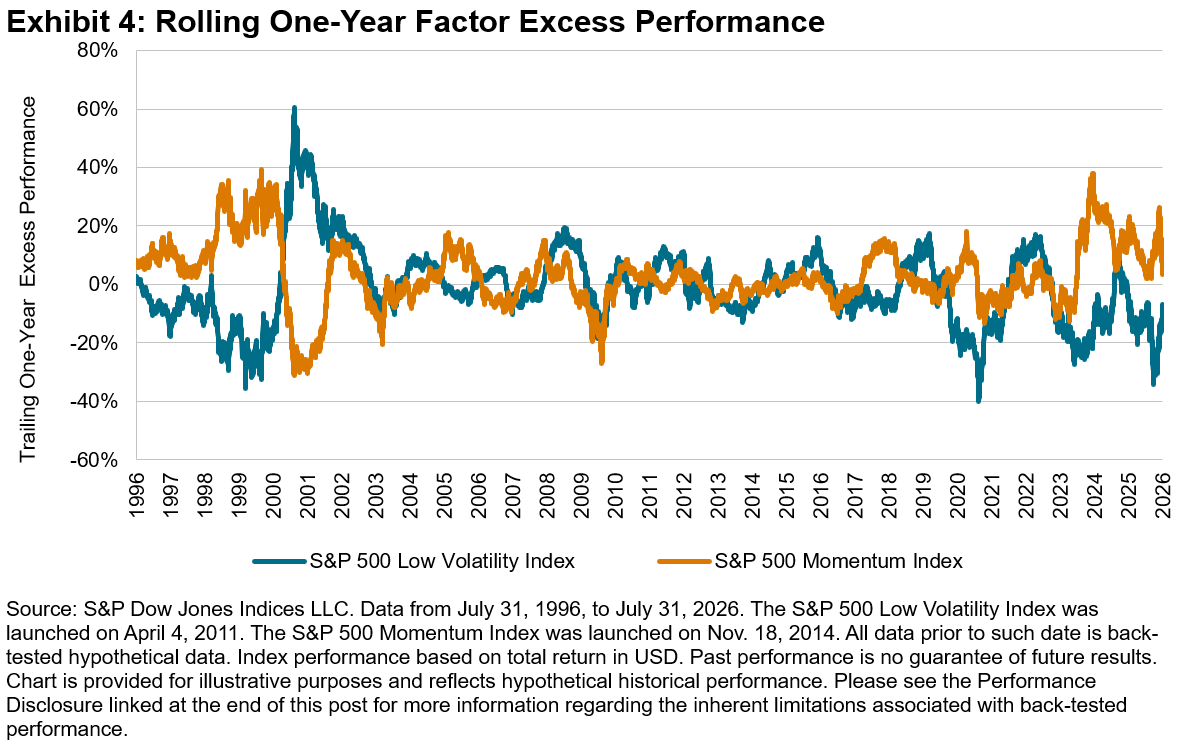
We’ve previously discussed the S&P 500 Momentum Index’s historical pattern of outperformance in up-cycles and the S&P 500 Low Volatility Index’s resilience in market downturns. Indeed, both factors have historically reflected slightly more upside than downside, yet remained uncorrelated, suggesting a possibility for performance improvement and diversification through combination.
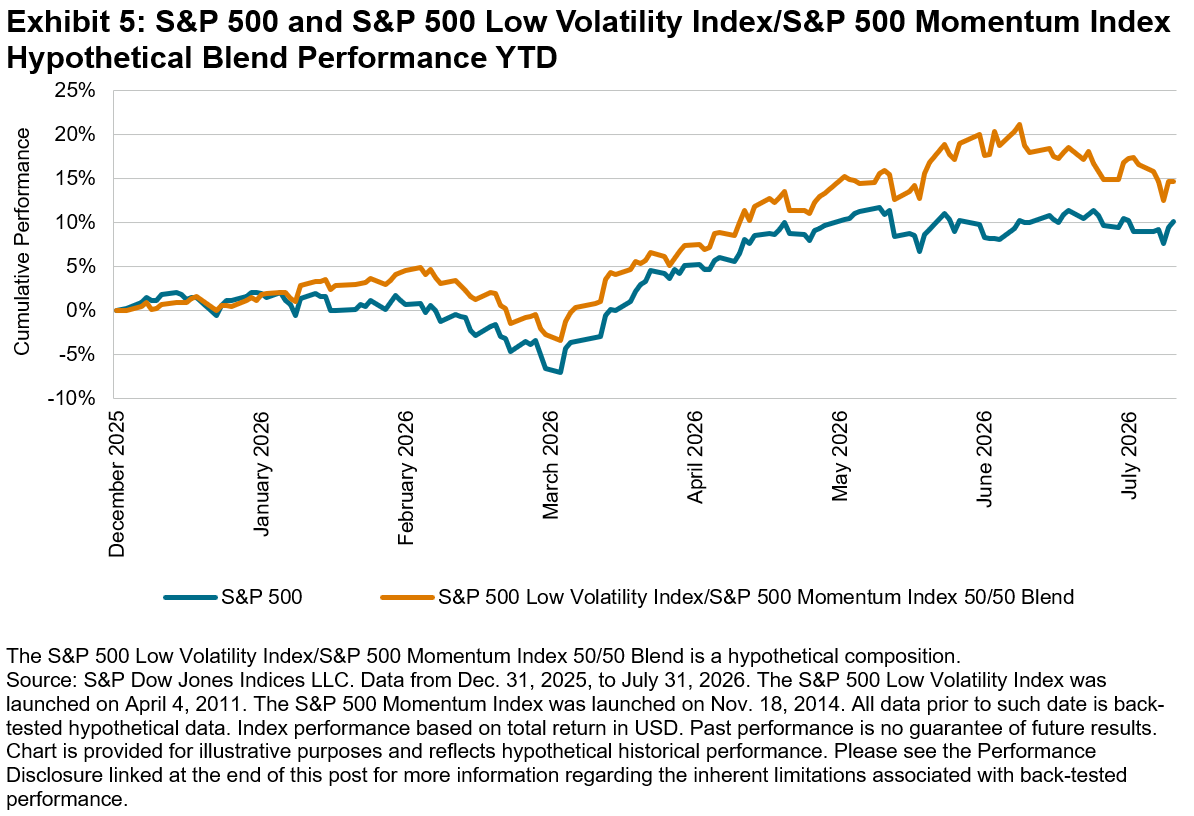
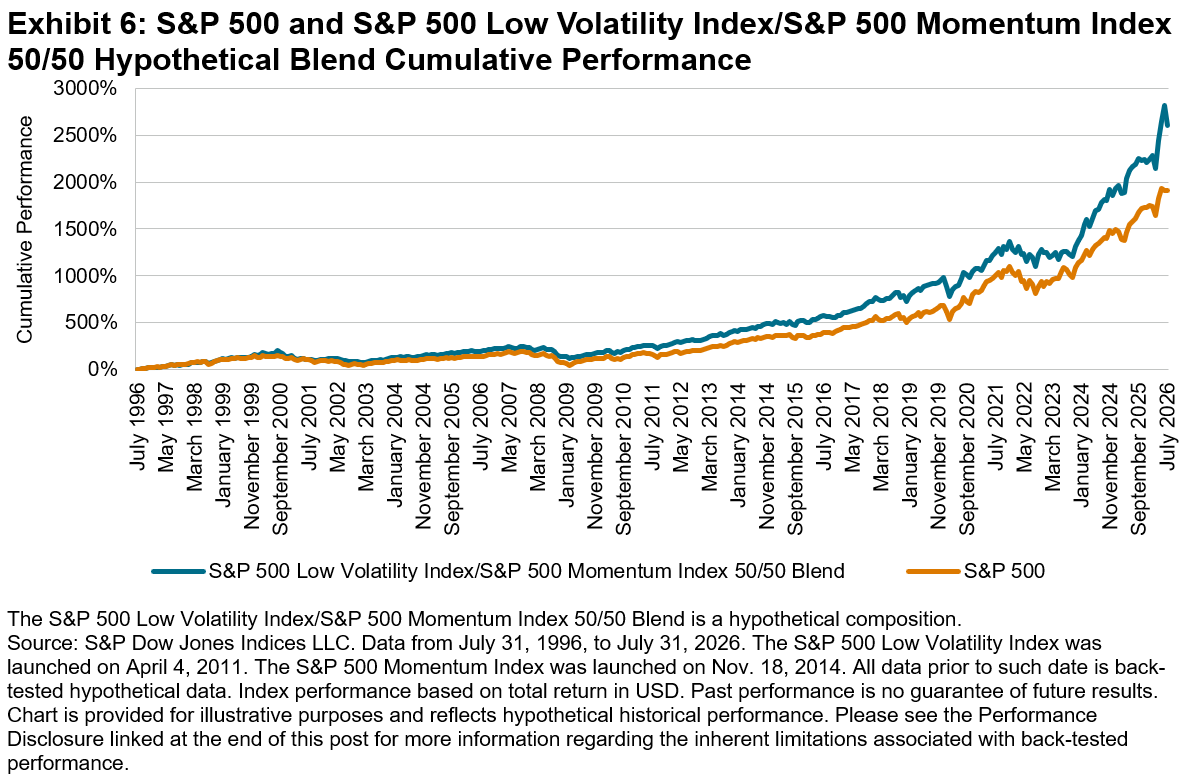
To investigate this thesis, we created a hypothetical index blend consisting of a 50% weight in the S&P 500 Low Volatility Index and a 50% weight in the S&P 500 Momentum Index, then measured its performance relative to the S&P 500 over a 30-year time horizon as well as the YTD 2026 period.
Exhibit 5 illustrates the 2026 YTD performance of the unrebalanced hypothetical blend, which outperformed the S&P 500 benchmark by 4.5% and outperformed for most of the period.
Perhaps owing to the S&P 500 Low Volatility Index’s track record of asymmetric upside/downside capture (i.e., reflecting less downside than upside) combined with the S&P 500 Momentum Index’s demonstrated tendency to outperform in rising markets, the hypothetical blend exhibited a mix of the two factors’ traits, on average reflecting 87.8% of upside during the 12-month periods in which the S&P 500 rose and 61.0% of downside when the benchmark fell over the 30-year back-tested period. It should be no surprise that compounding this hypothetical differential through the ups and downs generated cumulative performance exceeding that of The 500® while also producing less volatility, as illustrated in Exhibit 6.
Individually, factor indices each tell interesting stories about behavioral and economic forces driving global markets. Like travelers of the world, they each come with their own unique histories full of ups and downs. They each evolve and reflect underlying trends, and their differences point toward the intriguing possibilities of new and diverse combinations waiting to be explored.
The author thanks Luke Twum-barima for his research contributions to this blog.
This content may be AI-assisted and is composed, reviewed, edited, and approved by S&P Global.
The posts on this blog are opinions, not advice. Please read our Disclaimers.