In November 2025, S&P DJI expanded its S&P Dividend Growers Index Series by launching the S&P Developed Ex-North America Dividend Growers Index. Like its counterparts, the index focuses on companies with a consistent history of dividend payments, while excluding those with the highest yields to help reduce the risk of yield traps.1 Over the back-tested period, this disciplined approach generated robust long-term outperformance and strong defensive characteristics relative to its universe, the S&P EPAC BMI.
In this blog, we will provide an overview of the index’s methodology—including its rigorous criteria—and showcase its outperformance and key defensive characteristics.
Methodology
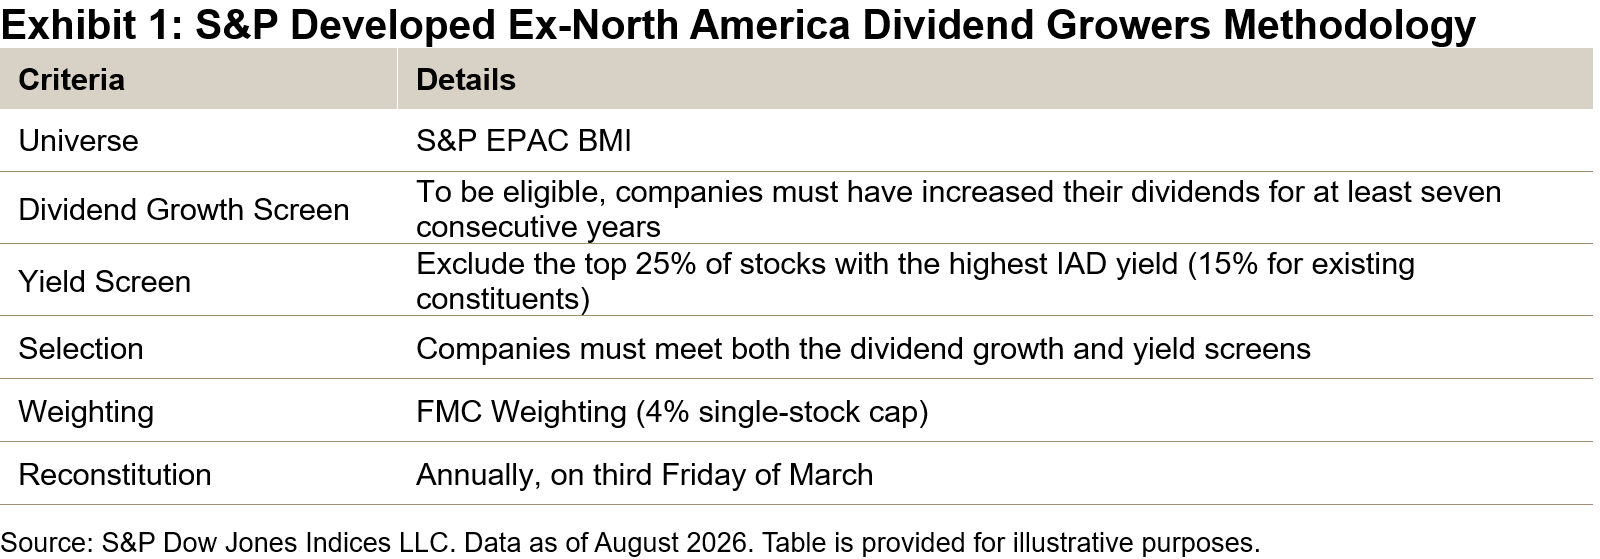
To qualify for inclusion, companies must have raised their dividends for at least seven consecutive years. Next, those ranked in the top 25% by indicated annual dividend (IAD) yield are excluded to help mitigate the risk of yield traps. Companies passing these screens are selected for the index and weighted by float-adjusted market capitalization (FMC).
The dividend growth and yield screens are the defining features of the S&P Dividend Growers Index Series. By working in tandem, these filters aim to enhance the overall quality of the index and drove its strong performance and defensive characteristics over the back-tested period, which will be explored in the following sections.
Performance
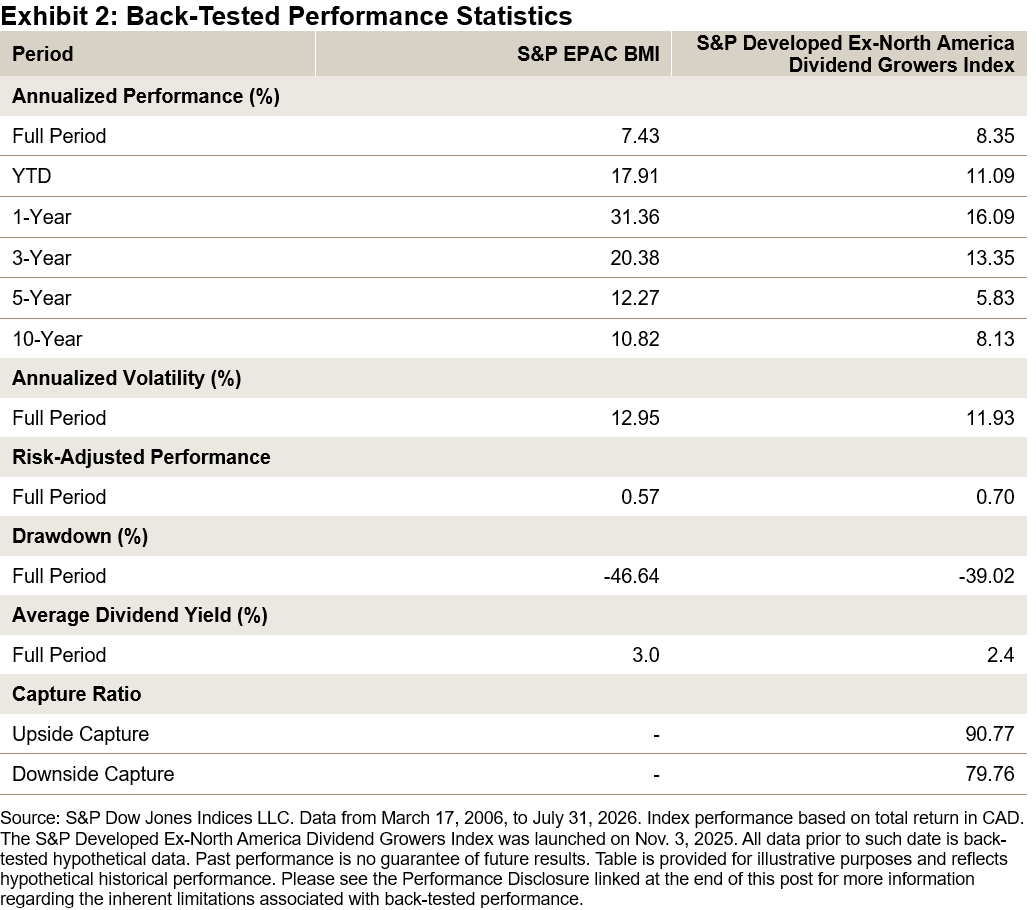
Over the 20 years of back-tested data since its inception, the S&P Developed Ex-North America Dividend Growers Index outpaced the S&P EPAC BMI by approximately 92 bps on an annualized basis. Notably, it delivered this outperformance while demonstrating defensive characteristics, including lower volatility (11.93% versus 12.95%), a smaller maximum drawdown (39.0% versus 46.6%) and more favorable capture ratios (90.77 upside and 79.76 downside) relative to the S&P EPAC BMI.
Beyond these standard measures of defensive characteristics, the next section delves deeper into how the index behaved during past drawdown events and across different macroeconomic environments.
Defensive Characteristics
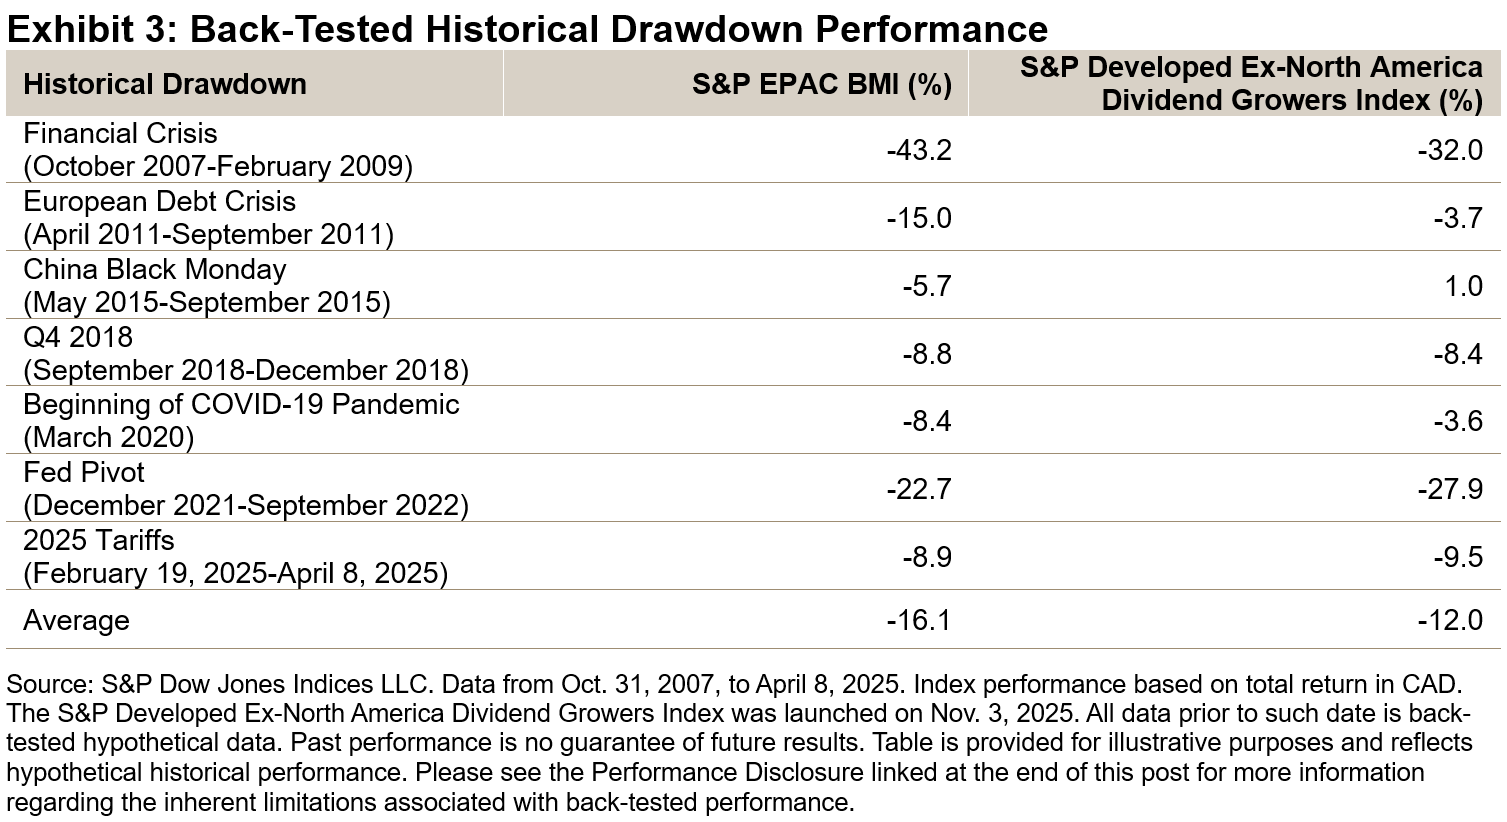
Over the back-tested period, the S&P Developed Ex-North America Dividend Growers Index outperformed the S&P EPAC BMI in five of the last seven major drawdown periods. During these drawdowns, it demonstrated downside protection, with an average decline of 12.0% compared with 16.1% for the S&P EPAC BMI.
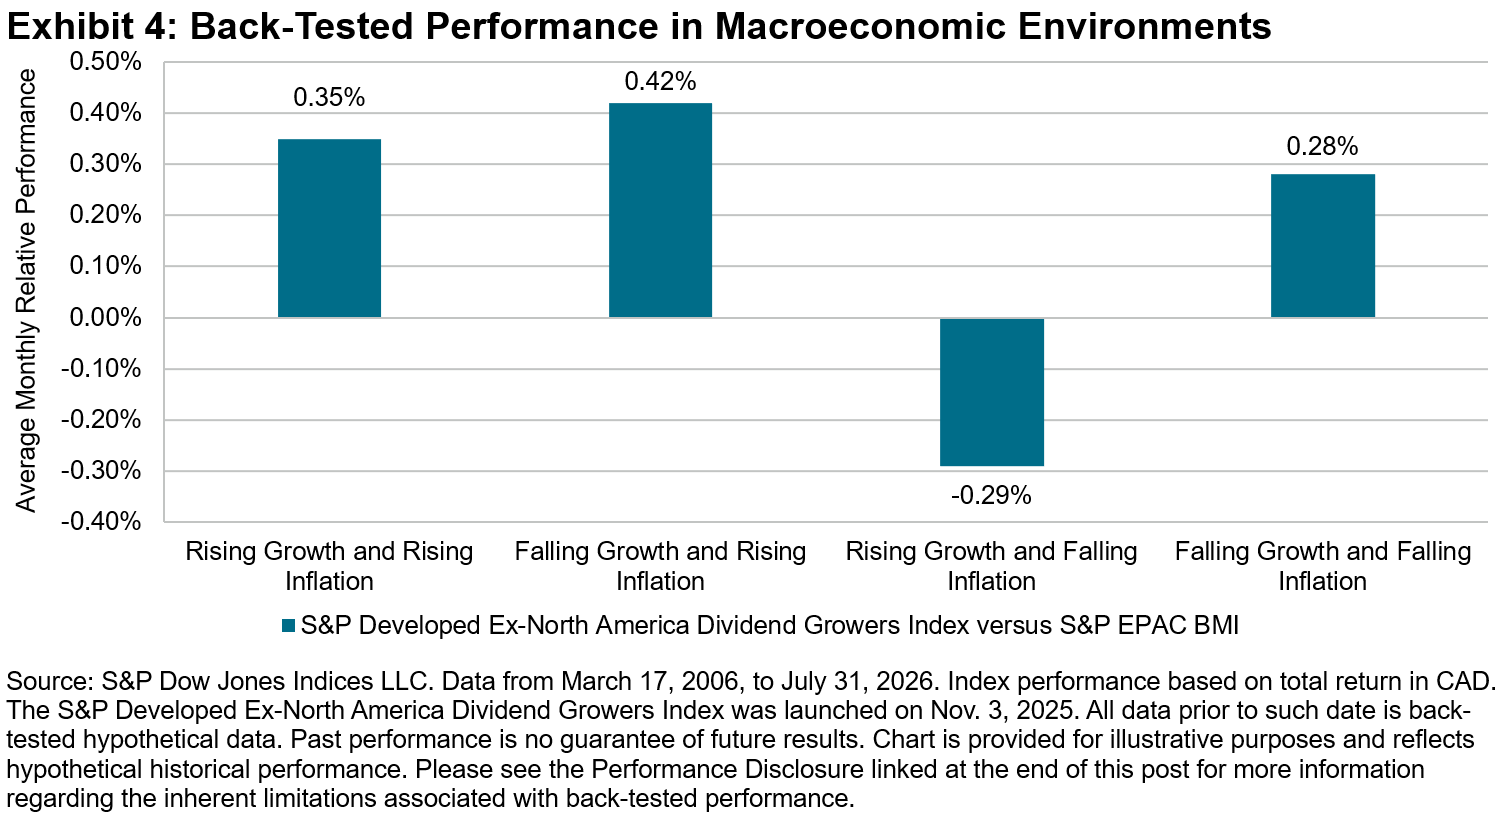
Defensive characteristics are further highlighted in Exhibit 4, which shows the index’s outperformance or underperformance across four macroeconomic environments defined by rising or falling inflation and growth. The index’s defensive profile is underscored by its outperformance in three of the four regimes, with its strongest results in the “risk-off” stagflationary environment (falling growth, rising inflation), while it lagged only in the “risk-on” regime characterized by rising growth and falling inflation.
Consistent Outperformance
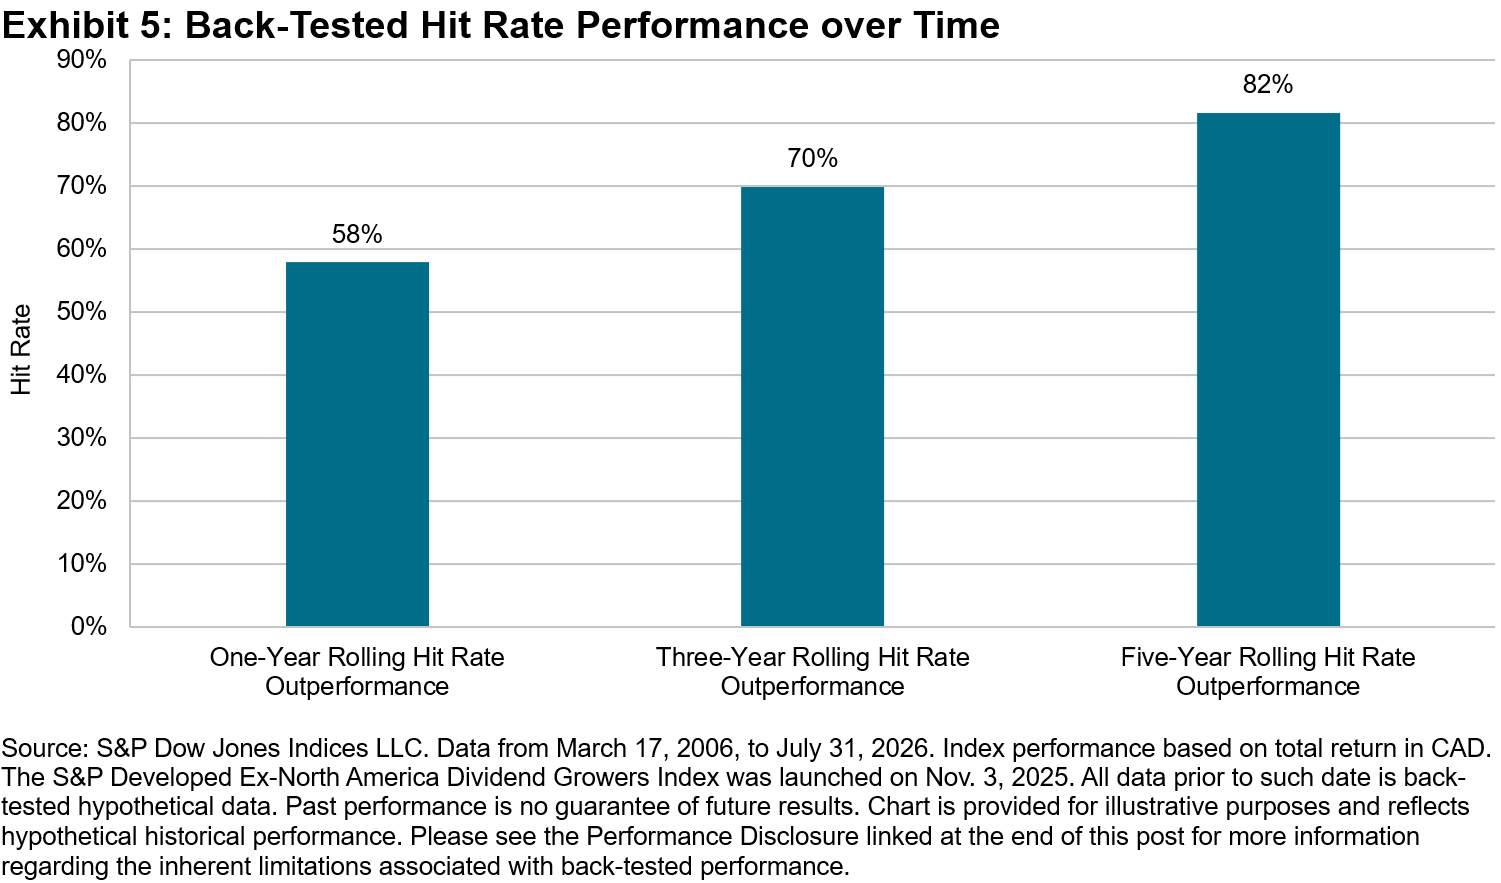
A key highlight from the back-tested period is the consistent outperformance of the S&P Developed Ex-North America Dividend Growers Index, which becomes more pronounced over longer investment horizons. The index outperformed the S&P EPAC BMI in 58% of one-year rolling periods, 70% of three-year rolling periods and a notable 82% of five-year rolling periods.
Conclusion
S&P DJI is pleased to expand the S&P Dividend Growers Index Series with the S&P Developed Ex-North America Dividend Growers Index. Like others in the broader series, the index’s rigorous methodology has led to strong long-term performance and defensive characteristics throughout the back-tested period.
1For more information about yield traps, please see: https://www.vanguard.com.au/personal/learn/smart-investing/investing-strategy/avoid-dividend-yield-traps
The posts on this blog are opinions, not advice. Please read our Disclaimers.