Last year, we published a paper reviewing the long-term performance of factor indices in the Australian market. One of the key observations from that paper was that, over the long term, quality and momentum had historically been among the strongest-performing single-factor indices. More recently, however, both quality and momentum have faced performance challenges, while enhanced value and high dividend strategies have outperformed the broad market. This blog revisits the recent performance of Australian factor indices and examines some of the drivers behind these shifts.
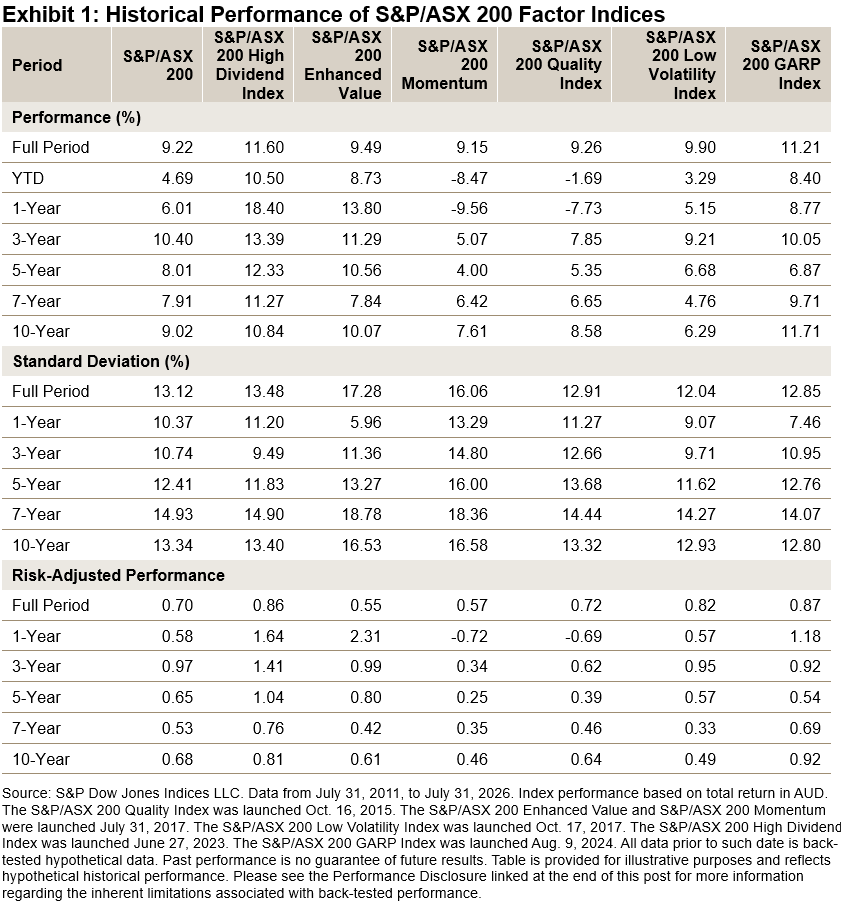
Exhibit 1 compares the recent performance of headline S&P/ASX 200 Factor Indices: the S&P/ASX 200 High Dividend Index, S&P/ASX 200 Enhanced Value, S&P/ASX 200 Momentum, S&P/ASX 200 Quality Index and S&P/ASX 200 Low Volatility Index. The full period shown spans the 15-year period from August 2011 to July 2026 and includes back-tested data. Over this horizon, the best-performing single factor was high dividend, followed by low volatility and enhanced value. Quality and momentum ranked lower within the S&P/ASX 200 factor universe, highlighting how different observation periods can lead to different conclusions about factor performance. Low volatility’s long-term performance was largely supported by its strong run from 2011 to 2015, when it outperformed the S&P/ASX 200 for five consecutive years. By contrast, enhanced value and high dividend indices have posted strong relative performance over the past five years. In terms of risk, the enhanced value and momentum factors exhibited meaningfully higher volatility than the benchmark and most other factor indices, while the volatility of the remaining factor indices was generally more in line with the S&P/ASX 200 over the long term.
Exhibit 1 also includes the S&P/ASX 200 GARP Index, a multi-factor index that integrates growth, quality and valuation considerations. The combination of these signals into one index led the S&P/ASX 200 GARP Index to post strong historical performance with lower volatility, resulting in the strongest risk-adjusted performance profile over the 15-year period.1
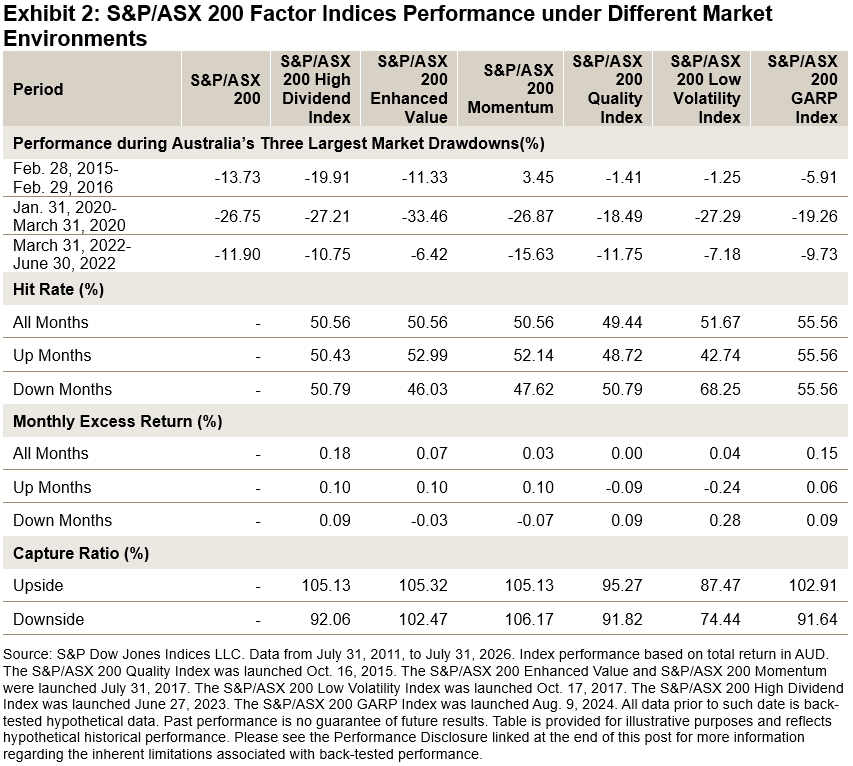
Even when two factor indices both generated historical outperformance, the sources and timing of that outperformance could differ meaningfully. Exhibit 2 shows factor index performance during three major drawdown periods over the past 15 years, as well as the average performance during months when the S&P/ASX 200 posted gains (up months) or losses (down months). The results suggest that quality and low volatility tended to behave more defensively, with a greater tendency to outperform when the S&P/ASX 200 declined. By contrast, enhanced value and momentum were generally more pro-cyclical, with outperformance more likely during positive market months. Due to their index designs, high dividend and GARP showed a more balanced pattern across market environments, generating positive relative performance on average in both up and down markets.
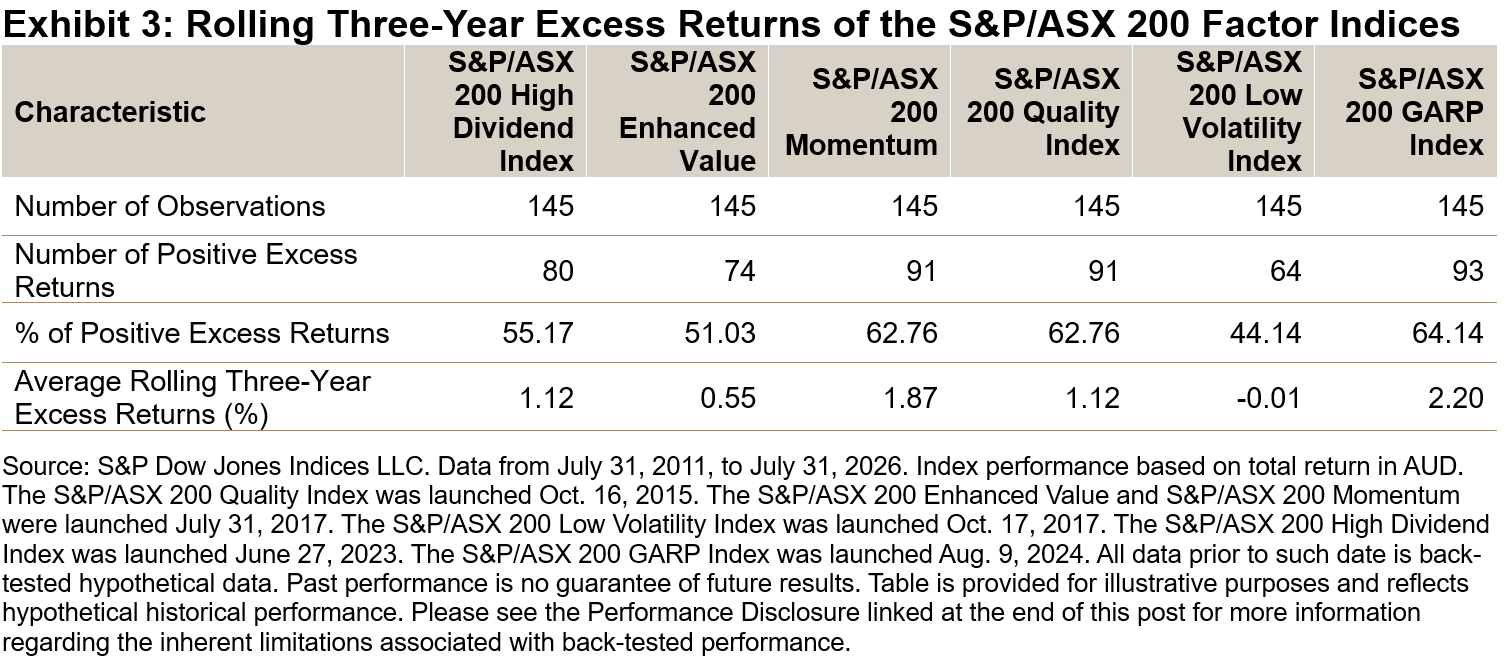
Although high dividend, low volatility and GARP were the three strongest performers over the full 15-year period, performance stability provides another important perspective. Measured by the proportion of rolling three-year periods in which each index outperformed the S&P/ASX 200 (see Exhibit 3), momentum, quality and GARP showed a higher likelihood of outperformance. Each outperformed the benchmark in more than 60% of rolling three-year windows, underscoring the importance of looking beyond cumulative performance alone when evaluating factor strategies.
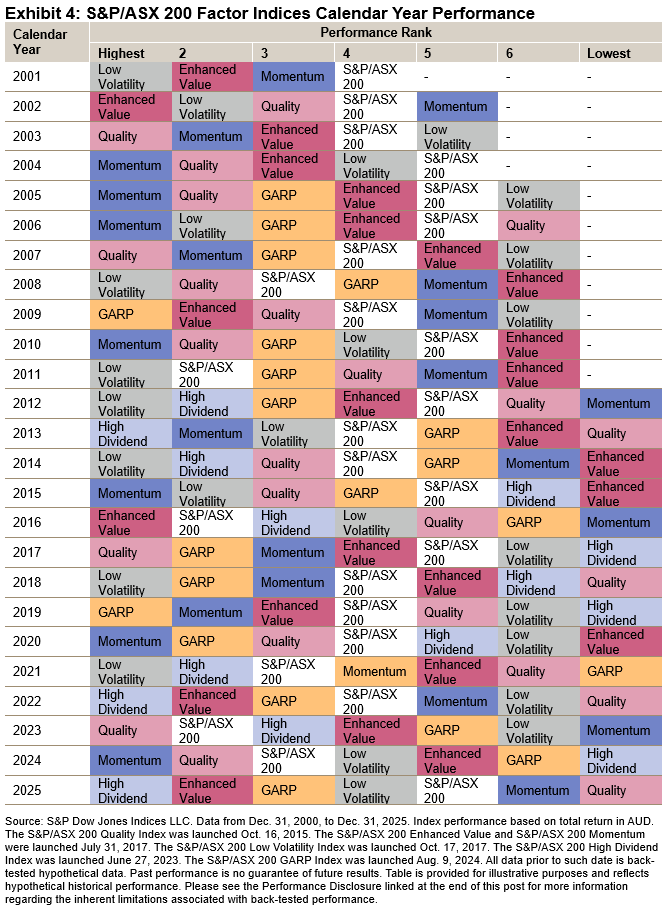
The rolling three-year results also reinforce the cyclical nature of factor performance. Exhibit 4 presents a heat map of calendar-year performance across the factor indices. As noted earlier, low volatility enjoyed a strong five-year period between 2011 and 2015, but its relative performance weakened in the subsequent five years, with 2018 as a notable exception. Quality and momentum had a strong run in 2024, while enhanced value and high dividend rebounded in 2025. The historical calendar-year performance pattern illustrates how factor performance has varied over time in the Australian market. This is another reason why a multi-factors approach, such as GARP, has helped mitigate the cyclicality associated with individual factors.
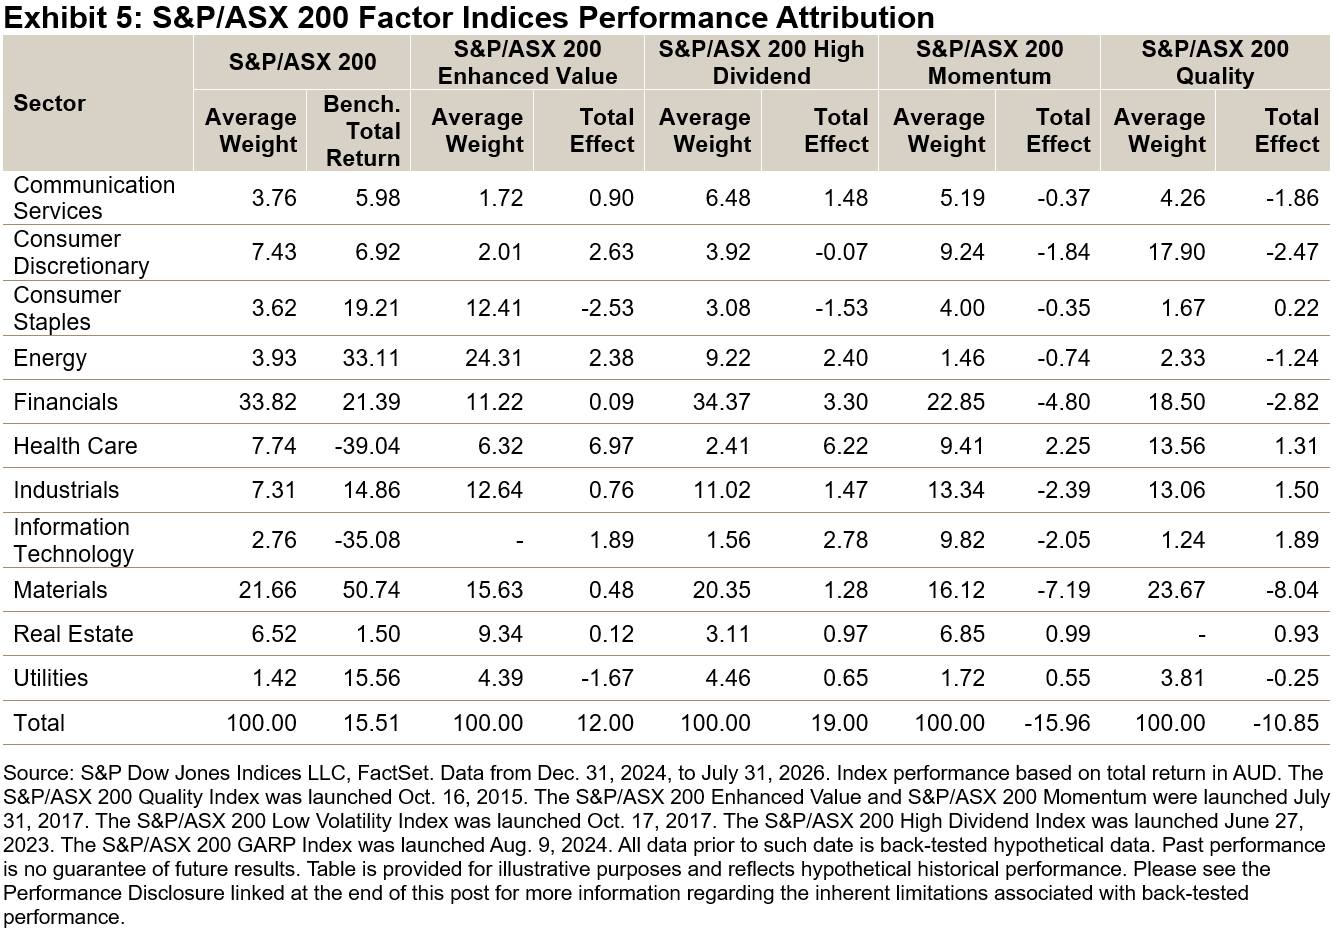
Lastly, what has driven the recent outperformance of the enhanced value and high dividend factors, and what has weighed on quality and momentum? The attribution analysis points to a mix of an index’s sector profile and stock selection effects. At a high level, Materials, Energy and Financials performed relatively well, while Information Technology and Health Care lagged during the period observed. This sector divergence generally benefited the enhanced value and high dividend factor indices and weighed on quality and momentum. At the stock level, BHP was a strong contributor and James Hardie Industries was a main drag within Materials, while Pro Medicus and REA Group also faced more challenging periods, creating headwinds for the quality factor index.
In summary, the recent performance of the S&P/ASX 200 Factor Indices highlights both the persistence and cyclicality of factor indices in Australia. While high dividend and enhanced value have benefited from recent market leadership in sectors such as Materials, Energy and Financials, quality and momentum have faced headwinds from both sector makeup and stock-specific challenges. Over longer horizons, however, factor leadership has rotated meaningfully, reinforcing the importance of evaluating performance across different market environments. Meanwhile, the GARP multi-factor approach offered a more balanced performance profile compared with the single-factor indices.
1 For more information about the S&P/ASX 200 GARP Index, please see our paper “Exploring the S&P/ASX 200 GARP Index.”
The posts on this blog are opinions, not advice. Please read our Disclaimers.