Get Indexology® Blog updates via email.

In This List

S&P Momentum Indices Shine in April Rally

Beyond Mega Caps: Navigating Concentration and Diversification in Crypto Index Construction

Firewall as the Frontline

Beyond Borders: The Significance of the S&P 500 in Options-Based Strategies

The Evolution of Fixed Income Indexing: A Look over 25 Years

S&P Momentum Indices Shine in April Rally

Contributor Image
Wenli Bill Hao

Director, Factors and Dividends Indices, Product Management and Development

S&P Dow Jones Indices

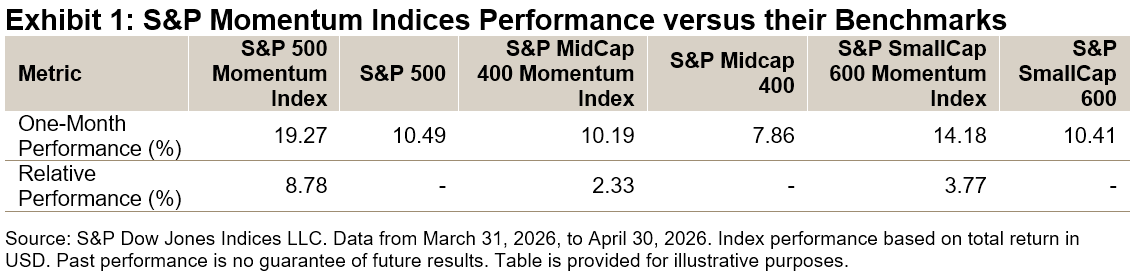
Momentum strategies, which tend to be known for performing well in trending markets, experienced a historically strong rebound in April. The S&P 500® Momentum Index, S&P MidCap 400® Momentum Index and S&P SmallCap 600® Momentum Index all posted double-digit gains, surpassing their respective benchmarks (see Exhibit 1). Notably, the April performance of the S&P 500 Momentum Index was the largest monthly gain since its inception in 1994.

In this blog, we will review the methodology, performance characteristics and attribution of the S&P Momentum Indices, with particular focus on the S&P 500 Momentum Index, S&P MidCap 400 Momentum Index and S&P SmallCap 600 Momentum Index.

Index Methodology

The S&P Momentum Indices typically utilize 12-month risk-adjusted price momentum to select stocks ranked in the top quintile of their eligible universes (see Exhibit 2).1 To account for short-term reversal effects, the most recent month is excluded when calculating price momentum.2 Employing risk-adjusted momentum instead of raw price momentum may help mitigate the negative impacts of idiosyncratic risk associated with raw momentum and can also reduce downside risks.3

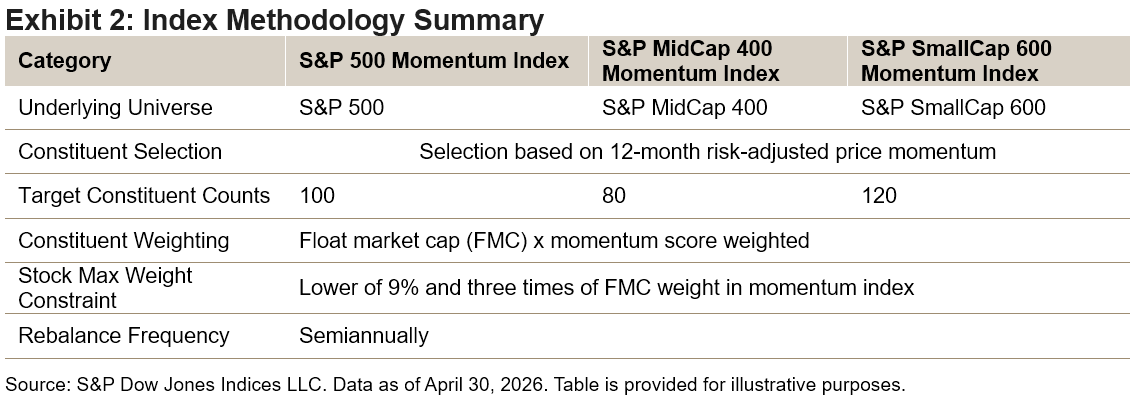
The constituents of the S&P Momentum Indices are weighted by the product of their FMC and momentum score, subject to individual security and sector weight constraints. This approach effectively balances market weight with targeted factor exposure. The indices are rebalanced semiannually, with a 20% buffer rule to help reduce turnover.

A Short- and Long-Term View of Performance

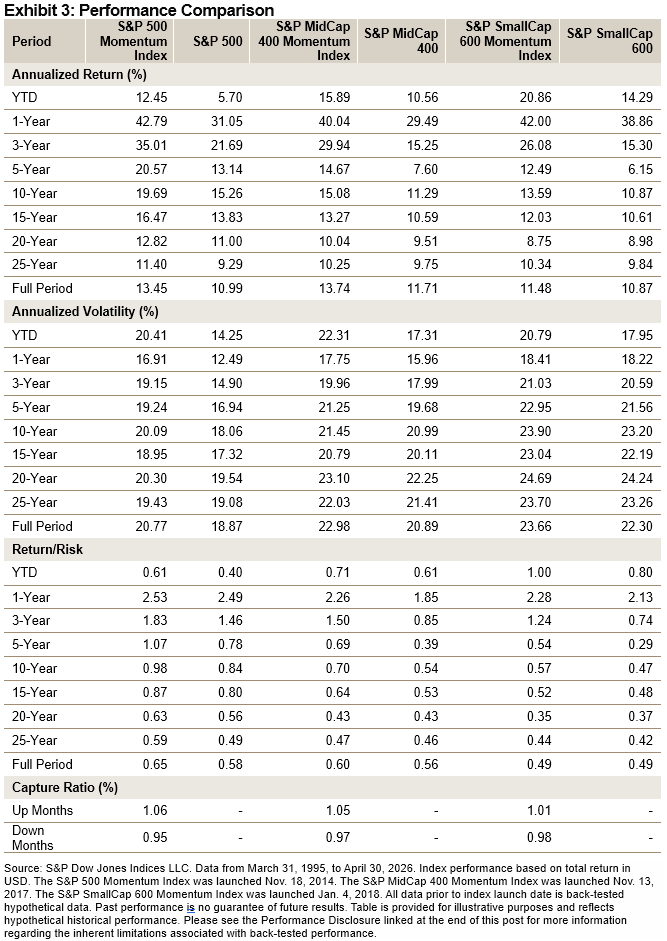
Exhibit 3 demonstrates that all three S&P Momentum Indices have historically outperformed their respective benchmarks based on both absolute and risk-adjusted returns, in both the short and long term.

Over the past year, the S&P 500 Momentum Index, S&P MidCap 400 Momentum Index and S&P SmallCap 600 Momentum Index outperformed their benchmarks by 11.74%, 10.55% and 3.14%, respectively.

Furthermore, these indices have shown favorable capture ratios, delivering higher or similar gains during up markets4 and experiencing smaller declines during down markets.

Top Performance Contributors

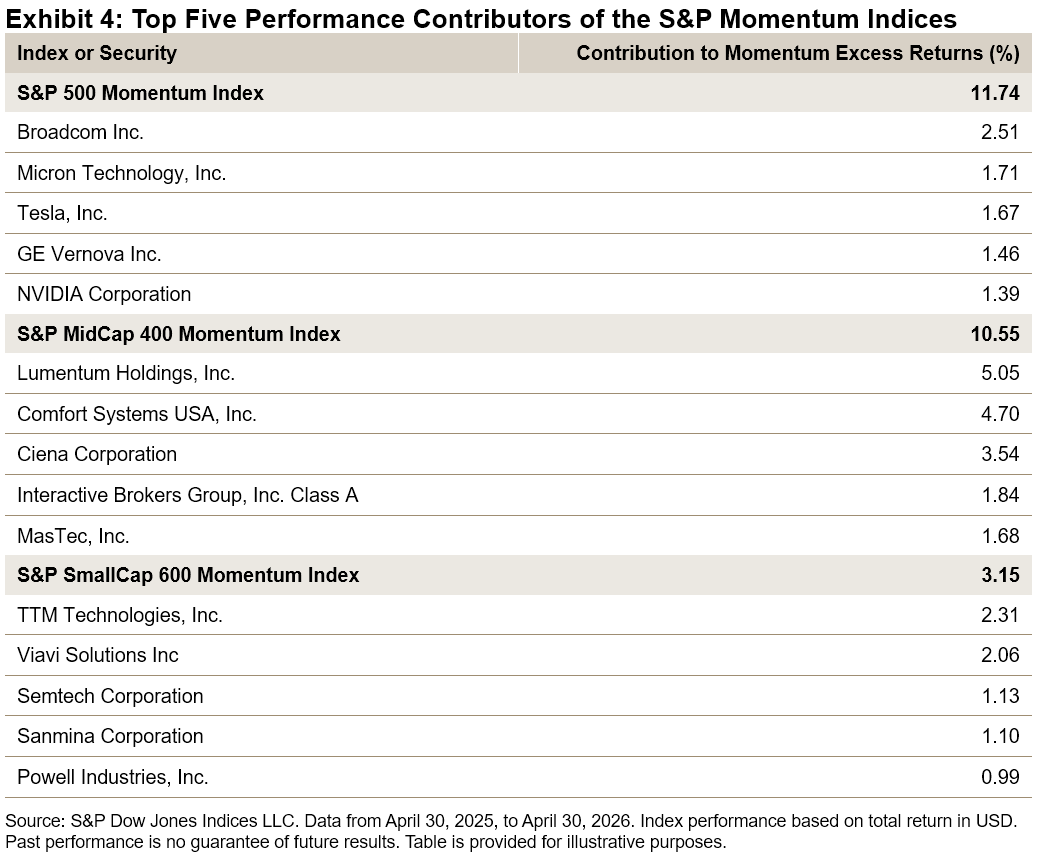
Exhibit 4 highlights the top five contributors to the performance of these three S&P Momentum Indices over the one-year period ending April 30, 2026. Broadcom, Lumentum and TTM Technologies were the leading performers in the S&P 500 Momentum Index, S&P MidCap 400 Momentum Index and S&P SmallCap 600 Momentum Index, respectively.

Sectors

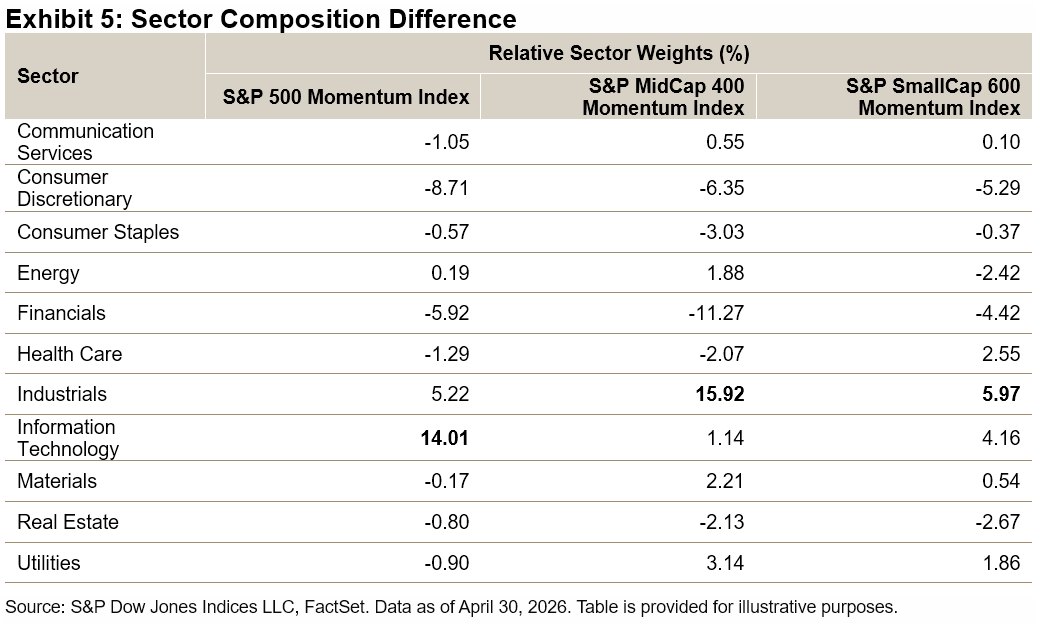
Exhibit 5 displays the active sector weights for the S&P Momentum Indices as of April 30, 2026. The S&P 500 Momentum Index overweighed the Information Technology sector by 14.01% relative to the S&P 500. Within the Information Technology sector, it was notably overweight in the Semiconductors and Semiconductor Equipment industry group by 20.61% and underweight in the Software and Services industry group by 7.29%. The S&P MidCap 400 Momentum Index and S&P SmallCap 600 Momentum Index held overweight positions of 15.92% and 5.97%, respectively, in the Industrials sector. All three indices exhibited large underweights in the Consumer Discretionary and Financials sectors.

Conclusion

The April rally underscored the resilience of the S&P Momentum Indices. Their strong performance, driven by a robust risk-adjusted methodology and favorable sector weights, highlights their potential as a systematic approach to reflecting market trends. With their historical outperformance, favorable capture ratios and disciplined rebalancing, these indices provide another tool for navigating the market.


1 Please refer to the S&P Momentum Indices Methodology for more details.

2 Jegadeesh, Narasimhan and Sheridan Titman, “Returns to Buying Winners and Selling Losers: Implications for Stock Market Efficiency,” The Journal of Finance, Vol. 48, No. 1, March 1993.

3 Fan, Minyou, Kearney Fearghal, Youwei Li and Jiadong Liu, “Momentum and the Cross-section of Stock Volatility,” Journal of Economic Dynamics and Control, Volume 144, November 2022.

4 The market is defined as the monthly performance of the underlying benchmarks from March 31, 1995, to April 30, 2026.


The posts on this blog are opinions, not advice. Please read our Disclaimers.

Beyond Mega Caps: Navigating Concentration and Diversification in Crypto Index Construction

Contributor Image
Felipe Diaz

Analyst, Global Exchanges & Digital Assets

S&P Dow Jones Indices

Cryptocurrency investing straddles two seemingly contradictory truths: market leadership changes fast, yet overall exposure remains dominated by a handful of top assets. From 2018 to 2025, Bitcoin and Ethereum—two mega caps¹—held a combined average weight of 78% in the S&P Cryptocurrency Broad Digital Asset (BDA) Index, while the top five constituents made up roughly 86% of the total index weight.

Outside that group, turnover has been notable: six of today’s top 10 assets in the S&P Cryptocurrency BDA Index either weren’t in the top 10 in 2017 or didn’t yet exist, and Bitcoin Cash’s weight collapsed from 9.4% to 0.5% over the same window.

Managing Turnover in a Fast-Moving Market

To reflect this shifting universe without excessive turnover, S&P DJI’s multi-coin strategies rebalance quarterly. For the S&P Top N Indices (targeting 5, 10, 20 or 30 constituents), a key design consideration is the 80/120 buffer rule built into the S&P Digital Assets Index Methodology: assets ranking in the top 80% of the target count are automatically included, while current constituents ranking within the top 120% receive priority for the remaining slots. This protects existing constituents from being swapped out due to the minor, short-term price fluctuations typical of crypto.

Choosing among Weighting Approaches

With the universe defined, market participants can select among indices ranging from market cap to equal weight. While some prefer cap weighting, others prefer equal weighting to give relatively greater representation to smaller cryptocurrencies.

Diversification, however, generally isn’t cost-free. The S&P Cryptocurrency Top 5 Equal Weight Index underperformed its cap-weighted benchmark by more than 14% annualized since March 2018 and showed higher volatility. While established equity factors (value, growth, quality) don’t yet cleanly translate to crypto, the result here is consistent with a size bias: equal weighting mechanically underweights mega caps and overweights altcoins, which tend to be smaller and more volatile. Altcoins have often rallied hardest during liquidity-driven runs (as seen during the 2021 and 2023 recoveries) and fallen hardest during drawdowns. In 2022, the S&P Cryptocurrency Top 5 Equal Weight Index suffered a 74% drawdown versus 66% for its cap-weighted counterpart.

As a middle ground, the S&P Cryptocurrency Top 20 Select 35/20 Capped Index caps the largest constituent at 35%, with all remaining constituents capped at 20%—a familiar traditional finance mechanism applied to crypto. Yet the cost of diversification is visible here too: over seven years, the capped version underperformed its uncapped benchmark by 9.6% annualized (34% versus 44%) with higher realized volatility (77% versus 71%).

Looking Ahead

Mega-cap dominance has historically rewarded concentrated, cap-weighted exposure—and because the cap-weighted S&P Cryptocurrency BDA Index has historically carried approximately 86% of its weight in its five largest assets, it has behaved in practice much like a mega-cap-tilted portfolio. Should maturing regulation and broader adoption erode that concentration, altcoins may play a larger role in index design, and structural differences may be seen across the Top 10, Top 20, and 35/20 capped strategies that imply changes in liquidity, volatility and risk.

¹ Mega caps here refer to Bitcoin and Ethereum, the only two assets to hold top two positions consistently since 2017.

The posts on this blog are opinions, not advice. Please read our Disclaimers.

Firewall as the Frontline

Contributor Image
Srineel Jalagani

Senior Director, Thematic Indices

S&P Dow Jones Indices

Cybercrime’s AI Moment

Cybersecurity has recently entered the crosshairs amid advances in AI. The preview of Claude Mythos has raised concerns among government and industry officials about its broader implications for an increasingly digital economy. That growth in digital commerce has brought cybercrime with it, exploiting the anonymity and borderless nature of the web to grow in both scale and sophistication. Estimated at USD 220 billion globally, cybersecurity spending is forecast to grow 13% annually, underscoring the sector’s rising importance as AI reshapes the threat landscape.

Tracking Cybersecurity: Construction and Performance

Given its significance to both today’s and tomorrow’s economy, Cyber Security is one of 25 themes within the S&P Kensho New Economies framework driving the Fourth Industrial Revolution. The S&P Kensho Cyber Security Index includes only companies whose primary business is cybersecurity, reflecting the sector’s depth and maturity.1

The S&P Kensho Cyber Security Index delivered a five-year annualized total return of 9%, in line with the S&P 500 Equal Weight Index, and outperformed it over the three-year period. A modified equal weighting methodology was chosen for the S&P Kensho Cyber Security Index to avoid the concentration risk that characterizes many technology-linked indices, and performance is therefore compared against equal-weighted benchmarks. Since peaking in October 2025 alongside the broader market, the index has churned to a flat YTD return and sits 13% below its historic high, as markets continue to weigh AI’s ultimate impact on the sector.

Dressed as Software, Built Like Defense

While cybersecurity is software by definition and closely correlated with Software & Services industry group, the segment makes a compelling case for greater resilience to AI disruption. Unlike much of the software world, cybersecurity spending is largely non-discretionary, underpinned by regulatory mandates that persist regardless of the economic cycle or technological change. Rather than a threat, AI may prove to be a catalyst. Expanding digital touchpoints widens the scope for malware attacks, driving demand for greater governance, compliance and protection. The net effect points to an expanding total addressable market for cybersecurity, with AI creating demand faster than it automates existing functions.

Cybersecurity and broader software indices have faced headwinds in recent months, while defense stocks have moved in the opposite direction, buoyed by rising geopolitical tensions. This divergence, however, may obscure a deeper connection, as governments across major economies now explicitly identify cybersecurity as a national security priority, blurring the line between digital and physical defense.2, 3, 4

Defense without Borders

Treating cybersecurity as an integral part of the broader security landscape, we track this theme through two complementary indices:

  • The S&P Kensho Future Security Index5 takes a forward-looking view, positioning Cyber Security alongside Space, Robotics, Drones and Wearables as the technologies defining the future of the security landscape.
  • The S&P Atlas Security, Defense, and Operational Support Index offers a ready-made group of constituents spanning the full security landscape across eight clusters, including Digital Security, Aerospace, Weaponry and Robotics, covering both established and emerging defense technologies. Constituents are selected globally using an AI/NLP framework developed by Theia Insights. The index forms part of the broader S&P Atlas Thematic Indices suite, designed to reflect both current and future drivers of a theme within a single diversified framework.

The S&P Kensho Future Security Index has delivered strong performance, posting a three-year annualized gain of 29%, slightly behind the S&P Aerospace & Defense Select Industry Index. The performance differential is partially attributed to the modified equal weight approach of the Kensho index relative to the float market cap weighting of the S&P Aerospace & Defense Select Industry Index.

The S&P Atlas Security, Defense, and Operational Support Index has taken a more balanced path over the same period, broadly tracking the defense theme while retaining cybersecurity as a core cluster. This reflects the blend of established defense and emerging security technologies that are included in the index.

Conclusion

Cybersecurity sits at a crossroads. AI has placed it under scrutiny as a software sector, yet simultaneously strengthened its case as a defense priority. As that tension plays out, the S&P Kensho Cyber Security Index, S&P Kensho Future Security Index and S&P Atlas Security, Defense, and Operational Support Index provide three ways to track this evolving theme, from pure-play cybersecurity to the full breadth of the modern security landscape.

1 The S&P Kensho Global Cyber Security Screened Index extends this benchmark to a global universe of companies, with an additional layer of sustainability-based eligibility criteria required for inclusion.

2 Shift in U.S. Cyber Strategy: What the White House’s New Offensive Cyber Posture Signals for Businesses. Baker Donelson. March 10, 2026.

3 NIS2 Directive: securing network and information systems, European Comission.

4 Outline of the Cybersecurity Strategy. National Cybersecurity Office, Japan. Dec. 23, 2025.

5 The S&P Kensho Global Future Defense Index extends this benchmark to a global universe of companies.

The posts on this blog are opinions, not advice. Please read our Disclaimers.

Beyond Borders: The Significance of the S&P 500 in Options-Based Strategies

Contributor Image
Sue Lee

APAC Head of Index Investment Strategy

S&P Dow Jones Indices

In the U.S. market, options-based ETFs have experienced exponential growth in recent years, with total assets reaching USD 245 billion as of December 2025. These strategies have been increasingly adopted as mainstream tools in portfolio construction, offering more predictable outcomes and income diversification.

Other regions are catching up with this trend at varying rates, with some accelerating rapidly while others are adapting regulations to allow this segment to grow in their local markets. Canada is by far the largest market outside of the U.S., with options-based ETF assets totaling USD 30 billion as of March 2026, followed by South Korea (USD 9 billion) and Europe (USD 8 billion). Hong Kong has also seen rapid expansion, accumulating over USD 4 billion in assets since the debut of its first covered call ETF in early 2024.

While covered call strategies remain dominant in international markets, accounting for 92% of the total assets compared to 62% in the U.S., each market has developed distinct approaches to product design and management. In markets such as Hong Kong, Australia and Canada, options-based ETFs are largely managed actively, mirroring the U.S. where 91% of assets are actively managed.1 Conversely, in markets such as South Korea and Japan, most assets track options-based indices to provide targeted outcomes (see Exhibit 2).

The underlying assets for options being used in ETFs also vary. U.S. benchmarks such as the S&P 500® and Nasdaq 100 are the most popular choices in Europe and Japan, while local indices dominate in Hong Kong. Single-stock options are prevalently used in Canada, while South Korea exhibits a relatively balanced distribution across U.S. indices, local indices, stocks and other asset classes (see Exhibit 3).

Notably, the S&P 500 remains a premier choice in many markets outside of the U.S., thanks to its unparalleled around-the-clock liquidity. These products often tap into the S&P 500 option liquidity2 outside standard U.S. trading hours.  The non-U.S. trading hour3 liquidity has improved significantly, with average daily traded notional4 reaching USD 132 billion in 2025 (see Exhibit 4). This deep, continuous liquidity pool facilitates the effective implementation of various strategies based on S&P 500 options globally, catering to diverse investment objectives and preferences.

For a deeper dive into the index framework of options-based strategies, see “Defining Paths with Options-Based Index Strategies.”

1 Note that some ETFs are run in a manner that is notably different to traditional active management. For example, a fund described as active may exclusively use S&P 500-linked derivatives and exhibit performance very similar to an index representing the overall strategy.

2 See Edwards, Tim et al. “The Liquidity Landscape: Trading Linked to S&P DJI Indices,” S&P Dow Jones Indices.

3 Non-U.S. trading hour refers to 5:00 pm to 8:00 am Central Time for E-mini S&P 500 options and Micro E-mini S&P 500 options traded on CME and 7:15 pm to 8:25 am Central Time for S&P 500 Index options (SPX) and Mini-SPX Index options (XSP) traded on Cboe.

4 Dailly traded notional is calculated as index price x contract size x number of contracts traded for the day, with no delta adjustments.

The posts on this blog are opinions, not advice. Please read our Disclaimers.

The Evolution of Fixed Income Indexing: A Look over 25 Years

Contributor Image
Hannah Abrams

Analyst, Fixed Income Product Management

S&P Dow Jones Indices

Over the past 25 years, the iBoxx EUR indices have evolved alongside the market they were built to measure (see Exhibit 1).

The journey began in 2000 with the launch of the iBoxx EUR Sovereigns, at a time when the eurozone bond market was still taking shape and investors were looking for transparent benchmarks. As the market expanded, new building blocks followed, including the iBoxx EUR Collateralized, iBoxx Sub‑Sovereigns and iBoxx Corporates. These eventually came together under the iBoxx EUR Overall, which was introduced to provide a single view of the EUR‑denominated bond universe.

A turning point came in July 2012, during the eurozone sovereign crisis. Disagreements between rating agencies were creating volatility and liquidity concerns, and the use of the lowest rating in index rules amplified these issues. The switch to an average rating was introduced to address this, offering a more balanced and stable way of assessing credit quality within the indices.

Another step in the evolution arrived in August 2023 with the introduction of a dedicated renewable energy sector classification. This reflected both the rapid growth in issuances linked to renewable energy projects and the shift in investor focus, supported by policy changes such as the EU raising its 2030 renewable energy target from 32% to 45%.1, 2, 3 Recognizing renewable energy as its own sector ensured that the indices reflected a part of the market with distinct characteristics, risk profiles and growing strategic importance.

The most recent development came in March 2026, when an 18‑month minimum initial time to maturity was introduced to align the iBoxx EUR indices with industry practice and remove short‑dated bonds that offered limited contribution to the index profile.

The long-term performance of the iBoxx EUR Overall illustrates how the index has changed over 25 years of shifting market conditions (see Exhibit 2).

Market size and issuance have grown increasingly over the past 25 years (see Exhibit 3). As the iBoxx EUR indices expanded to reflect larger segments of the investable market, this growth reflected a series of major macro events, including quantitative easing, the sovereign debt crisis and the broader influence of central bank policy. The iBoxx EUR Overall index has grown alongside these developments, both responding to them and being shaped by the shifts in liquidity, yields and issuance patterns that followed.

The rise in notional amounts highlights not only the increase in issuance and market liquidity, but also the expansion of ESG and green bonds, the development of new corporate sub-sectors and the inclusion of a wider range of bond types. As the investable universe broadened and investor demand increased, fixed income indexing evolved to incorporate these instruments, ensuring that the indices reflected a larger and more diverse portion of the market with meaningful growth potential.

We see duration shorten across other key index series including the iBoxx GBP Overall and iBoxx USD Overall, reflecting a market that has steadily moved toward shorter maturities (see Exhibit 4). Repeated macro shocks, post‑crisis regulation and the shift away from years of unusually low rates pushed issuers to favor shorter, more flexible borrowing, and fixed income indices have naturally followed as the composition of the investable universe has shifted.

The iBoxx EUR series began with a strong focus on sovereigns, and this is reflected in the early composition of the index, where sovereigns accounted for 73% of the universe in 2001. Over time, this dominance eased to 64% in 2026 as new and more specialized corporate subsectors began to emerge. As the market broadened, the index evolved into a more diversified and representative view of the investable EUR bond universe.

We see the appearance and gradual growth of corporate subsectors such as Technology, Energy, Real Estate and Health Care (see Exhibit 5). These developments coincided with several structural shifts in the market: the rise of REITs issuing EUR debt, increased capital‑raising from Technology firms as cyber- and AI‑related investment accelerated, and the expansion of the Energy sector as renewable energy developers issued bonds to finance large‑scale infrastructure projects. Together, these changes reflect how the index adapted to reflect new sources of issuance and the evolving shape of the European economy.

The additional financial classifications are particularly notable. Following the 2008 Global Financial Crisis, regulation reshaped the Financial Services sector and exposed the need for clearer distinctions between different types of issuers. As banks, insurers and other financial institutions issued increasingly varied forms of debt, the index methodology evolved to separate these categories, improving the accuracy and relevance of sector representation.

The past 25 years highlight how fixed income indexing has evolved with changes in market structure. Looking ahead, infrastructure investment, hyperscalers, data‑center expansion, emerging corporate subsectors and the shift of private‑market‑style structures into public markets are all likely to guide how classifications, subsectors and bond‑type coverage develop, and the iBoxx indices will continue to evolve to reflect these themes as they take shape.

1Renewable energy,” Fact Sheets on the European Union. European Parliament.

2EU Market Outlook for Solar Power 2023-2027.” Solar Power Europe, Dec. 12, 2023.

3 For more information, please see the iBoxx EUR Benchmark Index Methodology.

The posts on this blog are opinions, not advice. Please read our Disclaimers.