Get Indexology® Blog updates via email.

In This List

The Significance of Select Sectors to APAC

Using Select Sectors to Evaluate Opportunities and Risks

Indexing Modern Income: Covered Calls Uncovered

S&P 500 Catholic Values Index: 10 Years and Counting – Part 1

Introducing the S&P MERVAL Index (MEP): A Local USD View of Argentina’s Equity Market

The Significance of Select Sectors to APAC

Contributor Image
Liam Flaherty

Senior Analyst, Index Investment Strategy

S&P Dow Jones Indices

As investors across the globe have wrestled with the impact of AI on the U.S. tech sector, valuation concerns, inflation jitters and more, U.S. markets have underperformed their Pan Asian peers. The S&P 500® has trailed the S&P Pan Asia BMI by 8% YTD,1 however the tide may be turning. Thanks to optimism surrounding easing geopolitical concerns, The 500® notched a record high on April 15, 2026.

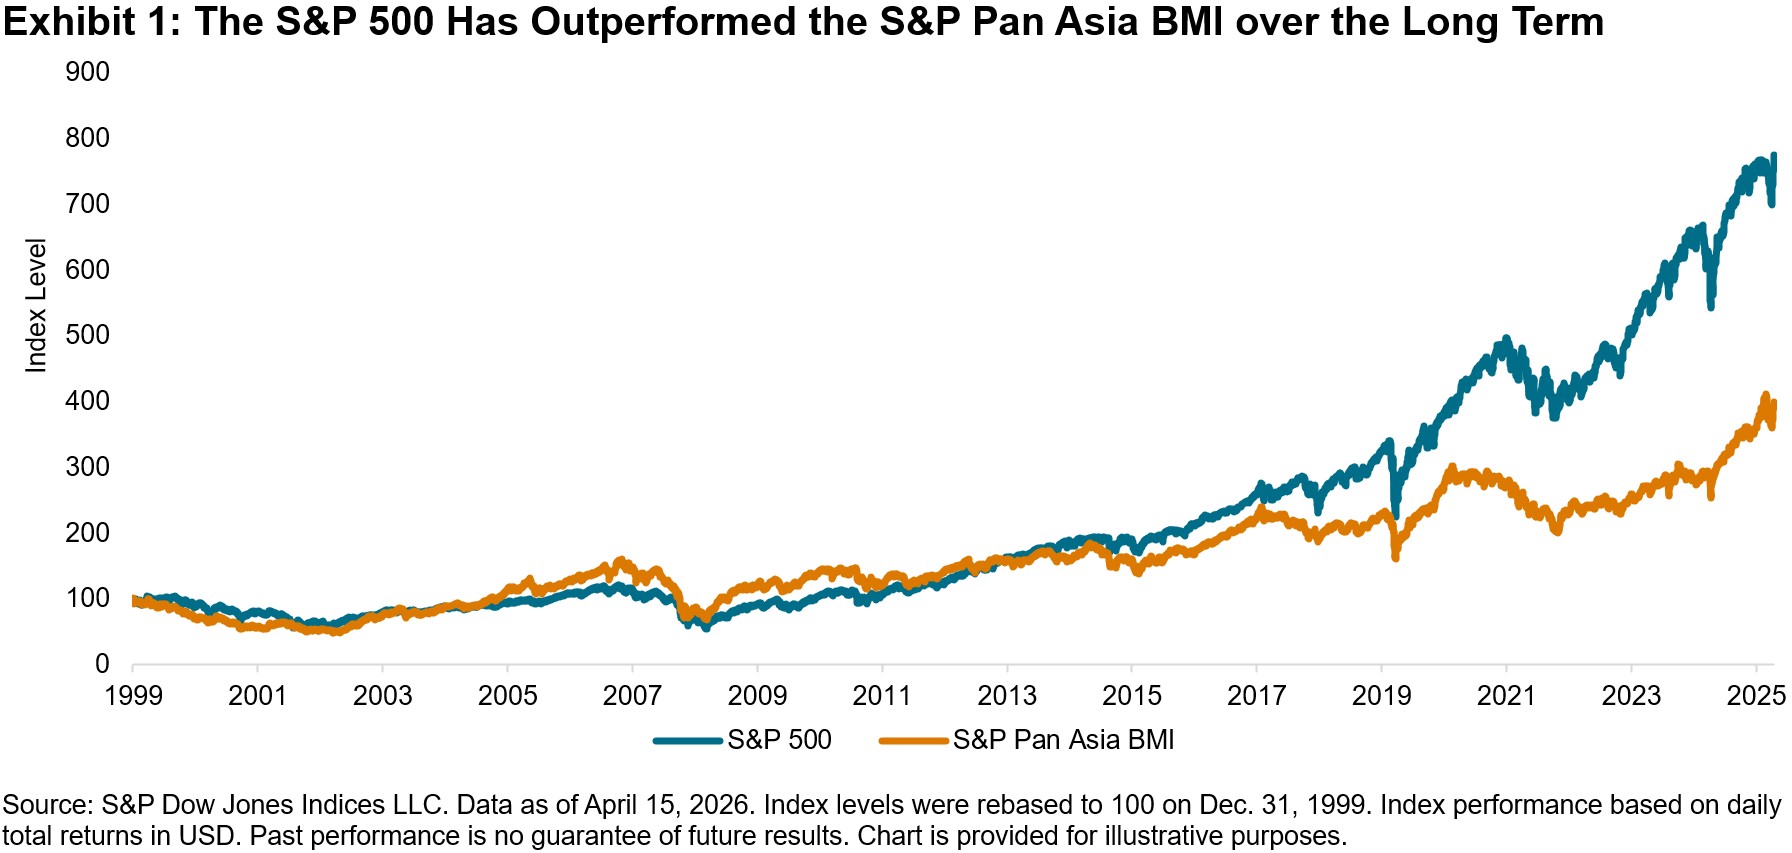
Notwithstanding recent market gyrations, U.S. equities have outperformed their Pan Asian counterparts over the long term,2 with the S&P 500 outperforming the S&P Pan Asia BMI by a cumulative 360% since 2000.

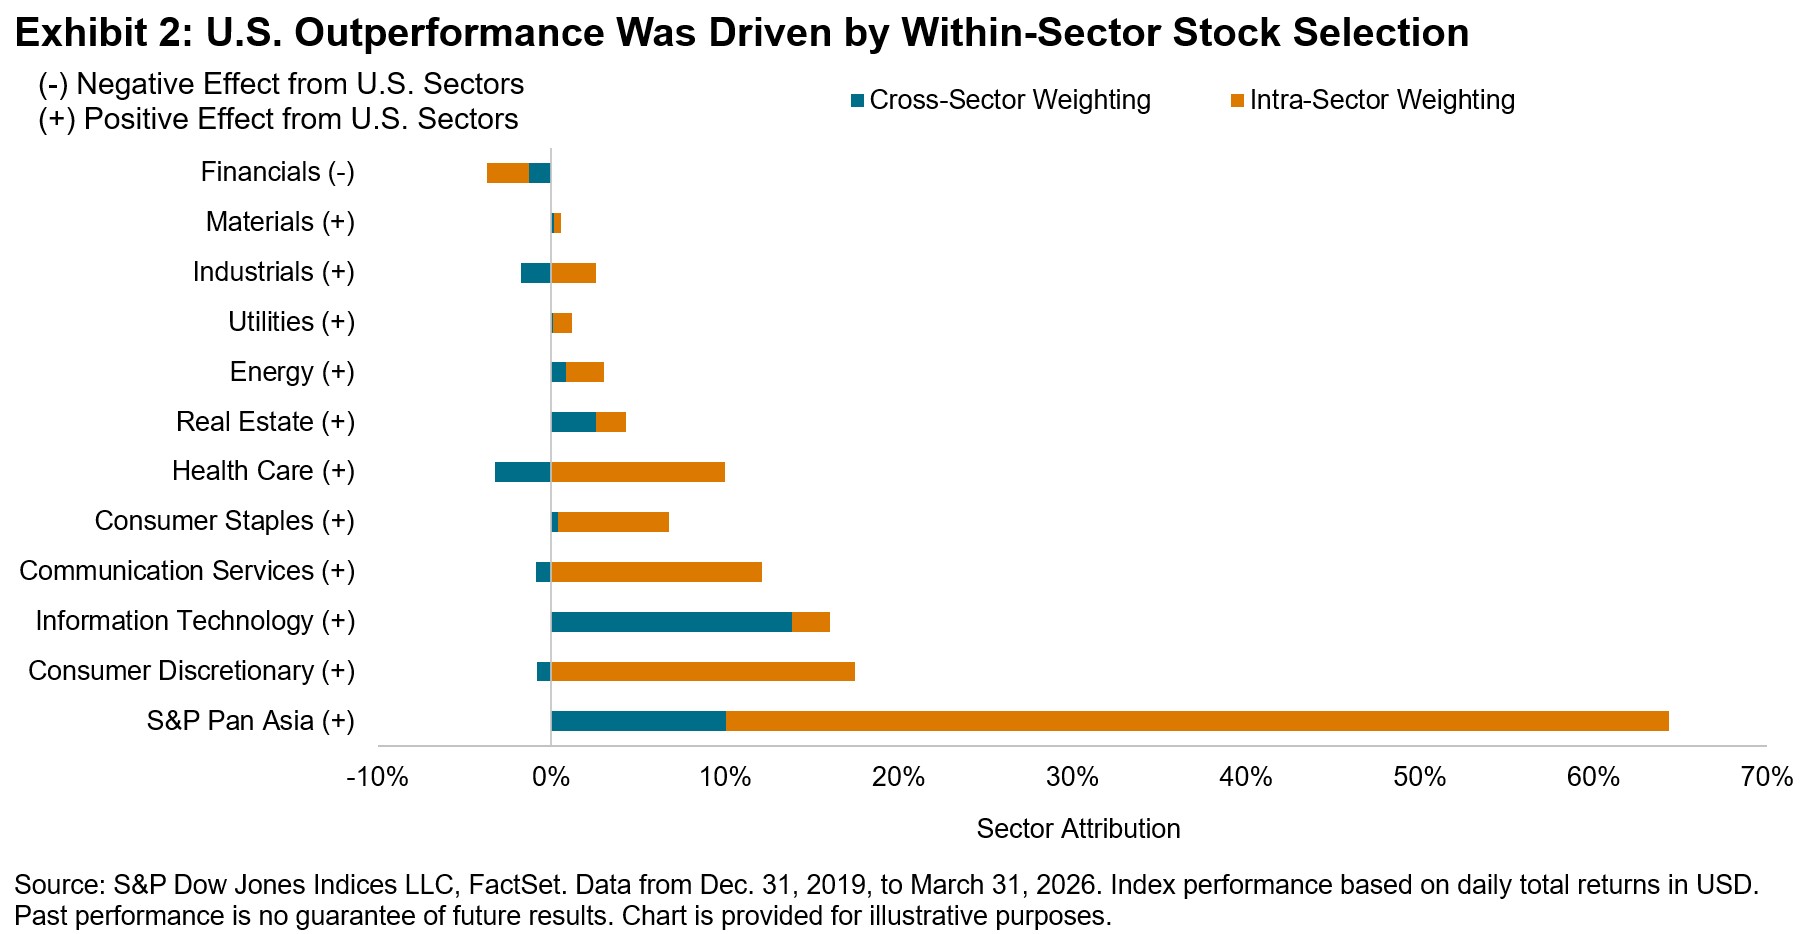
Considering that U.S.-domiciled stocks accounted for a majority of the market cap in 10 of the 11 sectors in the S&P Global BMI as of year-end 2024,3 adopting a sectoral perspective4 can be helpful to understand the sources of U.S. equity outperformance compared with equities in Pan Asia. Exhibit 2 shows that much of this outperformance can be attributed to within-sector stock selection, particularly in the Consumer Discretionary and Communication Services sectors, which house many of the Big Tech names that have dramatically outperformed in recent years.

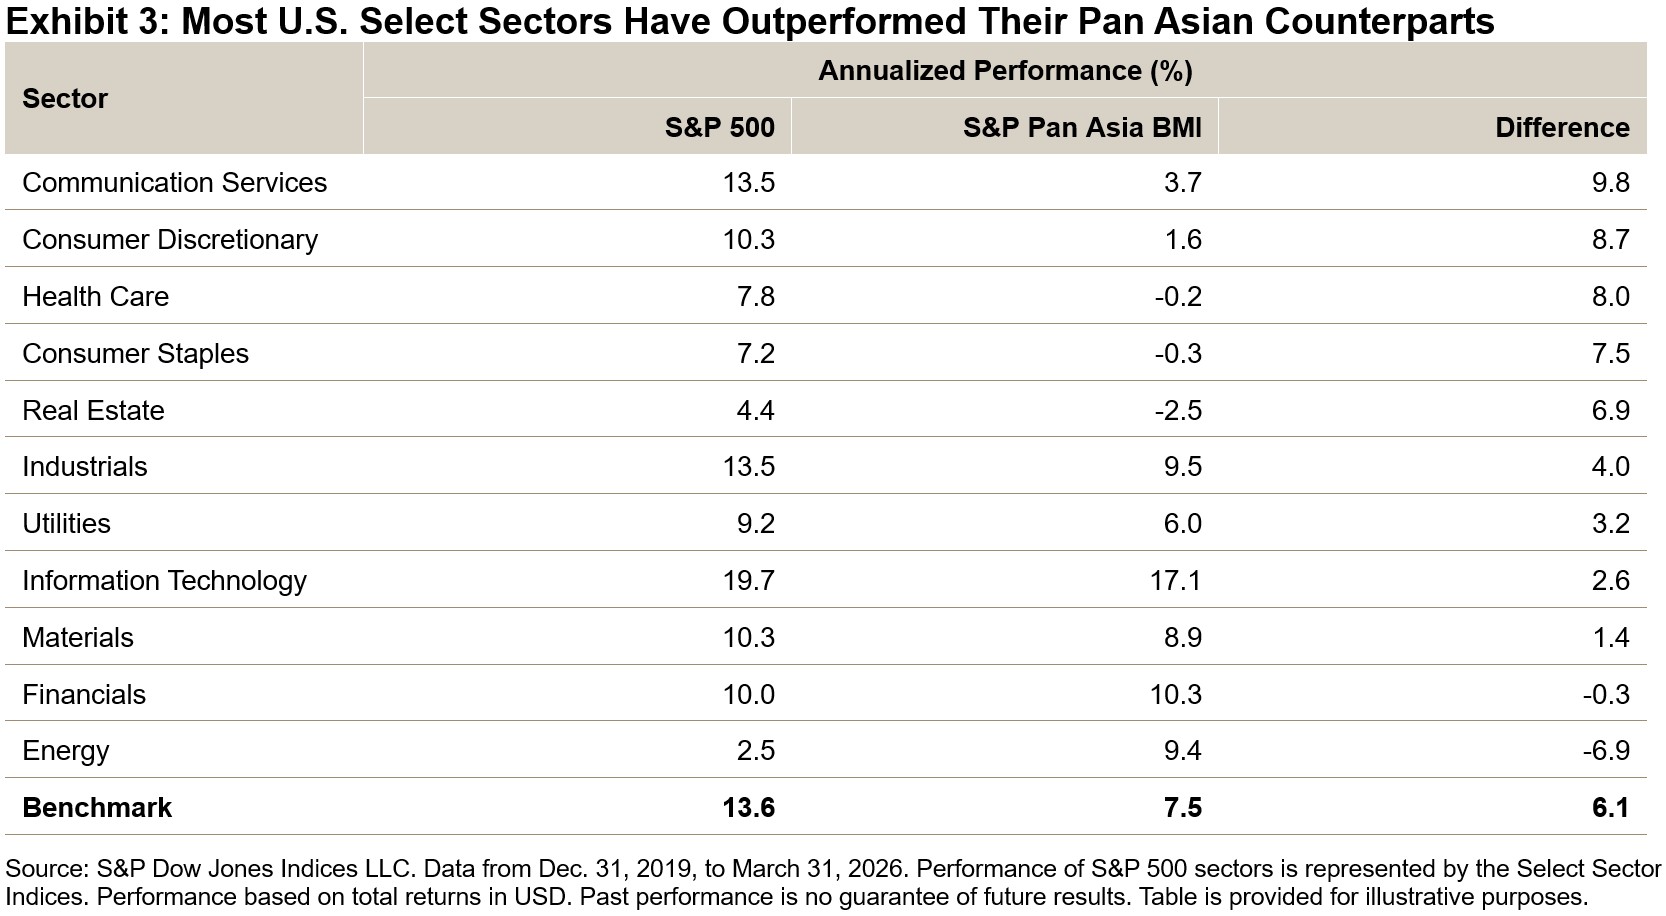
On a more granular level, Exhibit 3 compares the performance of S&P Pan Asia BMI sectors versus the Select Sector Indices, which track the performance of S&P 500 sectors while capping the weight of individual stocks. The exhibit shows that 9 of the 11 Select Sector Indices outperformed S&P Pan Asia BMI sectors and 8 of the 11 Select Sector Indices outperformed the S&P Pan Asia BMI overall. Outperformance was led by the Communication Services and Consumer Discretionary sectors, consistent with the results observed in Exhibit 2.

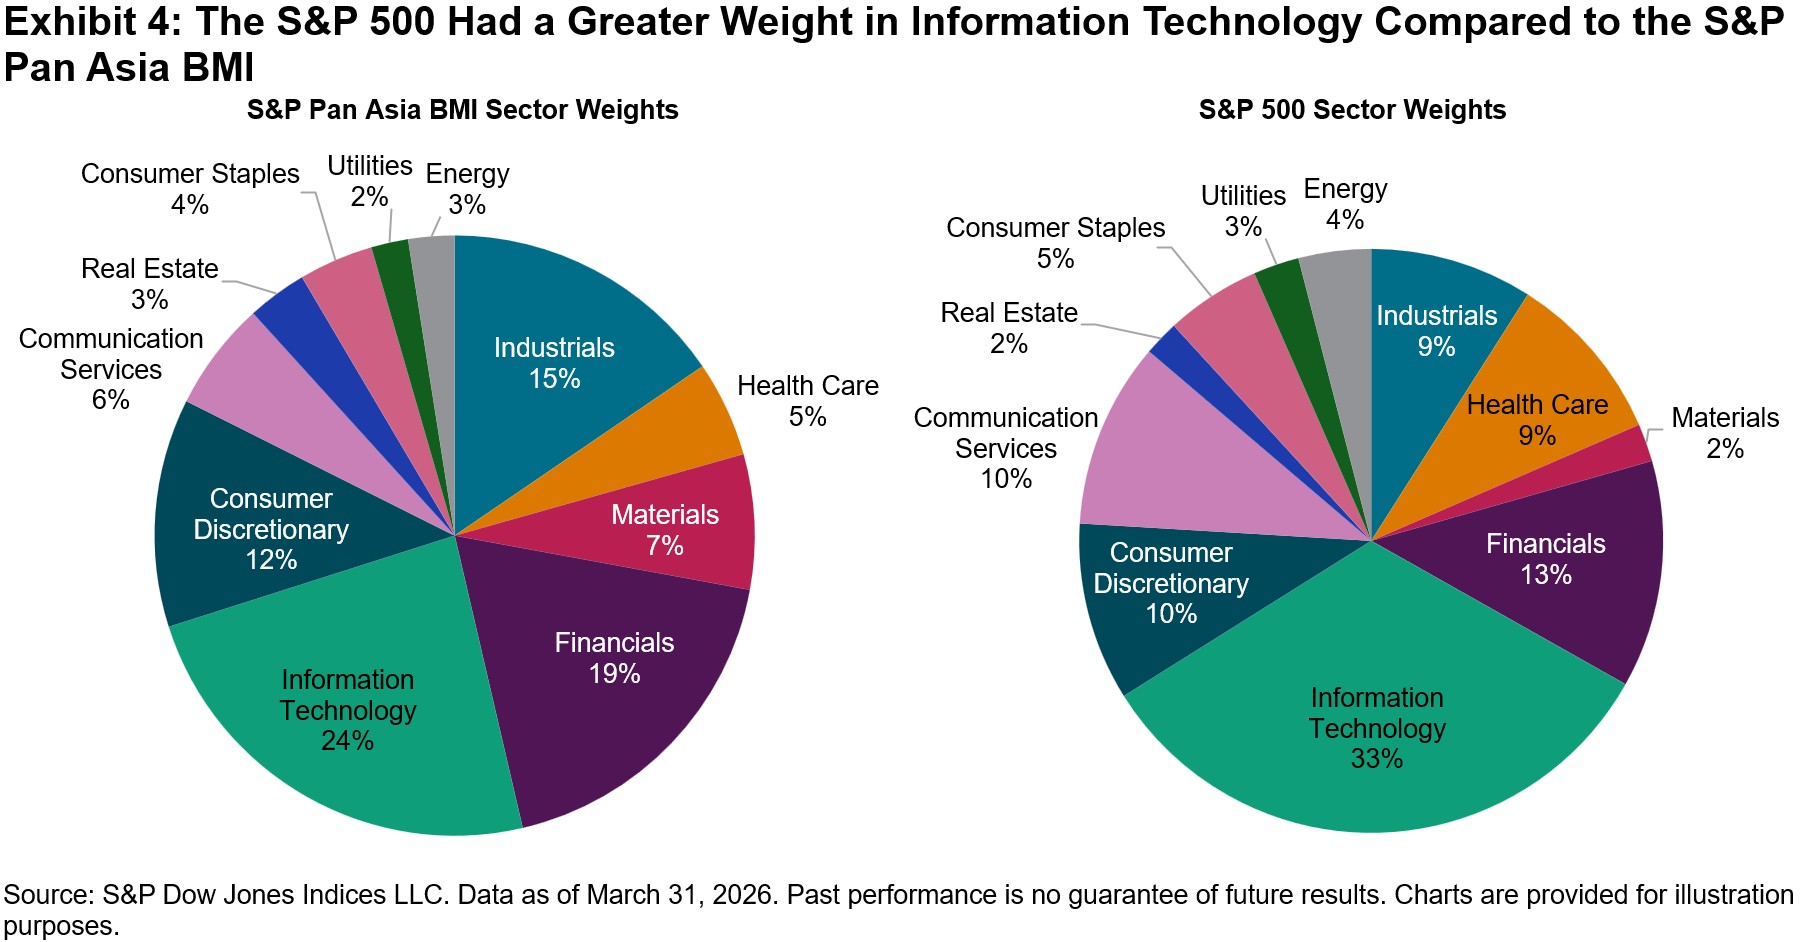
In addition to outperformance from stock selection within sectors, the attribution in Exhibit 2 shows that the U.S. also benefited from selection across sectors, particularly in Information Technology, which contributed more than one-fifth of U.S. outperformance relative to Pan Asia. Exhibit 4 compares the sector weights of the S&P 500 and the S&P Pan Asia BMI. The U.S. had a greater weight in the Information Technology sector, while S&P Pan Asia had greater weights in Industrials and Financials.

The Select Sector Indices can provide APAC investors with a framework for analyzing U.S. sector-level performance, and provide insights into sectors that include some of the largest companies in the world.

1 As of April 15, 2026.

2 Pathak, Amit. “Why Does The S&P 500 Matter to APAC?” S&P Dow Jones Indices LLC. April 25, 2025.

3 Weng, Fei. “U.S. Sector Relevance to China.” S&P Dow Jones Indices LLC. March 6, 2024.

4 Flaherty, Liam. “Stocks, Sectors and Success?” S&P Dow Jones Indices LLC. Feb. 3, 2026.


The posts on this blog are opinions, not advice. Please read our Disclaimers.

Using Select Sectors to Evaluate Opportunities and Risks

What’s the relevance of U.S. sectors globally in the current landscape? Join S&P DJI’s Hamish Preston and State Street Investment Management’s Matt Bartolini as they explore the Select Sector Indices and how they are helping market participants evaluate and express sector views across evolving market conditions. 

The posts on this blog are opinions, not advice. Please read our Disclaimers.

Indexing Modern Income: Covered Calls Uncovered

Contributor Image
Sue Lee

Director and APAC Head of Index Investment Strategy

S&P Dow Jones Indices

Capital markets offer several primary sources of income to investors, including money market interest, bond coupons and stock dividends. Alternative sources of income abound and, most recently, innovation within the exchange-traded fund (ETF) industry has introduced options-based income strategies to a wider range of market participants.

In the U.S., investors both large and small have long used options markets to generate income, either by trading options directly or indirectly through structured products.1 In more recent years, options-based ETFs have also found popularity, as a range of strategies collectively known as “covered call” (or “buy-write”) strategies are increasingly used to generate income, dampen volatility and enhance risk-adjusted performance in certain market regimes. So, how do they work, and what is their role in generating income?

What Does a Covered Call Really Do?

A covered call strategy combines:

  • An investment in an asset (e.g., a portfolio tracking the S&P 500®); and
  • The sale (writing) of a call option on the same (or correlated) asset.

By selling call options, the investor receives an upfront premium, and any amounts owed on the call option (occurring if the underlying asset rises above the strike price) are “covered” by the profits of the first investment. The regular repeat of such sales can provide a relatively steady income stream, with the natural trade-off that the investor will not simultaneously benefit fully from price gains in the asset, since all or a portion of those gains are offset by losses on the sold options.

Simply put, covered call strategies exchange some upside potential for option premium income, narrowing the range of outcomes. This trade-off is illustrated through the monthly performance comparison of the S&P 500 at-the-money monthly covered call strategyas measured by the Cboe S&P 500 BuyWrite Index (BXM)versus the S&P 500 over a 20-year period (see Exhibit 1).2 For example, over the recent six monthly rolls between Sept. 19, 2025, and March 20, 2026, the BXM’s monthly performance ranged between -3.8% to 3.1% compared to the S&P 500’s range between -5.0% and 2.5%, with the former outperforming in five out of six months.

Why Covered Calls?

The appeal of covered calls extends beyond simple income generation and volatility reduction. Option premiums can provide a distinct income stream that is less correlated with traditional sources such as bonds and dividends. Bond income is sensitive to interest rate policy, and dividend income can be reduced during economic downturns (while dividend yields tend to be driven more by price effects).

Option premiums, by contrast, are primarily driven by market volatility.3 When markets sell off, volatility typically rises, leading to higher option premiums. This was evident during the 2008 Global Financial Crisis and the 2020 COVID-19 pandemic (periods shaded in blue in Exhibit 2), when interest rates fell toward zero but increased volatility boosted option income. Notably, option premiums have also remained relatively elevated in recent years, even as dividend yields declined to decade lows (the period shaded in red in Exhibit 2).

Covered calls have historically helped support portfolio income when other sources were under pressure, making them a valuable tool for building resilient income.

Design Matters: Variations and Implementation

There are many possible variations of covered call strategies across different maturities and strike prices, and outcomes can vary materially depending on the design of the strategy. The S&P 500’s deep and robust derivatives ecosystem enables effective implementations of various strategies, catering to changing market environments and investor needs. It is important to carefully assess each component of the strategy, for both product issuers and investors, to find the optimal approach that can help achieve desired outcomes.

For a deeper dive into the index-based framework of covered call strategies, see “Defining Paths with Options-Based Index Strategies.”

1   According to SRP, the U.S. structured notes market reached USD 150 billion in 2024, up 46% from the previous year.

2   For details on the index construction, see the BXM index methodology.

3   Options market often exhibits a “volatility premium”—a tendency for implied volatility (the level of volatility reflected in option prices) to exceed the actual volatility that occurs. This phenomenon is largely driven by supply and demand imbalances in the options market (see Defining Paths with Options-Based Index Strategies for more details). Covered call strategies seek to harvest this volatility premium by regularly selling call options, aiming to profit from the persistent gap between market expectations and realized outcomes.

The posts on this blog are opinions, not advice. Please read our Disclaimers.

S&P 500 Catholic Values Index: 10 Years and Counting – Part 1

Contributor Image
Maria Sanchez

Director, Sustainability Index Product Management, U.S. Equity Indices

S&P Dow Jones Indices

For over a decade, the S&P 500® Catholic Values Index has served as a rules-based tool to help market participants that seek to align their investments with their values. The index was officially launched on Aug. 10, 2015, and excludes companies involved in activities inconsistent with the Socially Responsible Investment Guidelines of the U.S. Conference of Catholic Bishops (USCCB).1

To ensure ongoing adherence to these guidelines, S&P Dow Jones Indices consults with Father Séamus Finn O.M.I., Chief of Faith Consistent Investing at the Oblate International Pastoral Investment Trust, regarding the consistency of the S&P 500 Catholic Values Index methodology with USCCB standards.

As shown in Exhibit 1, the performance of the S&P 500 Catholic Values Index has closely tracked that of its benchmark, the S&P 500, reflecting its broad market coverage. However, it is intentionally not identical, as its methodology (summarized in Exhibit 2) applies specific values-based exclusions that differentiate its composition.

The index’s evolution reflects S&P DJI’s continuous methodology monitoring, including the 2023 expansion of exclusions for companies with business activities in gambling, tobacco and cannabis—ensuring alignment with the updated USCCB guidelines. In addition to updates in guidelines and best practices, the methodology has also evolved to leverage improved data, enabling a more efficient implementation of the USCCB guidelines, and it has been refined to minimize deviations from the S&P 500 by adjusting rebalancing schedules and incorporating a forward-looking universe.3

The 10th anniversary of the S&P 500 Catholic Values Index marks a significant milestone in the evolution of values-based indexing. Its ongoing evolution underscores the index’s capacity to balance values alignment with broad market coverage, reinforcing its relevance for those seeking to integrate faith-based principles into their investment approach.


1 Socially Responsible Investment Guidelines 2021

2 For the full list of exclusions, see the index methodology.

3 S&P Catholic Values Indices Rebalancing Methodology Update.

4 For the full list of changes, see the index methodology.

The posts on this blog are opinions, not advice. Please read our Disclaimers.

Introducing the S&P MERVAL Index (MEP): A Local USD View of Argentina’s Equity Market

Contributor Image
Eduardo Olazabal

Associate Director, Global Exchange Indices

S&P Dow Jones Indices

The S&P MERVAL Index is Argentina’s flagship equity index and the main reference used by market participants to measure the performance of that market. However, in a high-inflation environment, Argentine peso returns can become distorted, so investors often look at returns in U.S. dollars. This raises an important question: in a market with high inflation and multiple exchange rates, which foreign exchange (FX) reference best reflects “real” USD performance?

To add a widely used FX conversion lens for Argentina equities, S&P Dow Jones Indices launched the S&P MERVAL Index (MEP), which complements the existing S&P MERVAL Index (ARS) by converting gains using the Mercado Electrónico de Pagos (MEP) exchange rate, a key reference in local financial markets.

Understanding Argentina’s Multiple FX Rates: Why USD Performance Can Differ

Argentina has long operated with multiple FX rates shaped by regulation, access conditions and market pricing. As a result, converting an equity index from ARS to USD isn’t universal, but rather depends on the FX reference used.

Broadly, FX rates tend to fall into two groups:

  • Official/regulated rates: Set or constrained by policy and eligibility rules; and
  • Financial/market-implied rates: Derived from prices of locally traded securities.

The MEP rate is a market-implied financial FX rate, typically inferred by buying a security in pesos and selling the same (or equivalent) security locally in U.S. dollars. Because it comes from traded prices, it can diverge, sometimes materially, from official rates.

Why Launch the S&P MERVAL Index (MEP) and What’s Different versus the S&P MERVAL Index (USD)?

The S&P MERVAL Index (MEP) was launched to provide a version of the S&P MERVAL Index that uses a USD/ARS exchange rate derived from local market pricing. This differs from the existing S&P MERVAL (USD) series, which uses the WMR FX rate (calculated by Reuters/LSEG).

Exhibits 2 and 3 demonstrate that the choice of conversion mechanism can materially affect observed USD outcomes, particularly over intermediate and long-term horizons. Recent regulatory changes have increased flexibility in currency conversion, causing the official rate and MEP rate to converge over the past year. However, longer-term performance differences remain significant. For example, one-year performance differed substantially: -0.5% for the S&P MERVAL Index (USD) versus 18.2% for the S&P MERVAL Index (MEP). Similarly, annualized performance diverged over longer periods, with three-year gains of 22.6% for the S&P MERVAL Index (USD) versus 50.3% for the S&P MERVAL Index (MEP), and five-year gains of 33.0% versus 44.2%, respectively.

Conclusion

The launch of the S&P MERVAL Index (MEP) expands the toolkit for analyzing Argentine equities by recognizing that, in a multi-rate FX environment, USD performance depends on the FX reference used. By pairing the existing USD series with a MEP-based version and viewing both alongside the ARS version, it’s possible to more clearly separate equity market moves from currency and inflation translation effects.

The posts on this blog are opinions, not advice. Please read our Disclaimers.