Get Indexology® Blog updates via email.

In This List

S&P 500 Catholic Values Index: 10 Years and Counting – Part 1

Introducing the S&P MERVAL Index (MEP): A Local USD View of Argentina’s Equity Market

2025: A Market for Stock Pickers in France?

Leveraged Loan Market Snapshot

One to Forget: SPIVA Europe U.K. Equity Active Fund Performance in 2025

S&P 500 Catholic Values Index: 10 Years and Counting – Part 1

Contributor Image
Maria Sanchez

Director, Sustainability Index Product Management, U.S. Equity Indices

S&P Dow Jones Indices

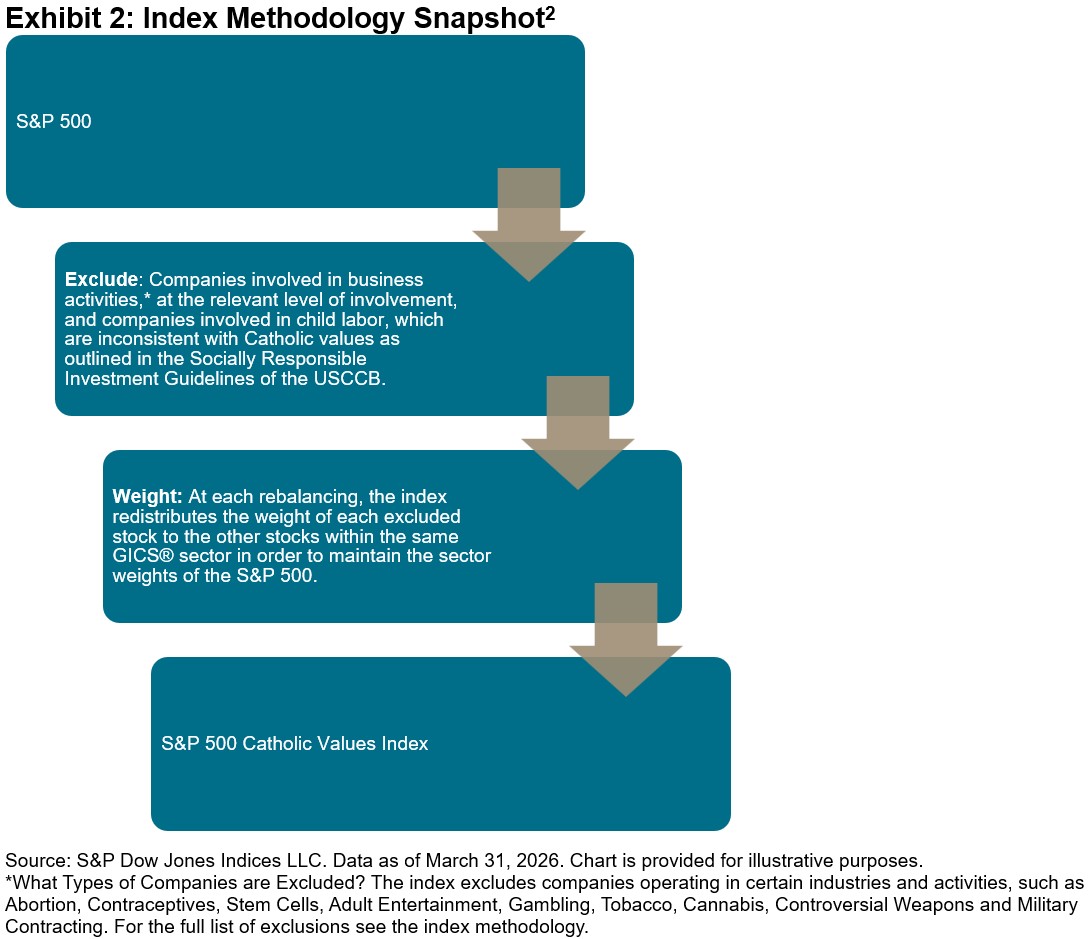
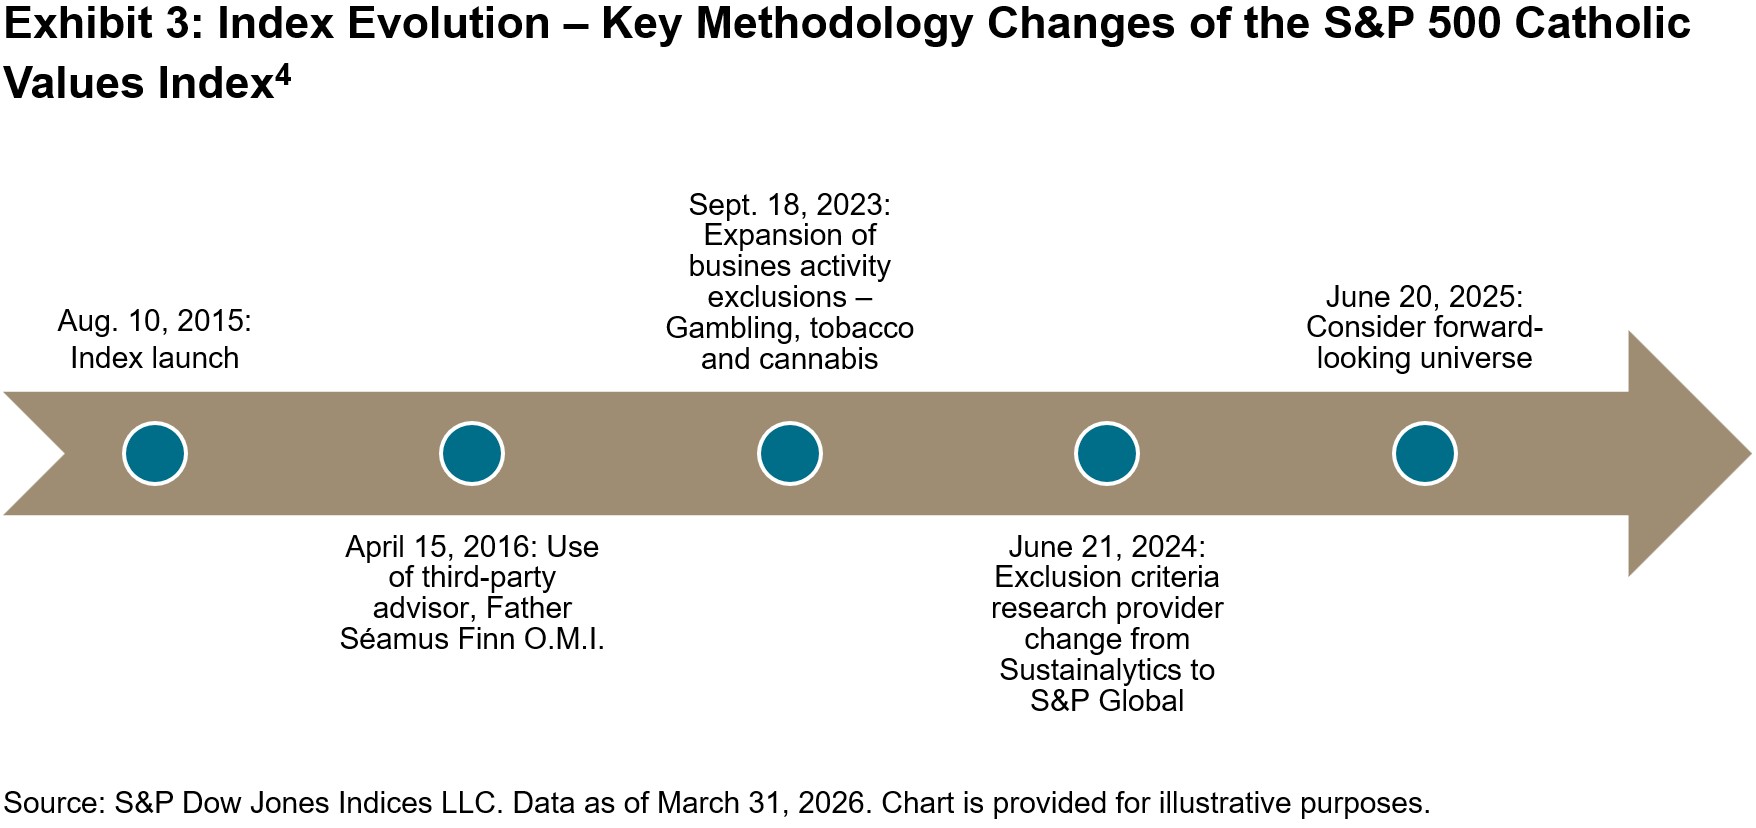
For over a decade, the S&P 500® Catholic Values Index has served as a rules-based tool to help market participants that seek to align their investments with their values. The index was officially launched on Aug. 10, 2015, and excludes companies involved in activities inconsistent with the Socially Responsible Investment Guidelines of the U.S. Conference of Catholic Bishops (USCCB).1

To ensure ongoing adherence to these guidelines, S&P Dow Jones Indices consults with Father Séamus Finn O.M.I., Chief of Faith Consistent Investing at the Oblate International Pastoral Investment Trust, regarding the consistency of the S&P 500 Catholic Values Index methodology with USCCB standards.

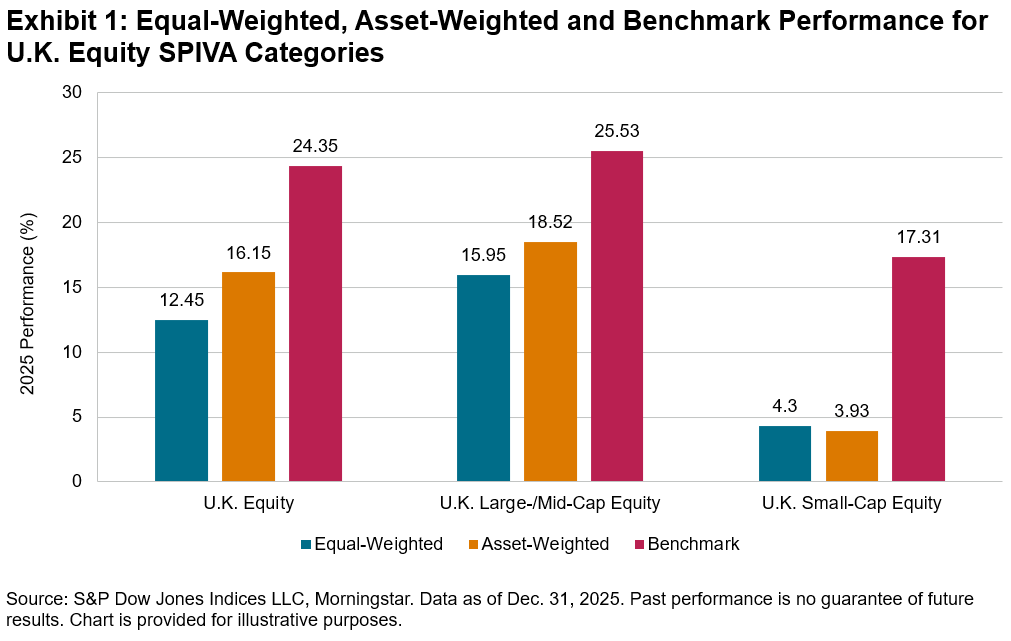
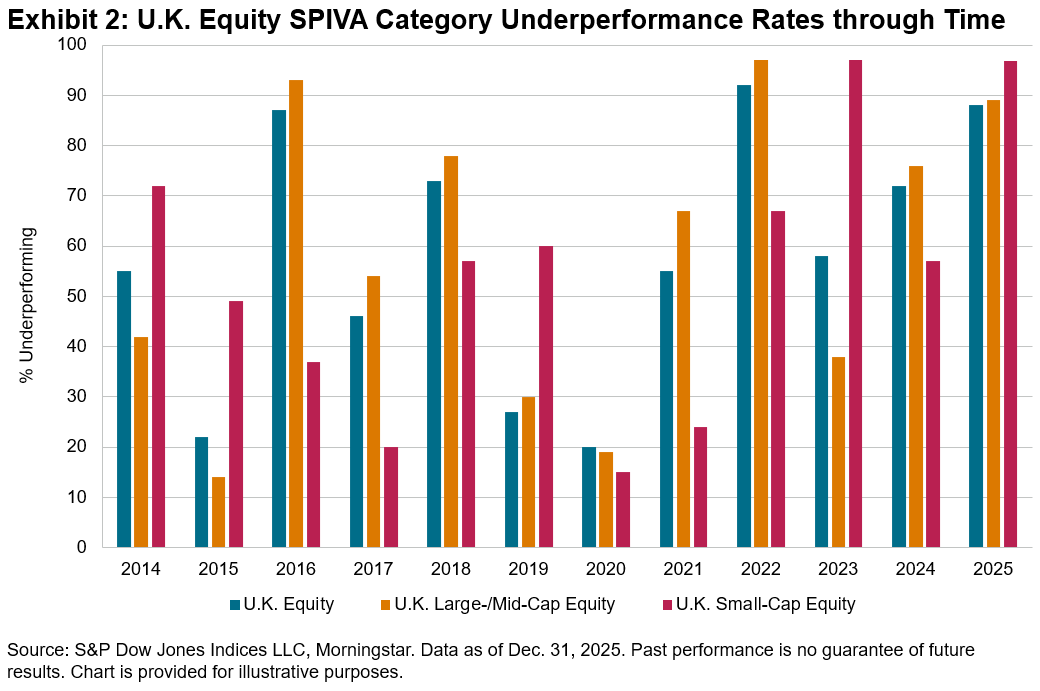
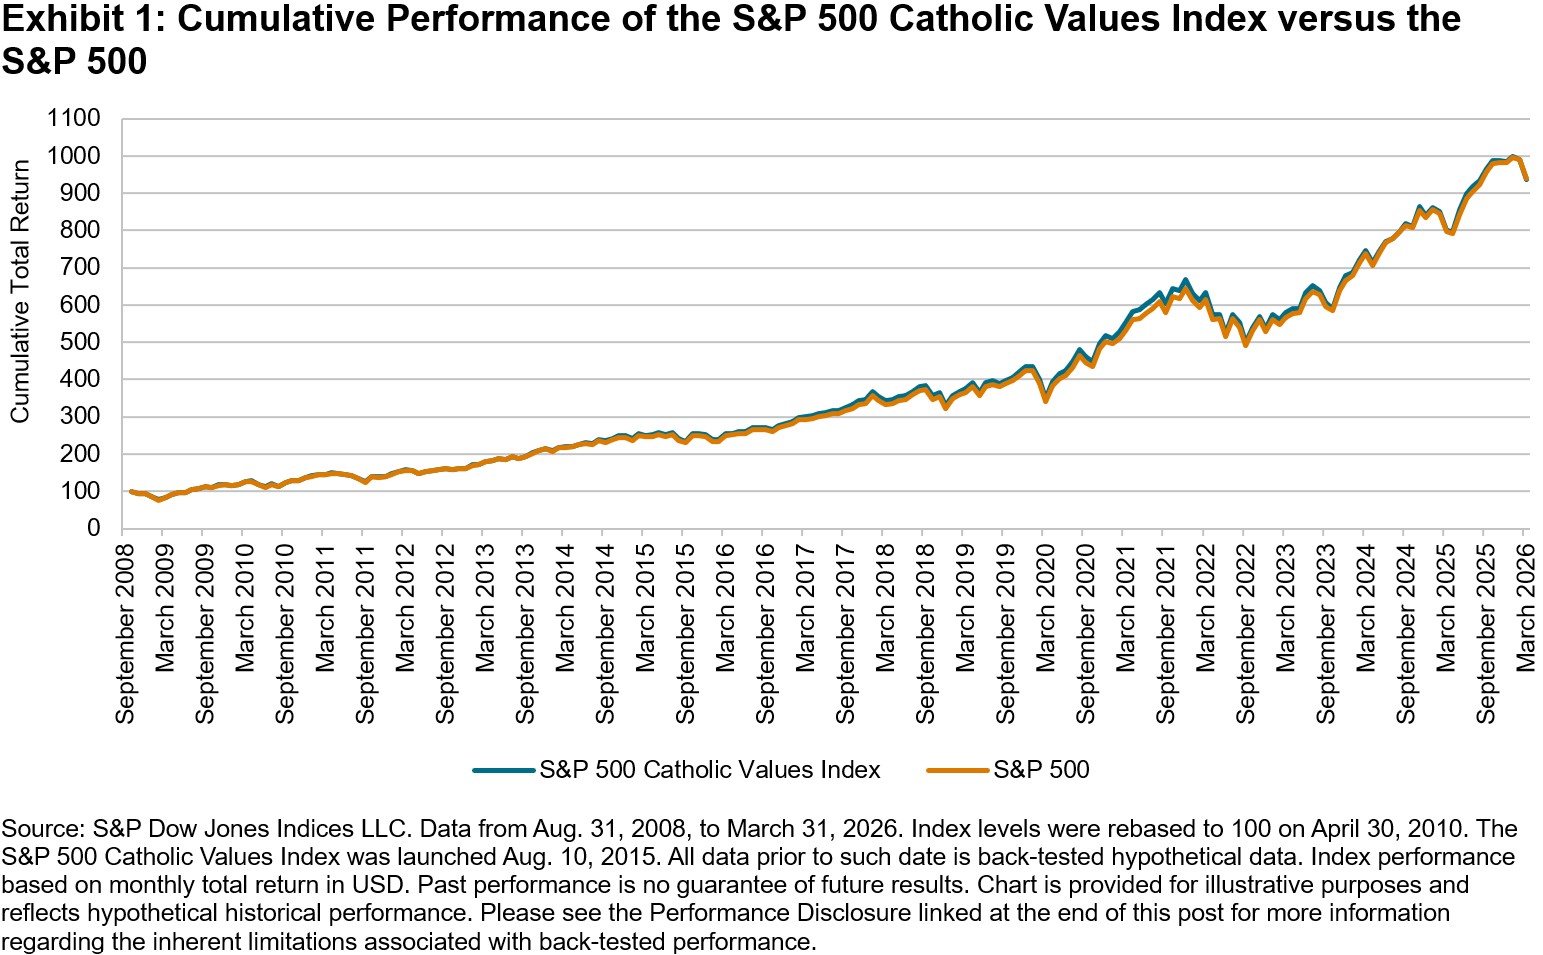
As shown in Exhibit 1, the performance of the S&P 500 Catholic Values Index has closely tracked that of its benchmark, the S&P 500, reflecting its broad market coverage. However, it is intentionally not identical, as its methodology (summarized in Exhibit 2) applies specific values-based exclusions that differentiate its composition.

The index’s evolution reflects S&P DJI’s continuous methodology monitoring, including the 2023 expansion of exclusions for companies with business activities in gambling, tobacco and cannabis—ensuring alignment with the updated USCCB guidelines. In addition to updates in guidelines and best practices, the methodology has also evolved to leverage improved data, enabling a more efficient implementation of the USCCB guidelines, and it has been refined to minimize deviations from the S&P 500 by adjusting rebalancing schedules and incorporating a forward-looking universe.3

The 10th anniversary of the S&P 500 Catholic Values Index marks a significant milestone in the evolution of values-based indexing. Its ongoing evolution underscores the index’s capacity to balance values alignment with broad market coverage, reinforcing its relevance for those seeking to integrate faith-based principles into their investment approach.


1 Socially Responsible Investment Guidelines 2021

2 For the full list of exclusions, see the index methodology.

3 S&P Catholic Values Indices Rebalancing Methodology Update.

4 For the full list of changes, see the index methodology.

The posts on this blog are opinions, not advice. Please read our Disclaimers.

Introducing the S&P MERVAL Index (MEP): A Local USD View of Argentina’s Equity Market

Contributor Image
Eduardo Olazabal

Associate Director, Global Exchange Indices

S&P Dow Jones Indices

The S&P MERVAL Index is Argentina’s flagship equity index and the main reference used by market participants to measure the performance of that market. However, in a high-inflation environment, Argentine peso returns can become distorted, so investors often look at returns in U.S. dollars. This raises an important question: in a market with high inflation and multiple exchange rates, which foreign exchange (FX) reference best reflects “real” USD performance?

To add a widely used FX conversion lens for Argentina equities, S&P Dow Jones Indices launched the S&P MERVAL Index (MEP), which complements the existing S&P MERVAL Index (ARS) by converting gains using the Mercado Electrónico de Pagos (MEP) exchange rate, a key reference in local financial markets.

Understanding Argentina’s Multiple FX Rates: Why USD Performance Can Differ

Argentina has long operated with multiple FX rates shaped by regulation, access conditions and market pricing. As a result, converting an equity index from ARS to USD isn’t universal, but rather depends on the FX reference used.

Broadly, FX rates tend to fall into two groups:

  • Official/regulated rates: Set or constrained by policy and eligibility rules; and
  • Financial/market-implied rates: Derived from prices of locally traded securities.

The MEP rate is a market-implied financial FX rate, typically inferred by buying a security in pesos and selling the same (or equivalent) security locally in U.S. dollars. Because it comes from traded prices, it can diverge, sometimes materially, from official rates.

Why Launch the S&P MERVAL Index (MEP) and What’s Different versus the S&P MERVAL Index (USD)?

The S&P MERVAL Index (MEP) was launched to provide a version of the S&P MERVAL Index that uses a USD/ARS exchange rate derived from local market pricing. This differs from the existing S&P MERVAL (USD) series, which uses the WMR FX rate (calculated by Reuters/LSEG).

Exhibits 2 and 3 demonstrate that the choice of conversion mechanism can materially affect observed USD outcomes, particularly over intermediate and long-term horizons. Recent regulatory changes have increased flexibility in currency conversion, causing the official rate and MEP rate to converge over the past year. However, longer-term performance differences remain significant. For example, one-year performance differed substantially: -0.5% for the S&P MERVAL Index (USD) versus 18.2% for the S&P MERVAL Index (MEP). Similarly, annualized performance diverged over longer periods, with three-year gains of 22.6% for the S&P MERVAL Index (USD) versus 50.3% for the S&P MERVAL Index (MEP), and five-year gains of 33.0% versus 44.2%, respectively.

Conclusion

The launch of the S&P MERVAL Index (MEP) expands the toolkit for analyzing Argentine equities by recognizing that, in a multi-rate FX environment, USD performance depends on the FX reference used. By pairing the existing USD series with a MEP-based version and viewing both alongside the ARS version, it’s possible to more clearly separate equity market moves from currency and inflation translation effects.

The posts on this blog are opinions, not advice. Please read our Disclaimers.

2025: A Market for Stock Pickers in France?

Contributor Image
Sara Pineros

Quantitative Analyst, Index Investment Strategy

S&P Dow Jones Indices

Despite a strong year for global equities in 2025, most active funds in Europe struggled to outperform their benchmarks. According to the latest SPIVA® Europe Year-End 2025 Scorecard, 81.8% of active equity funds lagged their benchmarks over the past year, rising to 97.0% over the 10-year period.1 The France Equity fund category offered a notable exception, with a lower one-year underperformance rate of only 66.9% (see Exhibit 1).

This lower one-year underperformance rate marked a significant improvement compared to recent years. Over the past four years, an average of 88.2% of France Equity funds underperformed on a one-year basis, with the rate declining by almost 20 percentage points in 2025. However, this short-term gain was not sustained; over the 3-, 5- and 10-year periods, the performance of France Equity funds aligned with European averages. Both the longer-term convergence and short-term advance are shown in Exhibits 2 and 3.

To understand why France’s equity market appeared relatively easier for active funds to navigate in 2025, it helps to start with what performance the benchmark delivered and what its underlying drivers were. In 2025, the flagship S&P France BMI increased by 14.4%. In comparison, the S&P 500® rose 3.9%, while the S&P Europe 350® posted its strongest performance in four years, with a 20.5% gain. The more geographically focused S&P Eurozone BMI outperformed them all, climbing 25.0%.

In 2025, leadership within the S&P France BMI extended beyond just its largest constituents. Skewness was quite elevated; while the average constituent gained 30.0%, the median increase was only 10.0%, and fewer than half (45.8%) of stocks outperformed the index (see Exhibit 4). This wide dispersion created more opportunities for stock selection, which may explain the lower rate of active underperformance. However, it also underscores the persistent challenges active managers face in beating the benchmark. Managers who identified strong performers outside the top holdings had a better chance of keeping pace.

So, are we finally catching a hint of the long-awaited “stock-pickers’ market,” or is it still just beyond reach for most?

Sector effects appeared to play an important role in performance last year. Industrials and Financials accounted for around three-quarters of the S&P France BMI’s total gains in 2025. Financials showed strong results, with the S&P France BMI Financials sector rising 43.9%. Within Financials, the Banks industry group stood out, as the S&P France BMI Banks increased 72.2% in 2025, 57.9% above the broader S&P France BMI, as illustrated in Exhibit 5. The French bank Société Générale was among the year’s top-performing European banks. For active managers, being structurally underweight in either sector may have presented a meaningful headwind, even if stock selection was effective. The bigger risk may not have been picking the wrong banks but not enough banks.

When looking into some of the key stocks commonly held among active France Equity funds, another leg of France’s “luxury slump” may have negatively affected many managers. Large names like LVMH and Hermès, which historically have often led the pack, posted muted or even negative returns. Managers who stuck with these legacy luxury stocks probably felt the drag on performance.

The S&P France BMI Consumer Discretionary (Sector) fell 2.3%, finishing the year 16.7% behind the benchmark (see Exhibit 5). Within the S&P France BMI, the Apparel, Accessories & Luxury Goods sub-industry had the highest weight, at 12.8%, but only managed a 1.9% gain, contributing just 0.3% to the index’s total performance. That divergence—banks surging while luxury lagged—helped widen the gap between “right sector” and “wrong sector” positioning.

2025 marked a relatively bright spot for French active managers, with fewer underperforming their benchmark compared to the European average, though most still lagged behind. Whether this was truly The Year of Stock Picking in France remains to be seen; stay tuned for our SPIVA Europe Mid-Year 2026 Scorecard to find out if this momentum continued or proved to be a one-off.

1 SPIVA compares net-of-fees active fund returns with category-appropriate benchmarks and corrects for survivorship bias.


The posts on this blog are opinions, not advice. Please read our Disclaimers.

Leveraged Loan Market Snapshot

Contributor Image
Eric Pettinelli

Fixed Income Specialist, Index Investment Strategy

S&P Dow Jones Indices

Amid growing uncertainty, small market shifts can have large impacts on companies with lower credit ratings like those found in the S&P USD Select Leveraged Loan Index. This index measures the performance of a liquid and diversified universe of USD‑denominated leveraged loans by tracking all fully funded term loans with a minimum facility size of USD 500 million and credit ratings below investment grade, providing a broader view of the leveraged loan market.

The credit quality of the larger leveraged loans in the S&P USD Select Leveraged Loan Index has improved, and the index’s total notional value is also rising, as shown in Exhibit 1. This suggests that investors are assuming less risk on the larger loans while still pursuing the higher spreads offered further down the credit ladder.

This trend is reinforced by a lower proportion of the index with a credit rating of “default” in 2025, as shown in Exhibit 2. The year‑end 2025 default percentage was below the rates recorded in each of the three preceding years.

Index‑weighted spreads have been falling, reflecting improving credit quality. Spreads dropped from 3.53% to 3.27%, a 26 bps decline, and finished 2025 more than 40 bps below their 2024 peak (see Exhibit 3). As 2026 unfolds, this spread‑risk relationship could continue to be tested by market uncertainty, and the index will reveal loan market sensitivity to changing macro conditions.

Despite falling spreads, the index increased 4.5% in 2025, driven by the growing nominal value of the index. Higher credit quality also made this performance more resilient, suggesting the market may be seeking stability amid rising uncertainty.

By focusing on the largest leveraged loans, the S&P USD Select Leveraged Loan Index measures broader market shifts and remains a valuable tool for navigating an uncertain environment through an asset class with differentiated risk.

The posts on this blog are opinions, not advice. Please read our Disclaimers.

One to Forget: SPIVA Europe U.K. Equity Active Fund Performance in 2025

Contributor Image
Euan Smith

Quantitative Analyst, Index Investment Strategy

S&P Dow Jones Indices

2025 was full of memorable moments, from tariff tensions and continued AI advancement, to pop stars in space and billionaire weddings. For U.K. active equity funds, however, 2025 may well be a year to forget. Across the three relevant categories measured in the SPIVA Europe Year-End 2025 Scorecard (U.K. Equity, U.K. Large-/Mid-Cap Equity and U.K. Small-Cap Equity), 90% of funds failed to beat their category benchmark. Markets, perhaps more than usual, offered opportunities to positively deviate from market-cap-weighted indices, but return distributions made this a feat easier said than done.

In an absolute sense, 2025 was a fine year for U.K. equity active funds. Exhibit 1 shows that all three capitalization categories measured in the SPIVA Europe Year-End 2025 Scorecard produced positive returns in aggregate. This becomes far less impressive, however, when analyzing benchmark-relative performance. On both an equal- and asset-weighted basis, the active categories significantly lagged their benchmarks. The gap was especially wide for small-cap funds, which produced less than a quarter of the return of their benchmark, the S&P United Kingdom SmallCap.

The extent of this underperformance was historic. In 2025, 88% of broad U.K. Equity, 89% of U.K. Large-/Mid-Cap Equity and 97% of U.K. Small-Cap Equity funds failed to beat their benchmarks. As shown in Exhibit 2, it was a particularly bad year for the cohort, marking the second-worst, third-worst and second-worst years, respectively, across the three categories in the 14-year dataset.

As ever when debating the performance of active funds versus indices, there are likely to be two camps on this issue. Some may argue that 2025 was an exceptionally challenging year to navigate, full of macro headwinds, geopolitical turmoil and technologically driven paradigm shifts. From this perspective, active fund underperformance was driven by bad luck. Others may suggest that these are precisely the conditions where skilled active management should excel, and the fact that it generally did not is evidence of its rarity. Exhibits 3 and 4 may provide ammunition to both sides.

Exhibit 3 shows both the opportunity and perils of active management. In 2025, the performance of half of S&P U.K. BMI stocks differed from the index by more than 25%. There was, therefore, ample opportunity to generate outperformance by underweighting underperformers and overweighting outperformers. However, with significant underperformers more than doubling the number of outperformers, any deviation was likely to be negative.

Exhibit 4 further supports this, showing the distribution of U.K. Equity index constituent performances within the S&P United Kingdom LargeMidCap and S&P United Kingdom SmallCap. The distribution of performance in both indices was positively skewed, meaning that a small number of stocks were responsible for much of the increase. Consequently, for active funds, failure to own the few key outperformers at or above their index weight could have led to underperformance.

2025 proved to be a particularly difficult year for U.K. equity active funds. Concentrated stock returns made it difficult to match index performance. Such a return distribution is not unique to the U.K. in 2025, nor is the tendency for the majority of active funds to struggle to outperform their indices. The past may not be precedent, but the long-standing results from the SPIVA Scorecards continue to document similar patterns of underperformance year after year in markets across the globe.

The posts on this blog are opinions, not advice. Please read our Disclaimers.