Get Indexology® Blog updates via email.

In This List

Leveraged Loan Market Snapshot

One to Forget: SPIVA Europe U.K. Equity Active Fund Performance in 2025

Measuring Direct Lending: Building Transparency in Private Credit Markets

Systematic S&P 500 Strategies Targeting Stability and Growth Potential

Critical Fixed Income Considerations amid RBA’s Swift Policy Moves

Leveraged Loan Market Snapshot

Contributor Image
Eric Pettinelli

Fixed Income Specialist, Index Investment Strategy

S&P Dow Jones Indices

Amid growing uncertainty, small market shifts can have large impacts on companies with lower credit ratings like those found in the S&P USD Select Leveraged Loan Index. This index measures the performance of a liquid and diversified universe of USD‑denominated leveraged loans by tracking all fully funded term loans with a minimum facility size of USD 500 million and credit ratings below investment grade, providing a broader view of the leveraged loan market.

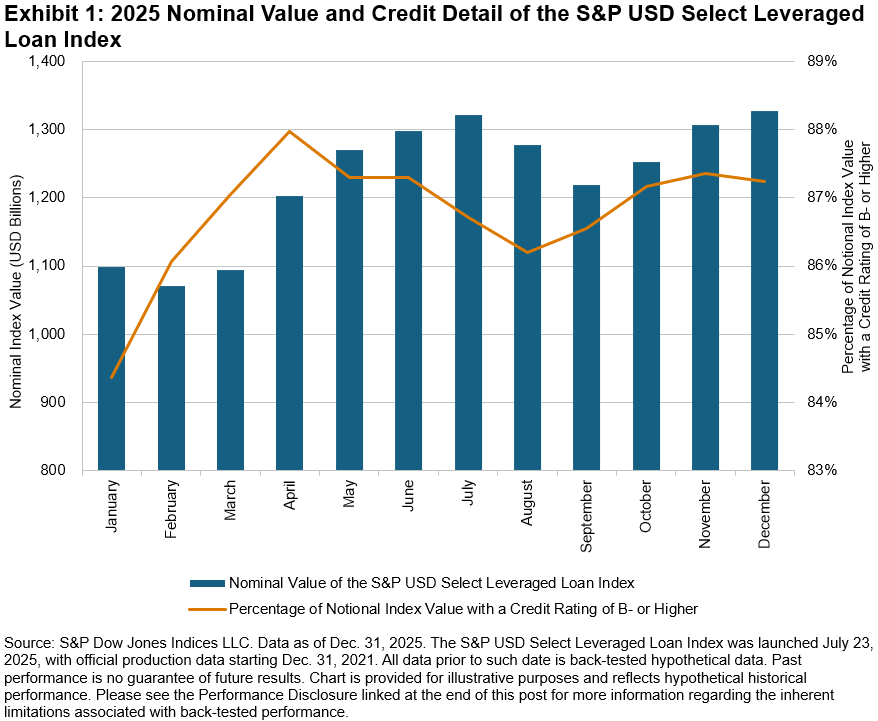
The credit quality of the larger leveraged loans in the S&P USD Select Leveraged Loan Index has improved, and the index’s total notional value is also rising, as shown in Exhibit 1. This suggests that investors are assuming less risk on the larger loans while still pursuing the higher spreads offered further down the credit ladder.

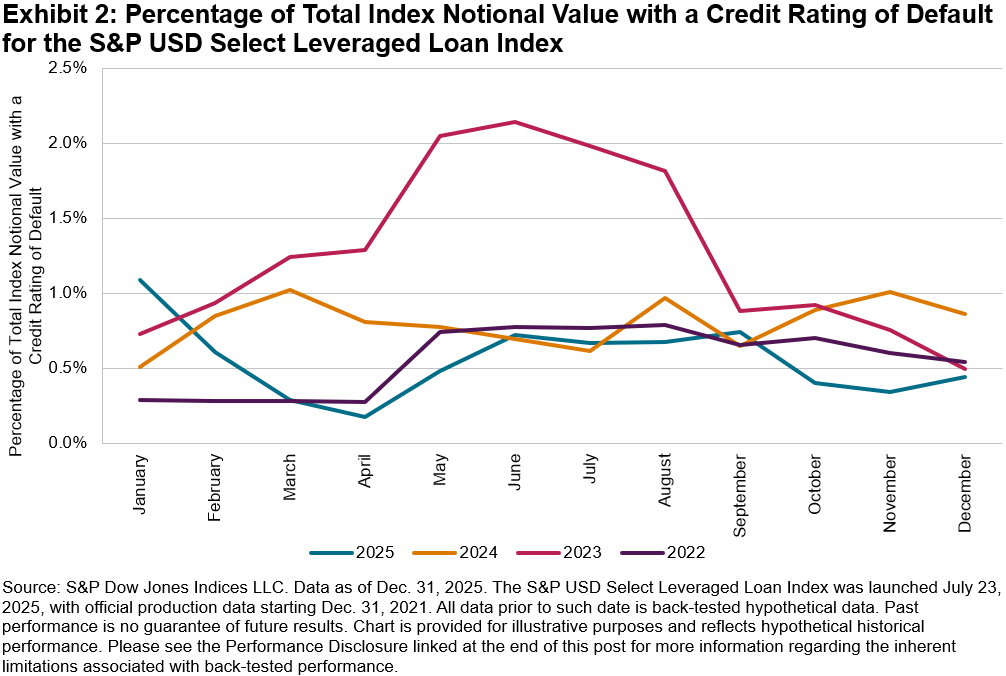
This trend is reinforced by a lower proportion of the index with a credit rating of “default” in 2025, as shown in Exhibit 2. The year‑end 2025 default percentage was below the rates recorded in each of the three preceding years.

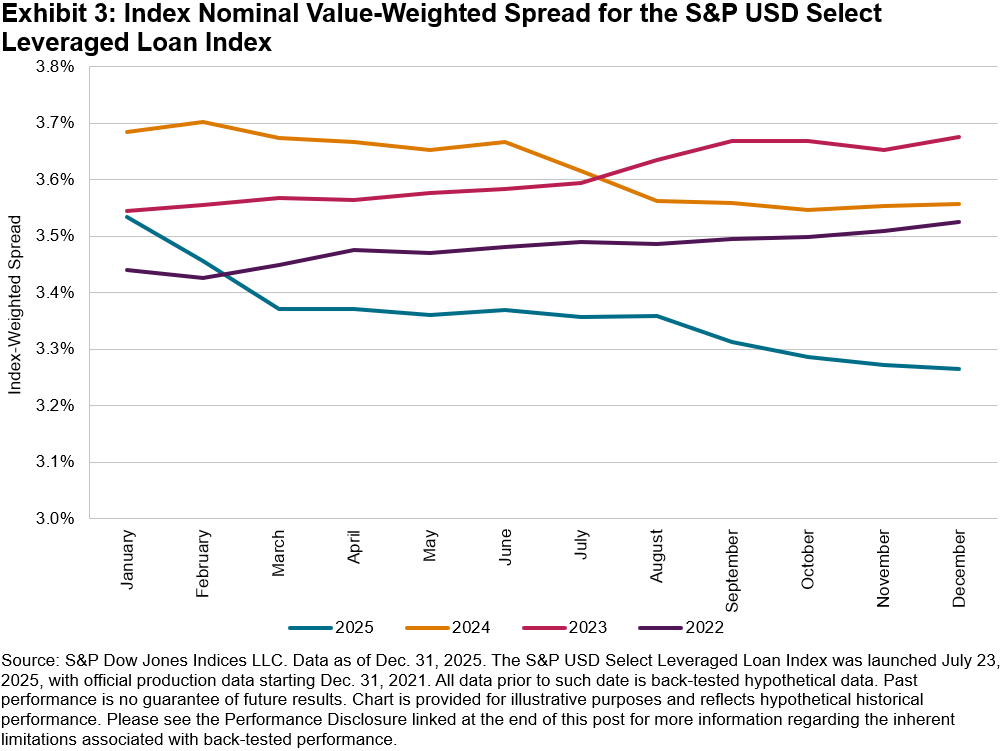
Index‑weighted spreads have been falling, reflecting improving credit quality. Spreads dropped from 3.53% to 3.27%, a 26 bps decline, and finished 2025 more than 40 bps below their 2024 peak (see Exhibit 3). As 2026 unfolds, this spread‑risk relationship could continue to be tested by market uncertainty, and the index will reveal loan market sensitivity to changing macro conditions.

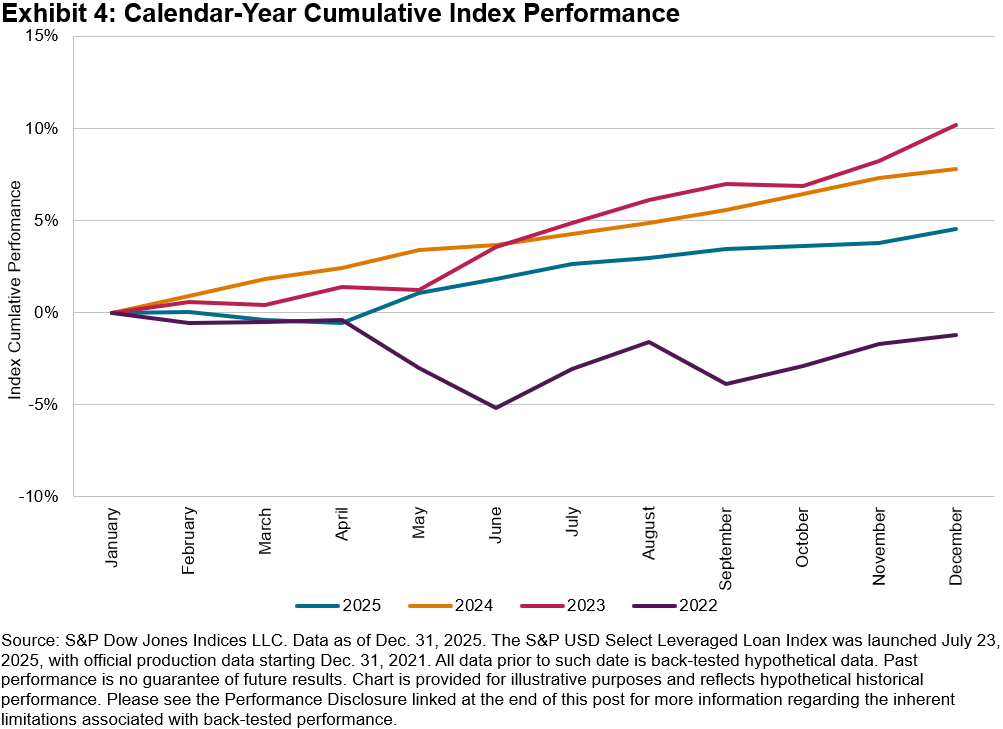
Despite falling spreads, the index increased 4.5% in 2025, driven by the growing nominal value of the index. Higher credit quality also made this performance more resilient, suggesting the market may be seeking stability amid rising uncertainty.

By focusing on the largest leveraged loans, the S&P USD Select Leveraged Loan Index measures broader market shifts and remains a valuable tool for navigating an uncertain environment through an asset class with differentiated risk.

The posts on this blog are opinions, not advice. Please read our Disclaimers.

One to Forget: SPIVA Europe U.K. Equity Active Fund Performance in 2025

Contributor Image
Euan Smith

Quantitative Analyst, Index Investment Strategy

S&P Dow Jones Indices

2025 was full of memorable moments, from tariff tensions and continued AI advancement, to pop stars in space and billionaire weddings. For U.K. active equity funds, however, 2025 may well be a year to forget. Across the three relevant categories measured in the SPIVA Europe Year-End 2025 Scorecard (U.K. Equity, U.K. Large-/Mid-Cap Equity and U.K. Small-Cap Equity), 90% of funds failed to beat their category benchmark. Markets, perhaps more than usual, offered opportunities to positively deviate from market-cap-weighted indices, but return distributions made this a feat easier said than done.

In an absolute sense, 2025 was a fine year for U.K. equity active funds. Exhibit 1 shows that all three capitalization categories measured in the SPIVA Europe Year-End 2025 Scorecard produced positive returns in aggregate. This becomes far less impressive, however, when analyzing benchmark-relative performance. On both an equal- and asset-weighted basis, the active categories significantly lagged their benchmarks. The gap was especially wide for small-cap funds, which produced less than a quarter of the return of their benchmark, the S&P United Kingdom SmallCap.

The extent of this underperformance was historic. In 2025, 88% of broad U.K. Equity, 89% of U.K. Large-/Mid-Cap Equity and 97% of U.K. Small-Cap Equity funds failed to beat their benchmarks. As shown in Exhibit 2, it was a particularly bad year for the cohort, marking the second-worst, third-worst and second-worst years, respectively, across the three categories in the 14-year dataset.

As ever when debating the performance of active funds versus indices, there are likely to be two camps on this issue. Some may argue that 2025 was an exceptionally challenging year to navigate, full of macro headwinds, geopolitical turmoil and technologically driven paradigm shifts. From this perspective, active fund underperformance was driven by bad luck. Others may suggest that these are precisely the conditions where skilled active management should excel, and the fact that it generally did not is evidence of its rarity. Exhibits 3 and 4 may provide ammunition to both sides.

Exhibit 3 shows both the opportunity and perils of active management. In 2025, the performance of half of S&P U.K. BMI stocks differed from the index by more than 25%. There was, therefore, ample opportunity to generate outperformance by underweighting underperformers and overweighting outperformers. However, with significant underperformers more than doubling the number of outperformers, any deviation was likely to be negative.

Exhibit 4 further supports this, showing the distribution of U.K. Equity index constituent performances within the S&P United Kingdom LargeMidCap and S&P United Kingdom SmallCap. The distribution of performance in both indices was positively skewed, meaning that a small number of stocks were responsible for much of the increase. Consequently, for active funds, failure to own the few key outperformers at or above their index weight could have led to underperformance.

2025 proved to be a particularly difficult year for U.K. equity active funds. Concentrated stock returns made it difficult to match index performance. Such a return distribution is not unique to the U.K. in 2025, nor is the tendency for the majority of active funds to struggle to outperform their indices. The past may not be precedent, but the long-standing results from the SPIVA Scorecards continue to document similar patterns of underperformance year after year in markets across the globe.

The posts on this blog are opinions, not advice. Please read our Disclaimers.

Measuring Direct Lending: Building Transparency in Private Credit Markets

Contributor Image
Wanying Wu

Senior Analyst, Private Markets Indices

S&P Dow Jones Indices

Direct Lending Has Become a Core Segment of Private Credit

Private credit has expanded in recent years, with the market reaching an estimated USD 2.28 trillion at year-end 2025 and projected to grow to approximately USD 4.5 trillion by 2030.1 Within this expansion, direct lending has emerged as the dominant strategy, reshaping how companies access capital and how investors generate yield. Direct lending refers to loans provided directly to companies by private and public investment funds, including business development companies, rather than traditional banks, the broadly syndicated loan (BSL) market or public debt markets. These privately negotiated loans—typically extended to middle-market and sponsor-backed businesses—offer floating-rate income and structural protections for lenders. What was once a niche allocation has evolved into a mainstream source of corporate financing and institutional yield generation.

These privately negotiated loans are typically extended to sponsor-backed companies and are characterized by:

  • Floating-rate income profiles
  • Senior-secured positioning
  • Strong covenant and structural protections
  • Bilateral structuring flexibility

As the market has scaled, so too has its importance in institutional portfolios.

A Collaboration between S&P DJI and Lincoln International Enables a Systematic View of Direct Lending3

As direct lending has become a core pillar of corporate credit, the need for consistent, transparent and rules-based measurement has grown increasingly urgent. Historically, investors have faced significant data constraints:

  • Limited availability of standardized loan-level information
  • Absence of investable or benchmark-quality indices
  • Limited visibility into risk composition and structural characteristics

To address these challenges and enhance transparency, S&P Dow Jones Indices (S&P DJI) and Lincoln International formed a collaboration to launch the S&P Lincoln Senior Debt Index Series,3 comprising:

  • S&P Lincoln U.S. Senior Debt Index
  • S&P Lincoln Europe Senior Debt Index

By combining Lincoln International’s extensive private loan valuation database with S&P DJI’s expertise in index design, governance and calculation, the series delivers a systematic measure of the fair value performance of direct lending investments across the U.S. and Europe.

  1. Designed to Enhance Transparency and Institutional Confidence: The S&P Lincoln Senior Debt Index Series is structured to elevate transparency and analytical rigor within direct lending.
  2. Broad Market Coverage: Lincoln International’s valuation database represents approximately USD 220 billion of the direct lending loan market across the U.S. and Europe.
  3. Institutional-Grade Valuation Framework: Valuations are informed by Lincoln International and incorporate detailed portfolio company operating data provided by fund clients. All valuations conform to fair value standards under both U.S. GAAP and IFRS.
  4. Robust Governance: The index methodology is transparent, rules-based and administered independently by S&P DJI, with systematic rebalancing and oversight.
  5. Portfolio Characteristics and Composition: The indices reflect meaningful diversification across sectors, borrower size and loan structures.
  • Average Principal Balance (As of Dec. 31, 2025)
    • U.S.: USD 399 million
    • Europe: EUR 142 million
  • Average EBITDA Size (As of Dec. 31, 2025)
    • U.S.: USD 101 million
    • Europe: EUR 52 million

The S&P Lincoln Senior Debt Index Series outperformed leveraged loans over the last 10 years by 2.72% annually (U.S.) and over the last 7 years by 2.81% annually (Europe), as measured by the S&P Lincoln U.S. Senior Debt Index, S&P Lincoln Europe Senior Debt Index, S&P UBS Leveraged Loan Index and the S&P UBS Western Europe Leveraged Loan Index. This difference is driven by variations in company size, credit quality and liquidity.

The S&P Lincoln Senior Debt Index Series Complements BSL and BDC Benchmarks

As direct lending has grown in scale and institutional relevance, it increasingly sits alongside other leveraged lending segments, such as the BSL market, which represents approximately USD 1.4 trillion in the U.S.4

Both BSLs and direct lending provide senior-secured, floating-rate financing to leveraged borrowers and support similar corporate activities. However, their market structures differ. BSLs benefit from observable secondary market pricing, while direct lending loans are privately originated, negotiated bilaterally and typically held to maturity with limited trading activity. These structural distinctions mean that direct lending returns reflect not only credit fundamentals and seniority, but also an illiquidity premium and the value of structuring flexibility.

Conclusion

Private credit has evolved from a bespoke, opaque niche into a globally significant and institutionally scrutinized asset class. As the market expands in scale and systemic importance, the demand for transparency, governance and standardized measurement has intensified.

The S&P Lincoln Senior Debt Index Series represents an important milestone in the maturation of direct lending. By providing systematic, rules-based and independently administered measurement, the series enables:

  • Improved performance benchmarking
  • Enhanced risk transparency
  • More informed asset allocation decision
  • Strengthened reporting and governance frameworks

As demonstrated in Exhibits 1 and 2, private credit is now a major source of global capital formation. With this growth comes the responsibility to provide clarity and comparability. The S&P Lincoln Senior Debt Index Series helps establish the analytical infrastructure necessary for the next phase of the market’s evolution.


1 Guevarra, Joyce; Hiteshbhai Bharucha, Neel. “Private credit gains ground among top private equity managers.” S&P Global. Nov. 13, 2025.

2 U.S. leveraged loan and high yield bond yield and size: Presentation Title

U.S. & Europe Direct lending yield: S&P Lincoln Senior Debt Index Series.

U.S. & Europe Direct lending market size: CapIQ, S&P Global.

U.S. and Europe investment grade bonds market size: Barnes, Dan. IG issuance across US and Europe up 20% on five-year average. The Desk. Dec. 3,2025.

U.S. investment grade bonds yields: Leveraged Loan Market Review. Fidelity. Q4, 2025.

Europe leveraged loan and high yield bonds market size and yield: Valliere, Thierry, et al., 2025. Unlocking the potential of European Leveraged Loans. Amundi. March 20, 2025.

Europe investment grade bonds yield: Euro area yield curves. European Central Bank, Eurosystem.

Exchange rate data on Feb. 27, 2025, as sourced by XE.

3 S&P Dow Jones Indices and Lincoln International Unveil New Benchmarks for the Private Loan Market with Launch of S&P Lincoln Senior Debt Indices. S&P Dow Jones Indices. Feb. 23, 2026.

4 Wolfson, Kevin; Taylor, Joseph. Private Credit vs. Broadly Syndicated Loans: Not a Zero-Sum Game. PineBridge Investments. July 1, 2024.

The posts on this blog are opinions, not advice. Please read our Disclaimers.

Systematic S&P 500 Strategies Targeting Stability and Growth Potential

Meet the S&P 500 Futures Intraday Edge Indices, a dynamic index series built to react to changes in market conditions as they seek to capitalize on trends, optimize S&P 500 exposure, maintain stability and enhance growth potential. 

The posts on this blog are opinions, not advice. Please read our Disclaimers.

Critical Fixed Income Considerations amid RBA’s Swift Policy Moves

Contributor Image
Jessica Tan

Principal, Fixed Income Indices

S&P Dow Jones Indices

In May 2022, the Reserve Bank of Australia (RBA) was among the last major central banks to begin raising interest rates during the post-COVID-19 monetary tightening cycle. In Q1 2026, the RBA is not taking any chances with inflation, becoming the first major central bank to implement two consecutive 25 bps rate hikes (in February and March), increasing the cash rate target from 3.6% to 4.1%, returning the rate to levels last seen in May 2025. The decision was driven by persistently above-target inflation and further reinforced by the disruptions in energy supply due to the ongoing conflict in the Middle East.

AUD Bond Yields Are above 5% Again

All of the AUD-denominated bond indices in Exhibit 1, except for the S&P/ASX iBoxx Australian & State Governments 1-5 Index, had yields above 5% as of March 18, 2026. The S&P/ASX Bank Bill Index, which generally emulates the RBA cash rate targets, had the shortest duration of 0.13 years and the lowest yield of 4.1%.

The iBoxx AUD Investment Grade Subordinated Debt Mid Price Index, which reflects floating-rate subrdinated Tier 2 instruments, had the second-shortest duration at 0.16 years and the third-highest yield at 5.93%. The ultrashort duration is due to the coupon resetting frequently (floating rate). Its fixed-rate sibling, the iBoxx AUD Fixed Investment Grade Subordinated Debt Mid Price Index, had a yield of 6.23% and duration of 4.34 years. The higher yields for both subordinated debt indices were driven by the higher credit and capital-structure risk.

With the U.S. Federal Fund Rate sitting at 3.75%, the USD Treasury indices had lower yields, between 4.5% and 5%. Even with a significantly longer duration of 15.75 years, the S&P U.S. Treasury 20+ Year AUD Hedged Bond Index yield remained below 5%, providing less than 50 bps in spread for the additional duration risk.

Hedging Is Increasingly Important

With the RBA cash rate at 4.1%—above the U.S. Fed Funds rate for the first time since 2017—AUD-based investors should note that this shift can impact both AUD/USD trends and FX hedging costs. Historically, the iBoxx $ Treasuries (AUD Hedged) outperformed its unhedged counterpart when AUD appreciated between 2015-2017, but unhedged returns became more volatile as AUD/USD fluctuated. Recently, as AUD strengthened since late 2025, the performance gap between hedged and unhedged indices narrowed. With higher Australian rates and rising commodity prices, the Australian dollar may continue to appreciate, making currency hedging for non-AUD exposures more crucial but also potentially more costly, meaning there may be both benefits and costs for hedging in this environment.

Returns since the Previous Rate Hiking Cycle

Between May 2022 and late 2023, the RBA raised the cash rate target from 0.1% to 4.35%. Over the past five years, the S&P/ASX Bank Bill Index mirrored the changes in the cash rate, delivering steady positive performance in line with policy rates (see Exhibit 3).

The S&P/ASX iBoxx Australian & State Governments 0+ Index and S&P/ASX iBoxx Corporates 0+ Index underperformed the S&P/ASX Bank Bill Index due to their longer duration and greater sensitivity to rising rates. However, higher yield (carry) from corporate bonds allowed the S&P/ASX iBoxx Corporates 0+ Index to outperform the S&P/ASX iBoxx Australian & State Governments 0+ Index every year reflected in Exhibit 3.

Frequent coupon resets from the floating rate structure of the iBoxx AUD Investment Grade Subordinated Debt Mid Price Index constituents helped limit interest rate risk and volatility, while higher yields from additional credit and capital structure spreads boosted performance—delivering a total return of 24.22% since Dec. 31, 2021.

As the RBA embarks on yet another monetary policy tightening cycle to combat inflation, understanding how these indices performed previously can provide valuable insights for navigating this current environment.

The posts on this blog are opinions, not advice. Please read our Disclaimers.