Trading linked to S&P 500® sectors has expanded meaningfully in recent years, as market participants increasingly use sector instruments to allocate capital, hedge risk and express relative views within U.S. equities. As participation in index-linked markets has grown, liquidity has become an informative signal, revealing where attention is focused and how risk is being transferred. The U.S. Sector Dashboard’s new Liquidity Monitor brings these dynamics together, providing a structured framework for analyzing trading across S&P 500 sectors, combining volume composition with evolving trends across exchange-traded products (ETPs) and futures.
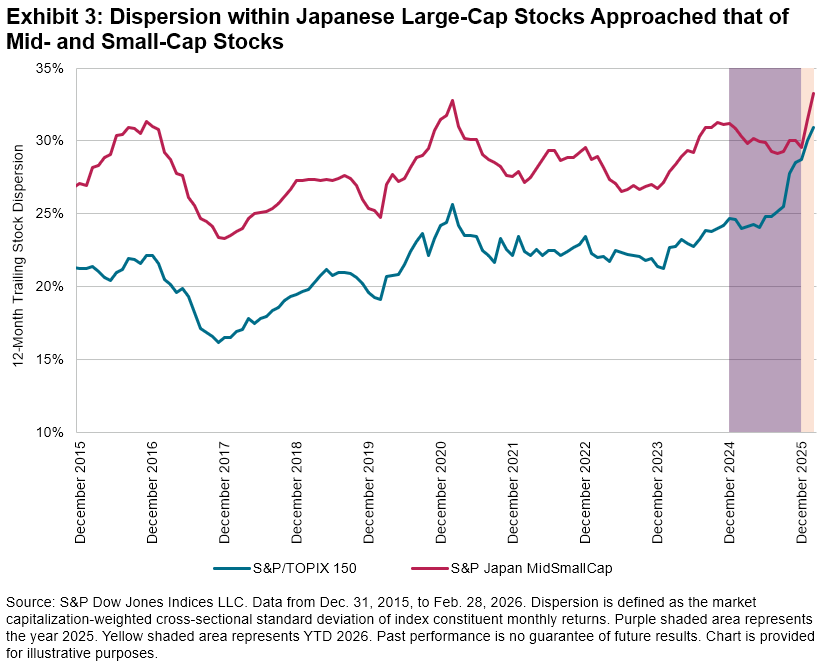
Sector-based instruments have long been embedded in the S&P 500 trading ecosystem, but their role continues to deepen.1 Used across strategies, from long-term allocation and rotation to short-term tactical positioning and hedging, these tools now sit within a steadily expanding liquidity environment. As shown in Exhibit 1, aggregate trading across S&P 500 sector ETPs and futures has climbed, with USD 480 billion traded in February 2026. This sustained growth indicates sector rotations are unfolding within a robust trading environment, where positioning is increasingly expressed through sector products.
Raw trading volumes offer a first look at market activity, but on their own they can mask underlying shifts in participation. The monthly data in Exhibit 1 highlights a recurring rhythm in sector trading, driven in part by futures contract rolls, that can distort month-to-month comparisons. Smoothing techniques, such as trailing averages, help filter out short-term noise and reveal a clearer view of underlying liquidity trends.
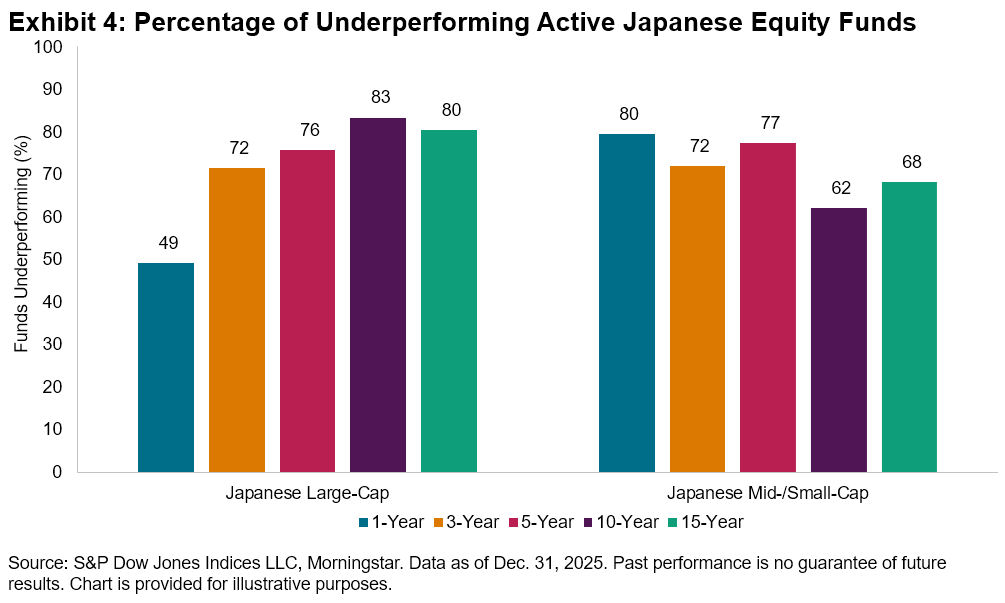
To isolate these fundamental shifts more precisely, the Liquidity Monitor applies seasonal adjustment ratios based on historical patterns. These adjustments scale trading activity according to typical changes observed at similar points in prior quarters, using a 20-quarter rolling window. Exhibit 2 shows that futures volumes tend to peak in the third month of each quarter, averaging roughly 2.82 times the level observed earlier in each quarter. Accounting for this behavior helps distinguish meaningful changes from seasonal effects.
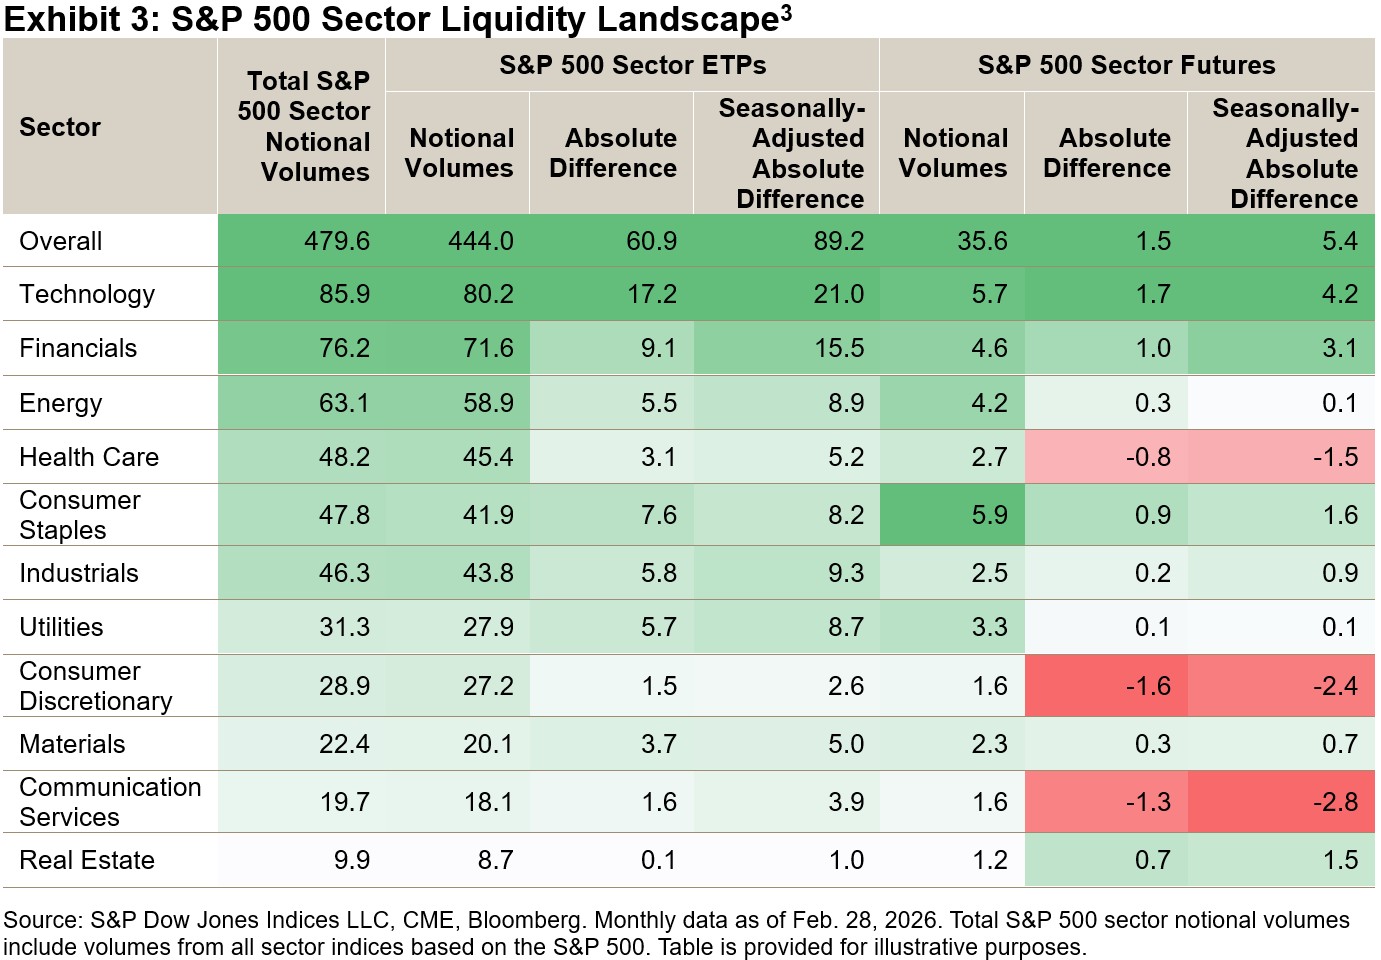
Exhibit 3 shows raw notional volumes and the monthly absolute differences for both raw and seasonally adjusted notional volumes across S&P 500 sector ETPs and futures. In February 2026, total sector volumes increased, driven by Technology, Financials and Energy. ETP volumes rose broadly, while futures activity declined in Health Care, Consumer Discretionary and Communication Services.
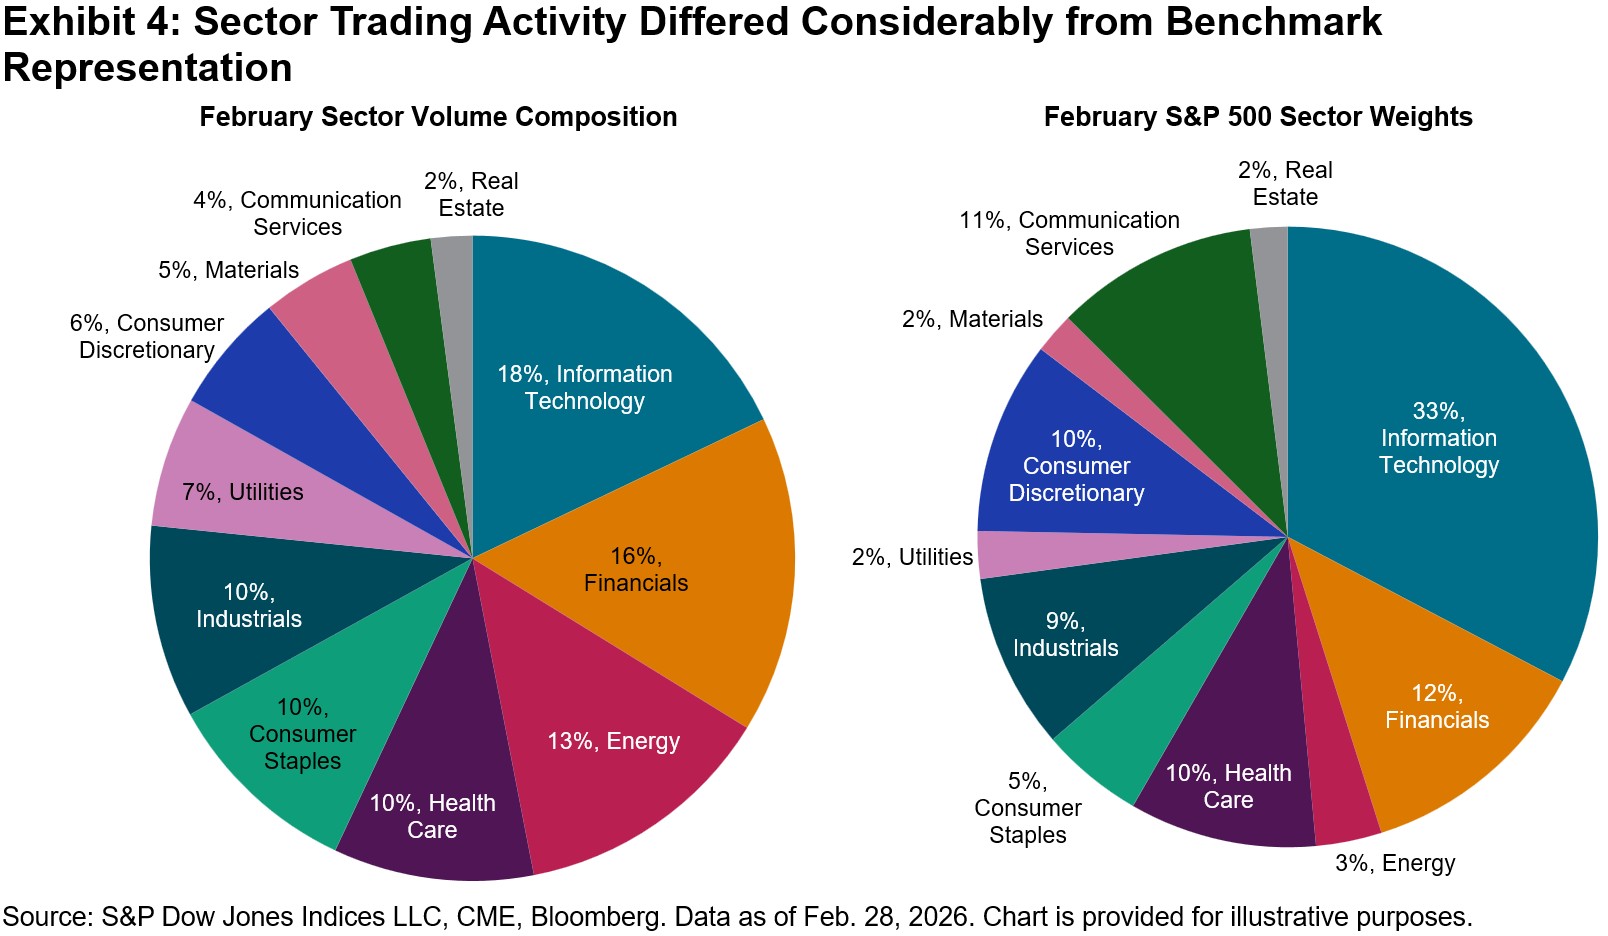
Beyond changes in volumes, comparing trading activity with sector weights in the S&P 500 offers additional perspective on the balance between participation and investment. As shown in Exhibit 4, Energy’s share of trading was roughly 10% above its index weight in February, while Information Technology’s was notably 15% below what its larger market capitalization would suggest. These differences highlight where liquidity, activity and investor engagement are most focused, both in absolute and relative terms.
Taken together, measures of trading activity and sector composition provide a structured lens for interpreting liquidity across S&P 500 sectors. By linking trading patterns with broader market dynamics, the Liquidity Monitor helps identify where participation is building and how sector-level activity is evolving within the S&P 500 ecosystem. For additional insights, check out our U.S. Sector Dashboard.
1 Edwards, Tim et al, “Active and Passive Harmonics: Trading Frequencies of Index-Linked Products,” Journal of Beta Investment Strategies, Winter 2024.
2 Calculated as the ratio of the seasonal adjustment factor for futures during the third month of the quarter to the average of the first- and second-month factors.
3 Find more information on S&P 500 sectors indices here.
The posts on this blog are opinions, not advice. Please read our Disclaimers.