Get Indexology® Blog updates via email.

In This List

Precious Metals Shine across August Thematics

The S&P 500 Christian Values Screened Index: A New Benchmark to Serve Faith-Based Needs

Scoring & Screening Mid-Cap Leaders

Upcoming Enhancements to Modernize the S&P/ASX Index Series

Tracking Fixed Income Performance and Innovation

Precious Metals Shine across August Thematics

Contributor Image
Sabatino Longo

Analyst, Global Equity & Thematic Indices

S&P Dow Jones Indices

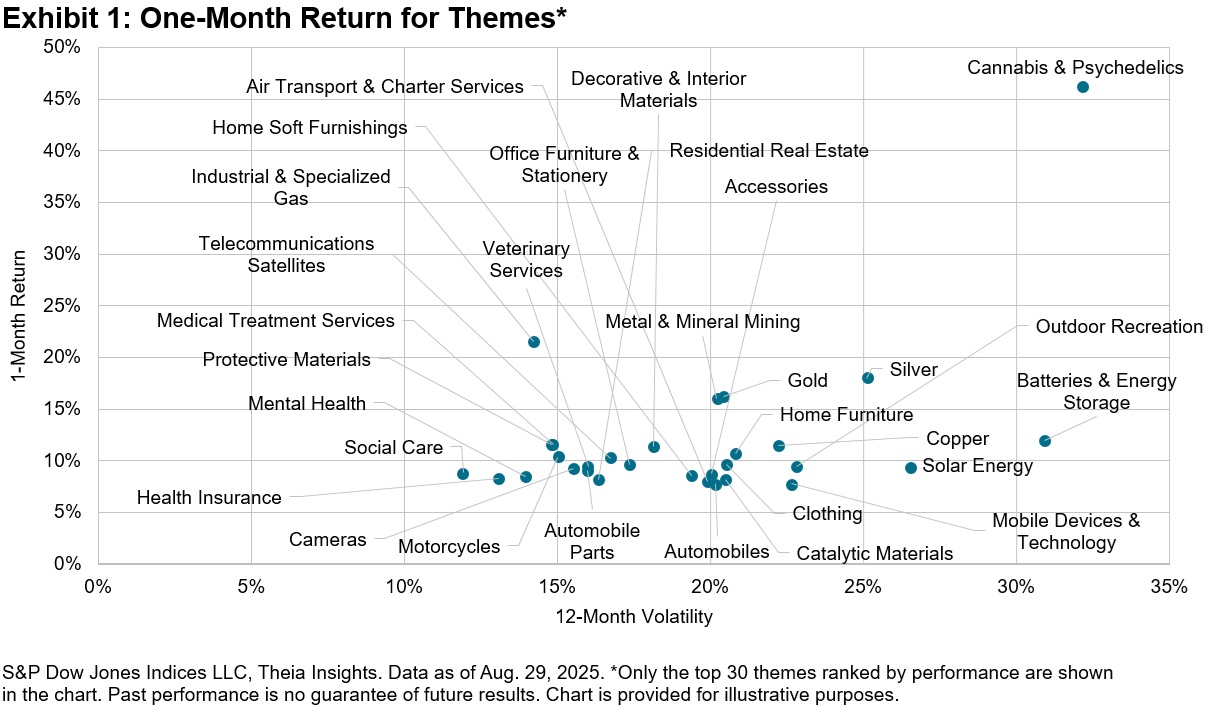
August’s S&P Thematics Dashboard captures a market in motion—from precious metals rallying to multi-year highs to energy and technology themes. With the ongoing macro-political uncertainty in the backdrop, Silver (up 18%) reached a 14-year high, with Gold up 16% on dovish Fed expectations and a weaker U.S. dollar.1 This momentum extended across the metals complex, with Metal & Mineral Mining up 16% and Copper gaining 12% on infrastructure spending prospects and supply-demand tightness.2

Alternative Medicine Takes the Stage

The standout performer of the month was Cannabis & Psychedelics, which soared 46%. Renewed investor enthusiasm was driven by shifting regulatory debates in Europe and the U.S.3 alongside new developments in the cannabis beverage market.4 Clinical confidence is also rising: mid-stage trials report that psychedelics might reduce anxiety symptoms—sometimes with effects lasting up to three months—highlighting renewed interest in psychedelic-assisted therapy’s potential.5 Strength also extended across the broader healthcare space, with Medical Treatment Services, Mental Health  and Health Insurance up 12%, 8.5% and 8%, respectively.

Energy Transition Shows Mixed Signals

Large-cap energy was among the top sector performers in the second quarter, with Batteries & Energy Storage climbing 12% on strong electric vehicle adoption, recycling breakthroughs and infrastructure buildout.6 Solar Energy gained 9%, while traditional power sources like Coal (up 6%) and Nuclear (up 4%) reminded investors of their persistence.

By contrast, Wind Energy declined 4% after federal funding cuts and policy reversals nearly completed halted offshore projects.7 The contrasting outcomes highlight how policy decisions and infrastructure investment trends are shaping winners and laggards within the energy transition.

Digital Assets and Regulatory Momentum

The digital asset space showed modest gains in August, with Cryptocurrency & Digital Assets up 3% and Blockchain & Distributed Ledger down -2%. Investor sentiment was positively shaped by regulatory debates, particularly around U.S. policy efforts to establish clearer rules for stablecoins and crypto market oversight. This shift in tone provided a constructive backdrop for the sector, even as price action remained relatively muted. By month’s end, the broader crypto market reached roughly USD 4 trillion in value, supported by growing optimism that regulatory clarity could open the door to greater institutional participation.8

Technology and Defense Overview

Technology themes lagged. Artificial Intelligence (-2%), Digital Transformation (-2%) and Cybersecurity (up 0.1%) all underperformed. Structural progress in AI and robotics continues: OpenAI launched ChatGPT Agent,9 Amazon reached one million robots with its DeepFleet logistic system10 and AWS debuted a marketplace for autonomous AI agents.11

Meanwhile, defense tech gained visibility as the U.S. Army signed a USD 10 billion enterprise AI contract with Palantir, highlighting the growing role of commercial AI in national security.12 European defense was down, with the S&P Europe Defense Vision Index falling 3%, while the S&P Kensho Global Future Defense Index was up 9%, driven largely by U.S. names.

Themes on the Radar: Powering the AI Era

AI-driven data center growth is supporting a renaissance of the U.S. grid dynamics. Electricity demand from AI data centers is projected to surge nearly thirtyfold by 2035, potentially accounting for 70% of all data center electricity consumption,14 and 13% of total U.S electricity demand.[14] In response to this rise, companies are also exploring the expansion of nuclear capacity, including Constellation Energy’s multibillion-dollar commitment to restart key facilities and expand generation capacity.15

These developments are translating into tangible market growth: the Data Center theme was up approximately 39% YTD, while energy infrastructure-linked names—reflected in the S&P U.S. Power Infrastructure Select Index—have climbed approximately 17% YTD.

Conclusion

August’s results highlighted the evolving market across multiple megatrends—from Healthcare & Wellness to Innovative Technology. Many market participants are balancing traditionally defensive positions such as precious metals with growth-driven exposures in areas like alternative medicine, energy transition and AI infrastructure. Track these developments and more in our monthly dashboard updates.

1 Gold Hits Record High on US Rate-Cut Bets, Growing Debt Concerns – Bloomberg

2 Base Metals ETFs Rally as Industrial Demand Surges—Here’s How You Can Benefit – Appreciate

3 Psychedelics regain momentum in 2025 on political tailwinds, clinical wins

4 The buzz around THC drinks is going flat – Business Insider

5 LSD shows promise for reducing anxiety in drugmaker’s midstage study – AP News

6 97% Battery Recycling Breakthrough”: Princeton NuEnergy Opens First U.S. Commercial Facility, Cutting Costs 38% and Slashing Environmental Impact – Energy Reporters

7 Trump administration cancels $679 million for offshore wind projects at ports – NPR

8 Crypto sector breaches $4 trillion in market value during pivotal week – Reuters

9 OpenAI’s new ChatGPT Agent can control an entire computer and do tasks for you – The Verge

10 Amazon DeepFleet AI Model for Robotics – Digital Commerce 360

11 The Next Big Theme: August 2025 – Global X

12 US Army pools contracts into up to $10 billion Palantir deal – Reuters

13 Deloitte Report: AI Data Center Power Demand to Surge 30x by 2035 – T&D World

14 Keller C., Thompson W., Utsav, A, “AI revolution: Meeting massive AI infrastructure demands” – Barclays

15 Constellation Commits to Billions of Dollars in Energy Investments at Inaugural Pennsylvania Energy and Innovation Summit – Constellation

The posts on this blog are opinions, not advice. Please read our Disclaimers.

The S&P 500 Christian Values Screened Index: A New Benchmark to Serve Faith-Based Needs

Contributor Image
Maria Sanchez

Director, Sustainability Index Product Management, U.S. Equity Indices

S&P Dow Jones Indices

S&P Dow Jones Indices (S&P DJI) launched the S&P 500® Christian Values Screened Index in September 2025. This milestone reflects S&P DJI’s philosophy as an independent index provider: offering choices to market participants while maintaining the objectivity and governance required by institutional investors.

Values-based investment can be traced back to 18th-century Christians in the U.S. and Europe who avoided slavery-related investments,1 establishing exclusion-based practices. However, Protestant Christian frameworks faced challenges in developing institutional-grade solutions due to diverse theological interpretations that necessitated specialized expertise. Bountiful Financial, a pioneer in faith-based investing, changed this through their newly available Evangelical Christian Investment Framework.

Using structured advisory councils, Bountiful incorporates authentic faith community insights into its Evangelical Christian Framework. This governance-driven approach strives to adhere to expressions of Christian values while maintaining institutional rigor. The Evangelical Christian Framework enables S&P DJI to more confidently meet market participant demand for specific faith-aligned solutions.

Methodology Overview

The S&P 500 Christian Values Screened Index uses a rules-based approach to screen the S&P 500 and exclude constituents in accordance with business activities aligned to Bountiful’s Evangelical Christian Framework. The index seeks to maintain similar sector weights to The 500™ as of the rebalancing reference date.2

Using Bountiful’s Religious Framework as a foundation for Evangelical Christian values and standards, S&P DJI mapped the framework against S&P Global Sustainable1’s revenue-based business involvement screens to create a precise exclusion methodology that integrates the key tenets of Christianity (see Exhibit 1).3

Historical back-testing reveals that on average, 93% of S&P 500 companies are retained (see Exhibit 2).

During the June 2025 rebalance, the index excluded only 34 companies representing 6.54% of The 500, with stem cell research being the largest exclusion category (see Exhibit 3).

The index maintains similar market weights as its benchmark through sector neutrality, using weight factors that proportionally adjust each stock based on free float market capitalization and sector representation. This approach helps to enable market participants to align with their Christian values while preserving comparable sector weighting and performance to the underlying index (see Exhibit 4). Historical back-testing indicates that the index has retained approximately 93% of companies from The 500. It exhibited a tracking error of 51-78 bps annually, with risk-adjusted returns comparable to The 500 (see Exhibit 5).

The index rebalances quarterly, effective after the close on the third Friday of March, June, September and December, aligning with the S&P 500 Catholic Values Index methodology and ensuring compliance with business activity thresholds as revenue percentages shift and market movements alter sector neutrality.

The S&P 500 Christian Values Screened Index helps to enable faith-based market participants to align their decisions with their Christian values without sacrificing rigor, coverage or performance. The index joins our comprehensive suite of values-based benchmarks, reinforcing our commitment to serving the evolving needs of global market participants and providing options to the market.

For more information about S&P DJI’s values-based index solutions, visit spglobal.com/spdji

Back-tested results are based on criteria applied retroactively with the benefit of hindsight and knowledge of factors that may have positively affected its performance. It cannot account for all financial risks that may affect actual results, and the actual performance of the index may vary significantly from the back-tested historical data.

1 Arkapretim, Roy. “The evolution of responsible investing.” Davy. June 6, 2025

2 The rebalancing reference dates are after the close of the third Friday of February, May, August and November.

3 For specific S&P Global category of involvement and description and S&P DJI level of involvement thresholds please review the S&P 500 Christian Values Screened Index Methodology.

The posts on this blog are opinions, not advice. Please read our Disclaimers.

Scoring & Screening Mid-Cap Leaders

Contributor Image
Maya Beyhan

Global Head of Sustainability, Index Investment Strategy

S&P Dow Jones Indices

In a previous analysis, we examined the S&P MidCap 400® Scored & Screened Index, derived from the S&P MidCap 400 broad market benchmark. The S&P MidCap 400 Scored & Screened Index showed key characteristics such as lower concentration compared to the S&P 500®, as well as similar industry weights to the S&P MidCap 400.

In this analysis, we turn our attention to a new sustainability benchmark for the mid-cap segment—the S&P MidCap 400 Scored & Screened Leaders Index—and highlight its key features.

Launched on April 9, 2025, the S&P MidCap 400 Scored & Screened Leaders Index measures the performance of securities with higher-than-average ESG scores, while excluding companies deriving revenue from specified business activities or that are non-compliant with United Nations Global Compact.1

Exhibit 1 summarizes the relationship between the usage of ESG scores, concentration and market-capitalization coverage for various indices in the mid- and large-cap segments, as of May 30, 2025. References to “Scored” below and in the index name indicate the use of S&P Global ESG Scores to select index constituents, while concentration (measured on the x-axis) is based on the total weight of the top 10 largest stocks in each index. The size of the bubbles reflects the market-capitalization coverage.

From Exhibit 1, we observe that the mid-cap indices showed relatively lower concentration compared to the S&P 500®-based indices—this pattern was also identified in our previous analysis. Specifically, the S&P MidCap 400 Scored & Screened Leaders Index had a concentration of 12.7% for its 10 largest stocks, the highest among the mid-cap indices, but also distinctly lower than the 46.4% concentration of the S&P 500 Scored & Screened Leaders Index.

Furthermore, the exhibit reveals that as concentration increased, ESG scores tended to rise, while market-capitalization coverage decreased.

The S&P MidCap 400 Scored & Screened Leaders Index achieved the highest ESG score among the mid-cap indices at 38.1, compared to the S&P MidCap 400’s score of 34.0. However, it also exhibited the lowest market-capitalization coverage of 50%.

Exhibit 2 further explores this relationship by analyzing the connection between ESG scores, market-capitalization coverage and the number of excluded constituents for each index. References to “Screened” below and in the index name refer to those constituents excluded based on specific eligibility criteria. In this case, the S&P MidCap 400 Scored & Screened Leaders Index stood out among the mid-cap indices with the highest number of exclusions, at 215, in contrast to just 122 for the S&P MidCap 400 Scored & Screened Index. This large number of exclusions aligns with its construction methodology, which aims to measure the performance of securities that meet stricter ESG criteria.

In summary, Exhibits 1 and 2 together show that the S&P MidCap 400 Scored & Screened Leaders Index not only aligns with key characteristics of the S&P MidCap 400—like maintaining lower concentration compared to the S&P 500—but also includes constituents that exhibit stronger-than-average ESG characteristics as measured by S&P Global ESG Scores.


1See the S&P Scored & Screened Leaders Indices Methodology.

The posts on this blog are opinions, not advice. Please read our Disclaimers.

Upcoming Enhancements to Modernize the S&P/ASX Index Series

Contributor Image
Sean Freer

Director, Global Exchange Indices

S&P Dow Jones Indices

Since the launch of the S&P/ASX Index Series, the Australian capital market has evolved considerably. Instead of calling or faxing a stockbroker, market participants today can instantly trade stocks, ETFs, options and futures contracts with much shorter settlement times by tapping a screen in the palm of their hand. As financial markets develop, index methodologies must also evolve to ensure they continue to meet their objective and effectively represent the markets they intend to measure.

As stewards of the most widely followed Australian benchmarks, S&P Dow Jones Indices (S&P DJI), in partnership with the ASX, take a prudent approach by conducting extensive research on impact and incorporating feedback from a wide range of market participants before a decision is made to modify an index methodology.

Following a market consultation in July and August, the S&P/ASX index committee reviewed the feedback and approved three changes to the wider S&P/ASX Index series.

What Are the Changes?

Three modifications to the S&P/ASX Index Series have been approved and will be implemented in the upcoming September rebalance.

  1. Reduce calculation period. Currently, the S&P/ASX 200 and S&P/ASX 300 consider companies for index inclusion based on a six-month average of their float-adjusted market capitalization and daily liquidity. This calculation period will be reduced to three months.
  2. Apply two-way turnover. Currently, stocks are added to an index once an existing constituent has exited the index due to a sufficiently low rank below an exit buffer. Going forward, once a company ranks above an index entry buffer, it can be added regardless of the ranking of other existing index constituents.
  3. Lower Investable Weight Factor (IWF). The IWF is the ratio of available free float shares to total shares outstanding. It reflects the proportion of shares available for trading in the market. The current minimum IWF for index inclusion is 0.3 and will be reduced to 0.15.

The approved changes will impact the S&P/ASX 300, S&P/ASX 200, S&P/ASX 100, S&P/ASX 50, S&P/ASX 20, S&P/ASX MidCap 50 and S&P/ASX Small Ordinaries, as well as any other index derived from these indices within the series, such as GICS® sector indices.

Why Are These Changes Being Proposed?

Today’s market environment is faster paced with regard to information flow, trading execution, holding periods, settlement and other factors. Reducing the calculation period on index eligibility criteria to three months will allow the indices to react more quickly to market changes.

The introduction of a two-way buffer will also allow more timely adjustments to index constituents. A two-way buffer is also the more common approach used among other benchmarks operated by S&P DJI.

The current IWF of 0.3 is higher than most other benchmarks operated by S&P DJI and can prevent some companies being included in the index series despite meeting minimum liquidity requirements. Furthermore, the minimum free float threshold is higher than the ASX minimum float requirement of 20% at listing.

Impacts of Proposed Changes

Based on back-testing analysis of the approved changes, we anticipate faster-growing companies being added to and represented in indices earlier; conversely poorer-performing companies can exit more quickly.

Our modeled analysis, which was included in the market consultation, resulted in a modest performance benefit to the S&P/ASX 200 and S&P/ASX 300, while not materially affecting turnover or creating a “yo-yo effect” of companies entering and exiting indices within one or two rebalances.

Modeling of the three approved enhancements to the S&P/ASX Index Series resulted in a tracking error of less than 0.2% across all periods for the S&P/ASX 200 and S&P/ASX 300.

Conclusion

The upcoming modifications to the S&P/ASX Index Series are intended to enhance the indices’ representativeness by allowing them to more quickly reflect changing market conditions while further aligning with S&P DJI index conventions.

The three index changes outlined in this paper will be implemented in conjunction with the September 2025 rebalancing, which is effective after the close on Friday, Sept. 19, 2025.

The posts on this blog are opinions, not advice. Please read our Disclaimers.

Tracking Fixed Income Performance and Innovation

What do duration, the yield curve and credit trends tell us about the evolving fixed income landscape? S&P DJI’s Anu Ganti and Ben Vörös explore the recent performance of S&P DJI’s iBoxx indices in Europe and highlight the latest innovations in the fixed income indexing toolkit.

The posts on this blog are opinions, not advice. Please read our Disclaimers.