Get Indexology® Blog updates via email.

In This List

Go Beyond Index Data: Unlocking the Full Value of Index Providers

Diversification Redefined: Exploring the S&P 500 Diversified Sector Weight Index

Direct Indexing: Customization, Transparency and Control

Mid-Cap Express

A New Approach to S&P Aristocrats: Meet the S&P Quality FCF Aristocrats Indices

Go Beyond Index Data: Unlocking the Full Value of Index Providers

Contributor Image
Brandon Hass

Global Head of Client Solutions Group, Direct Indexing and Model Portfolios

S&P Dow Jones Indices

Index providers do far more than supply the benchmarks that index-based products aim to track. They also offer a range of services that wealth managers may look to in an effort to sharpen their strategies, streamline operations and deepen advisor engagement. Yet, some firms still treat index providers solely as data vendors—underutilizing a broader toolkit available to wealth and asset managers as they seek to gain a competitive edge.

According to new research from Cerulli Associates, most wealth manager home-office executives view index providers primarily as inputs for performance measurement and benchmarking.1 But a select group—particularly those developing customized solutions, proprietary products or building model portfolios—are beginning to unlock the true potential of what index providers can offer. These firms are turning to index providers not just for data but for collaboration, and in doing so, they’re discovering new ways to differentiate and scale.

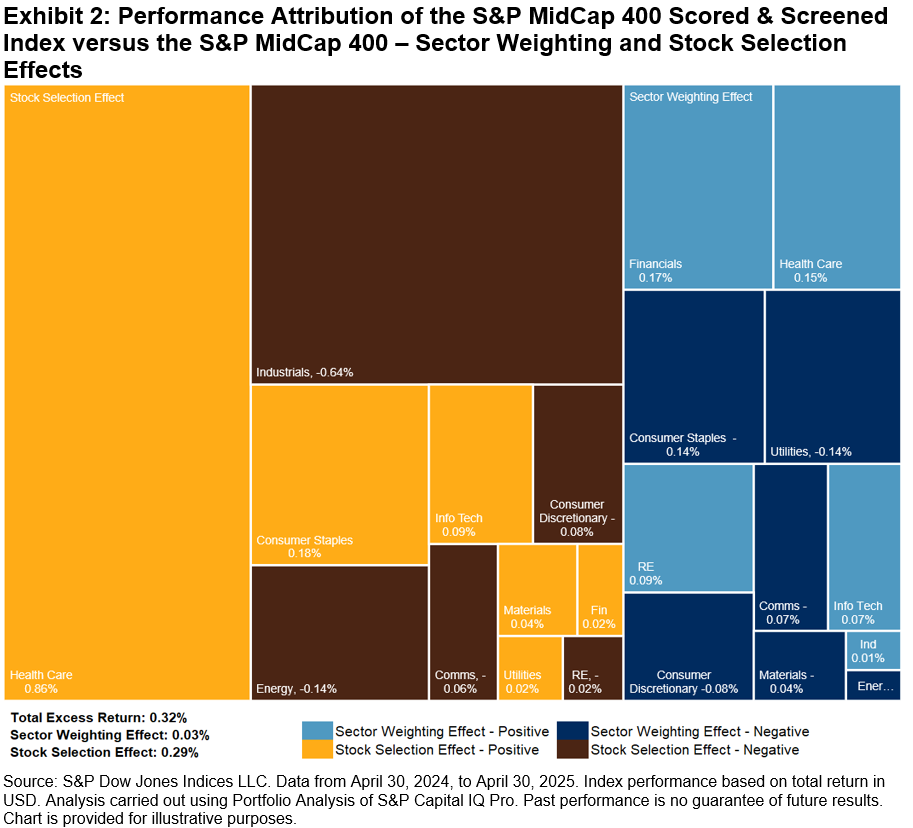
Financial Advisors’ Level of Engagement with Index Providers

A recent blog examined the forces contributing to the rise of indexing in wealth management. While the vast majority of financial advisors use index-based investment products, most aren’t engaging with index providers in other ways (see Exhibit 1).

This invites the question: what other opportunities might be available for wealth managers that seek to leverage index providers’ offerings? Index providers provide various solutions, such as data and thought leadership. Forming a strategic relationship with an index provider that taps into these capabilities can help build a foundation for developing products and solutions that advisors can incorporate into client portfolios in support of their practices.

From Index Construction to Product Development Support

The Cerulli Associates paper explores how index providers can support the product development lifecycle. That includes helping firms choose the right index exposure, offering transparency on index methodology, and advising on how index data is delivered and integrated into internal systems.

For advisory firms looking to stand out in a crowded and highly competitive field, brand alignment also matters. When launching new index-based products, licensing a brand from a known provider may lend recognition to such products, especially for firms that don’t yet have household-name status with advisors or end investors.

Furthermore, index providers can help clients customize existing indices or commission a white-label index using their own intellectual property.

Resources for Education, Distribution and Advisor Engagement

Beyond the mechanics of benchmark construction, index providers are also sources of educational content and thought leadership—another potentially underleveraged tool, especially for wealth managers.

Firms can tap into these resources to inform advisors, support distribution, and supplement product narratives with index-related information. For example, index providers can contribute to educational campaigns that explain the methodology behind a new index objective, share market context, or offer historical performance data. Providers may also support advisor meetings or webinars, giving wealth managers a way to deliver expert insights on indices directly to the field.

As wealth management incorporates outsourced portfolio construction and more scalable solutions, firms that make the most of the full range of services that index providers offer may find themselves better equipped to meet advisor needs and investor expectations. Read the full report by Cerulli Associates to learn about other ways asset and wealth managers can optimize their engagement with index providers.

1 The Cerulli Associates whitepaper “Redefining the Role of Index Providers” was sponsored by S&P Dow Jones Indices.

The posts on this blog are opinions, not advice. Please read our Disclaimers.

Diversification Redefined: Exploring the S&P 500 Diversified Sector Weight Index

Contributor Image
Wenli Bill Hao

Director, Factors and Dividends Indices, Product Management and Development

S&P Dow Jones Indices

The S&P 500® continues to be a trusted benchmark for the broad U.S. market, measuring the performance of U.S. large-cap companies across various sectors. As the market moves, certain stocks and sectors grow to represent a larger share of the index, highlighting their significant influence on the economy. While this is the natural result of market-cap weighting, some market participants are exploring alternative strategies in pursuit of enhanced diversification.

In this blog, we introduce the S&P 500 Diversified Sector Weight Index, which aims to mitigate concentration risk and address sector imbalances by reweighting companies within The 500™. This innovative approach employs a hierarchical equal sector weight methodology, utilizing Syntax’s FIS® sector taxonomy.

FIS’s Sector Taxonomy

This six-level classification system captures the diverse business models and product lines of companies. As shown in Exhibit 1, the FIS sector taxonomy consists of 8 sectors, 24 sub-sectors, 72 industries, 193 sub-industries, 311 business activities and over 3000 individual product lines in the S&P 500 universe.

Index Methodology

The S&P 500 Diversified Sector Weight Index equally weights each of the eight primary sectors defined by Syntax FIS with quarterly rebalancing.1 Within each sector, level 2 sub-sectors are equally weighted, as are level 3 industries, and so forth down to business activities level (see Exhibit 2). At the lowest level, within each business activity,2 stocks are weighted proportionally based on the revenue generated within that specific activity.

Diversification Beyond Primary Business

Unlike traditional classification systems that categorize companies solely by their primary business segment, the FIS classification scheme enables a single company to be represented across multiple sectors and industries. As a result, if a company generates revenue from more than one business activity, its final weight in the index is the sum of the weights from each of its business activities.

As shown in Exhibit 3, over 41% of S&P 500 companies engage in business activities across more than one FIS sectors, collectively accounting for 62% of the index’s total weight.

A Short- and Long-Term View of Performance

Exhibit 4 illustrates that S&P 500 Diversified Sector Weight Index has historically outperformed the S&P 500 Equal Weight Index in terms of both absolute returns and risk-adjusted returns, across both short- and long-term periods.

Characteristics of the S&P 500 Diversified Sector Weight Index

Sector Level Diversification

Exhibit 5 illustrates that the S&P 500 Diversified Sector Weight Index boasts the smallest sector weight spreads and a higher effective number of sectors3 compared to its counterparts.

Stock Level Diversification

Although primarily designed to equalize sector weights and balance business risks, the S&P 500 Diversified Sector Weight Index has also historically reduced single-stock concentration. Compared to The 500, it maintained a higher effective number of stocks and featured lower maximum stock weights (see Exhibit 6).

Conclusion

The S&P 500 Diversified Sector Weight Index has had a more balanced representation of sectors and business risks within the S&P 500 universe. Furthermore, it has historically had lower single-stock concentration. Moreover, the S&P 500 Diversified Sector Weight Index has historically outperformed the S&P 500 Equal Weight Index.

1 Please refer to S&P 500 Diversified Sector Index methodology for more detailed info.

2 Within each Business Activity, each company is assigned a weight based on the product of (1) the weight of that Business Activity and (2) the trailing last 12 months’ revenue that the company derives from that Business Activity, divided by the sum of revenue that all companies derive from that Business Activity. If a company derives revenue from multiple Business Activities, a company’s final weight is the sum of the weights from each of the company’s Business Activities.

3 Effective number of sectors is defined as the inverse of the sum of squared sector weights for each index.

The posts on this blog are opinions, not advice. Please read our Disclaimers.

Direct Indexing: Customization, Transparency and Control

How can S&P DJI indices be used with direct indexing? Direct indexing is helping reshape the future of investing, enabling customized solutions that go beyond traditional passive strategies. With hundreds of thousands of our indices available for direct indexing, the possibility for customization is extensive. 

The posts on this blog are opinions, not advice. Please read our Disclaimers.

Mid-Cap Express

Contributor Image
Maya Beyhan

Global Head of Sustainability, Index Investment Strategy

S&P Dow Jones Indices

The mid-cap segment of the U.S. equity universe, as represented by the S&P MidCap 400®, has historically offered distinct views in terms of concentration, sector weights and return drivers. This prompts an exploration of whether these trends are reflected in the S&P MidCap 400 Scored & Screened Index,1 which is a broad-based, market-cap-weighted index designed to measure the performance of securities meeting sustainability criteria, while maintaining similar overall industry group weights as the S&P MidCap 400.2

Starting with concentration, Exhibit 1 illustrates the weight of the 10 largest stocks in the S&P MidCap 400 Scored & Screened Index since its launch on Jan. 11, 2021, to April 30, 2025. The average weight stood at 9.20%, slightly higher than the S&P MidCap 400’s 6.35%. However, this concentration was significantly lower than the S&P 500 Scored & Screened Index, where the 10 largest stocks accounted for an average weight of 37.82% versus 30.05% for the S&P 500®. This indicates that while the S&P MidCap 400 Scored & Screened Index showed some concentration, it still retained greater diversification compared to its large-cap counterpart.

Next, we direct our attention to sectoral weights and their relation to excess return in the S&P MidCap 400 Scored & Screened Index versus the S&P MidCap 400. Exhibit 2 summarizes the results of the Brinson3 attribution analysis for the year ending April 30, 2025. The S&P MidCap 400 Scored & Screened Index outperformed the S&P MidCap 400 by 0.32%, primarily due to stock selection effects (0.29%) as opposed to sector weighting effects (0.03%). This aligns with the index’s construction methodology, which aims to maintain overall similar industry weights to the S&P MidCap 400.

Further analysis of excess returns reveals key distinctions between the S&P MidCap 400 Scored & Screened Index and its large-cap counterpart, the S&P 500 Scored & Screened Index. Exhibit 3 summarizes the results of a similar Brinson2 attribution analysis and shows that the S&P 500 Scored & Screened Index underperformed the S&P 500 by 2.82% over the one-year period shown, primarily due to negative stock selection effects (-2.64%). Sector contributions varied significantly: the performance of the S&P MidCap 400 Scored & Screened Index was boosted by the Health Care (0.86%) sector, while Industrials (-0.64%) contributed negatively to performance (see Exhibit 2). Conversely, the S&P 500 Scored & Screened Index faced significant negative selection effects in Information Technology (-1.11%) and Communication Services (-1.09%), with only a minor negative stock selection effect from Health Care (-0.03%; see Exhibit 3).

In summary, past results underscore the distinct differences in concentration, sector exposures and return drivers between the S&P MidCap 400 Scored & Screened Index and the S&P 500 Scored & Screened Index, reflecting the historical trends in their respective broad market benchmarks. Given these insights, the S&P MidCap 400 Scored & Screened Index shows its potential as a diversified benchmark for the mid-cap U.S. equity universe while pursuing sustainability criteria.

1 Formerly known as the S&P MidCap 400 ESG Index.

2 See the S&P Scored & Screened Index Series Methodology.

3 For more information on this widely used performance attribution model, see Brinson, Gary P., Hood, L. Randolph, Beebower, Gilbert L., “Determinants of Portfolio Performance,” Financial Analysts Journal, July-August, 1986.

The posts on this blog are opinions, not advice. Please read our Disclaimers.

A New Approach to S&P Aristocrats: Meet the S&P Quality FCF Aristocrats Indices

How does at least 10 consecutive years of free cash flow growth influence risk/return? Look inside the S&P Quality FCF Aristocrats Indices and see how a focus on consistent and efficient free cash flow generation has historically led to improved fundamentals, defensive characteristics and outperformance relative to the benchmark.

The posts on this blog are opinions, not advice. Please read our Disclaimers.