


With the surprisingly widespread U.S. tariff hikes announced by President Trump in early April, the geographic source of corporate revenues is coming under the spotlight, as reciprocal trade agreements are being redrawn globally.
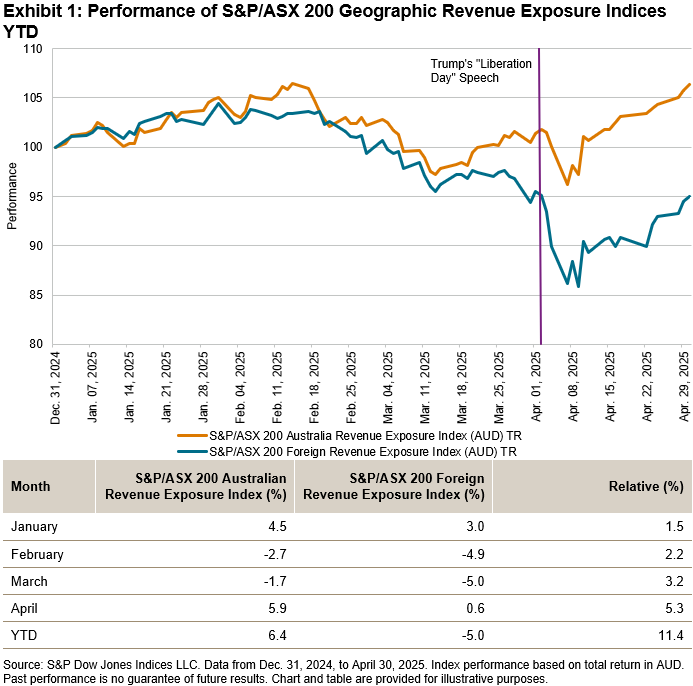
The resulting volatility of share prices following Trump’s April 2 “Liberation Day” speech is not surprising, given the globalization and interconnectedness of company revenue sources and supply chains. Some companies are more exposed to a potential trade war than others; for example, those that have products or inputs to products that are highly reliant on foreign markets (such as miners and automakers), while other companies may be more domestically focused (such as banks, telecommunications and utilities companies).
The S&P/ASX 200 Geographic Revenue Exposure Indices offer insight into the performance of Australian companies. The S&P/ASX 200 Australia Revenue Exposure Index includes companies from the S&P/ASX 200 that have greater-than-average revenue exposure to Australia. Conversely, the S&P/ASX 200 Foreign Revenue Exposure Index includes the companies with greater-than-average exposure to markets outside Australia. The indices are weighted by float market cap.1
A Return to Domestic Outperforming
After a lengthy period of underperformance, the S&P/ASX 200 Australia Revenue Exposure Index has reverted to a strong period of outperformance over the past two years. More recently, the S&P/ASX 200 Australia Revenue Exposure Index has outperformed the S&P/ASX 200 Foreign Revenue Exposure Index in each of the first four calendar months of 2025, with April being a watershed month.
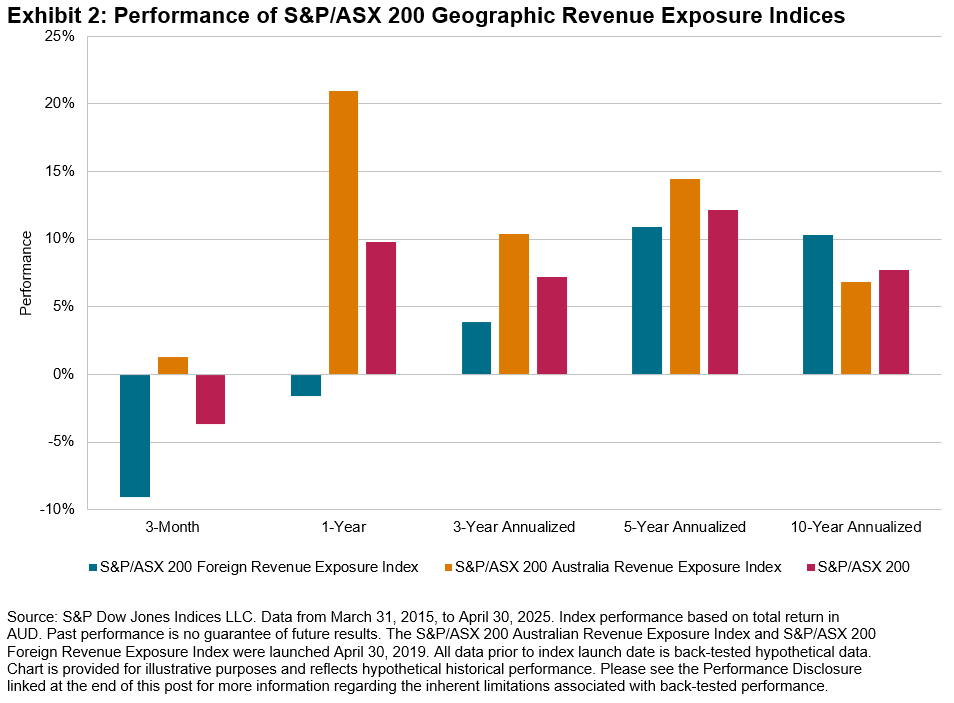
The recent strong performance numbers have resulted in the S&P/ASX 200 Australia Revenue Exposure Index outperforming within all the time periods up to the 5-year period ending April 30, 2025, whereas the S&P/ASX 200 Foreign Revenue Exposure Index outperformed over the 10-year period.
Performance Drivers
While trade policy has certainly influenced the short-term price movements, several other factors have influenced longer-term performance, including fluctuations in both currency and interest rates.
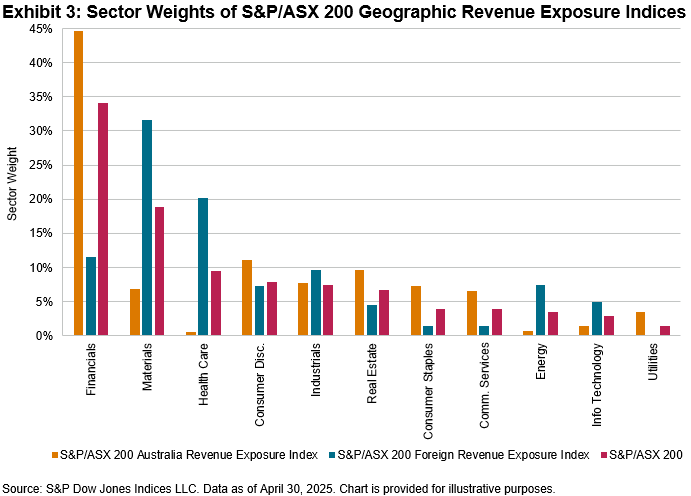
The types of companies and sectors represented in each index also help identify performance drivers. The S&P/ASX 200 Foreign Revenue Exposure Index is overweight in companies in the Materials, Health Care and Information Technology sectors relative to the S&P/ASX 200, while the S&P/ASX 200 Australia Revenue Exposure Index is tilted toward the Financials, Real Estate, Communication Services, Consumer Staples and Consumer Discretionary sectors.
Over periods beyond five years, the S&P/ASX 200 Foreign Revenue Exposure Index has outperformed on the back of strong returns within the aforementioned overweighted sectors; Materials, Health Care and Information Technology. Many companies in these sectors have benefitted from a weakening Australian dollar from 2013 to 2022.
However, more recently, a somewhat stabilized exchange rate and the interest rate increases in 2022 and 2023 have supported the large banks, while domestic consumer companies and those in the Real Estate sector have also performed well during the past two years despite cost-of-living concerns.
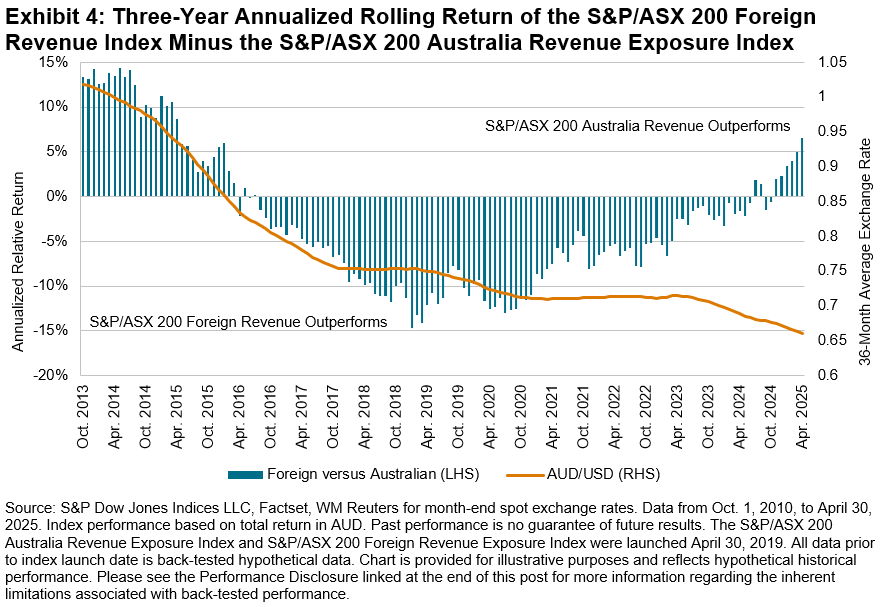
If we review rolling three-year annualized periods, we can see more clearly the phases in which companies with greater domestic revenue exposure outperformed and vice versa. Since the Australian dollar dropped below 80 cents to the U.S. dollar, the foreign revenue exposure index consistently outperformed the Australian revenue exposure index by more than 5% until about two years ago, when the rising interest rates supported Financials—a large component in the S&P/ASX 200 Australian Revenue Exposure Index.
The S&P/ASX Geographic Revenue Exposure Indices highlight how trade policy, currency movements and interest rates can have a meaningful impact on differing segments of the Australian equity market. The S&P/ASX 200 Geographic Revenue Exposure Indices group constituents as either majority foreign or domestic earners and are a useful lens to analyze market performance during different macro events or stages of an economic cycle.
1 Please refer to the methodology document for S&P Global Revenue Exposure Indices for more information: https://www.spglobal.com/spdji/en/documents/methodologies/methodology-sp-global-revenue-exposure-indices.pdf
The posts on this blog are opinions, not advice. Please read our Disclaimers.


