Get Indexology® Blog updates via email.

In This List

S&P/ASX 200 High Dividend Index: Q3 2024 Performance Attribution

Introducing the Dow Jones Developed Green Real Estate Index

Equity Exuberance and Fixed Income Foreshadowing

Seeing Green: The Next Infrastructure Wave

A Review of the Recent Strong Performance of the S&P 500 Quality, Value & Momentum Multi-Factor Index

S&P/ASX 200 High Dividend Index: Q3 2024 Performance Attribution

Contributor Image
Izzy Wang

Associate Director, Factors and Dividends

S&P Dow Jones Indices

The S&P/ASX 200 High Dividend Index seeks to measure the performance of the 50 companies with the highest 12-month forecast dividend yield from the S&P/ASX 200. Historically, the index has consistently delivered higher-than-market dividend yield and long-term outperformance against its benchmark. From July 2011 to September 2024, the index had an average trailing 12-month gross dividend yield of 5.5% and an annual excess return of 1.8% compared with the S&P/ASX 200.

Exhibit 1 shows the historical performance of the S&P/ASX 200 High Dividend Index. Year-to-date, the index experienced short-term underperformance against the market, lagging the S&P/ASX 200 by 3.6% as of Sept. 30, 2024. To better understand the source of the excess return, we are taking a closer look at the index’s short-term and long-term performance.

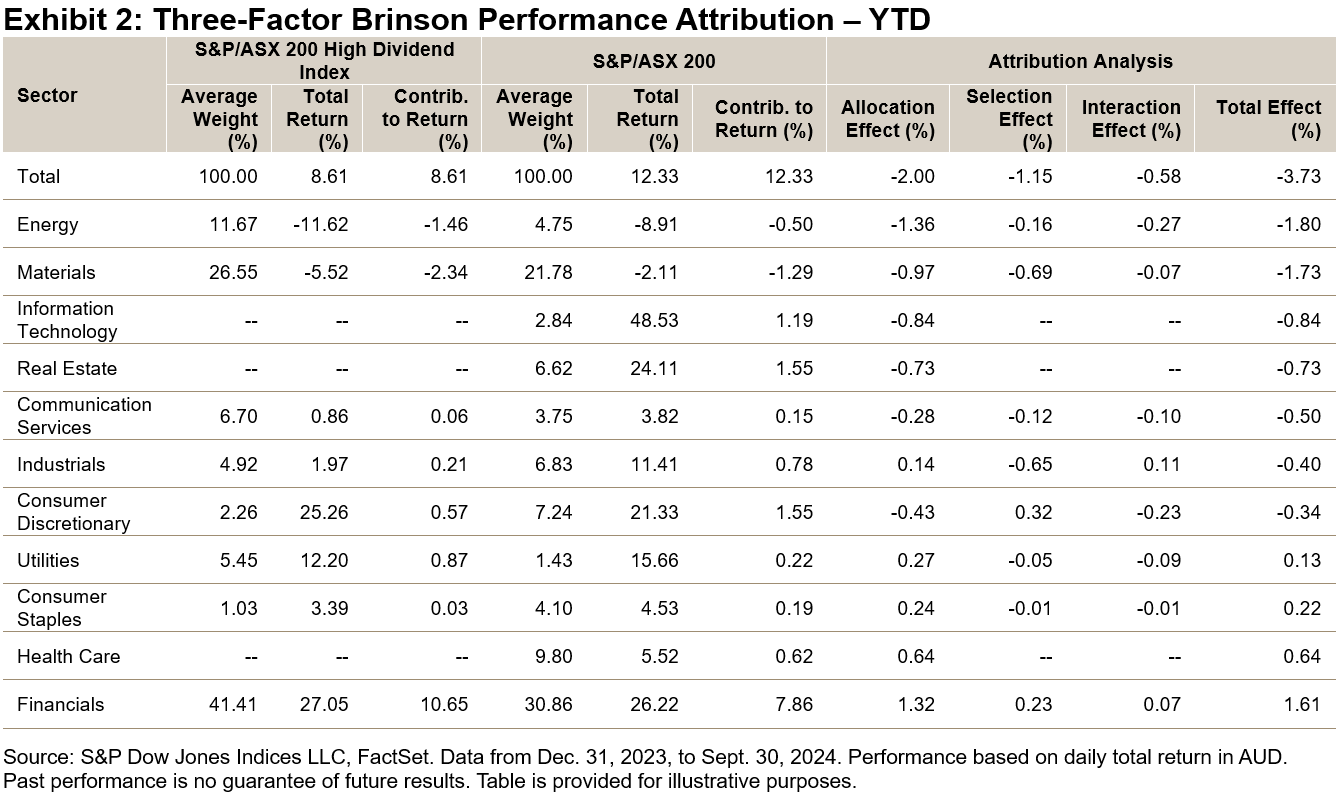
As Exhibit 2 shows, the YTD underperformance against the S&P/ASX 200 could be largely attributed to an overweight in the Energy and Materials sectors and an underweight in the Information Technology and Real Estate sectors. Increased weight in some high-yielding mega-caps such as Woodside Energy Group and Fortescue Ltd was the primary reason for the overweight in Energy and Materials. Lacking weight in Information Technology and Real Estate aligns with a high-dividend-yield strategy based on the S&P/ASX 200 Ex-A-REITs universe.

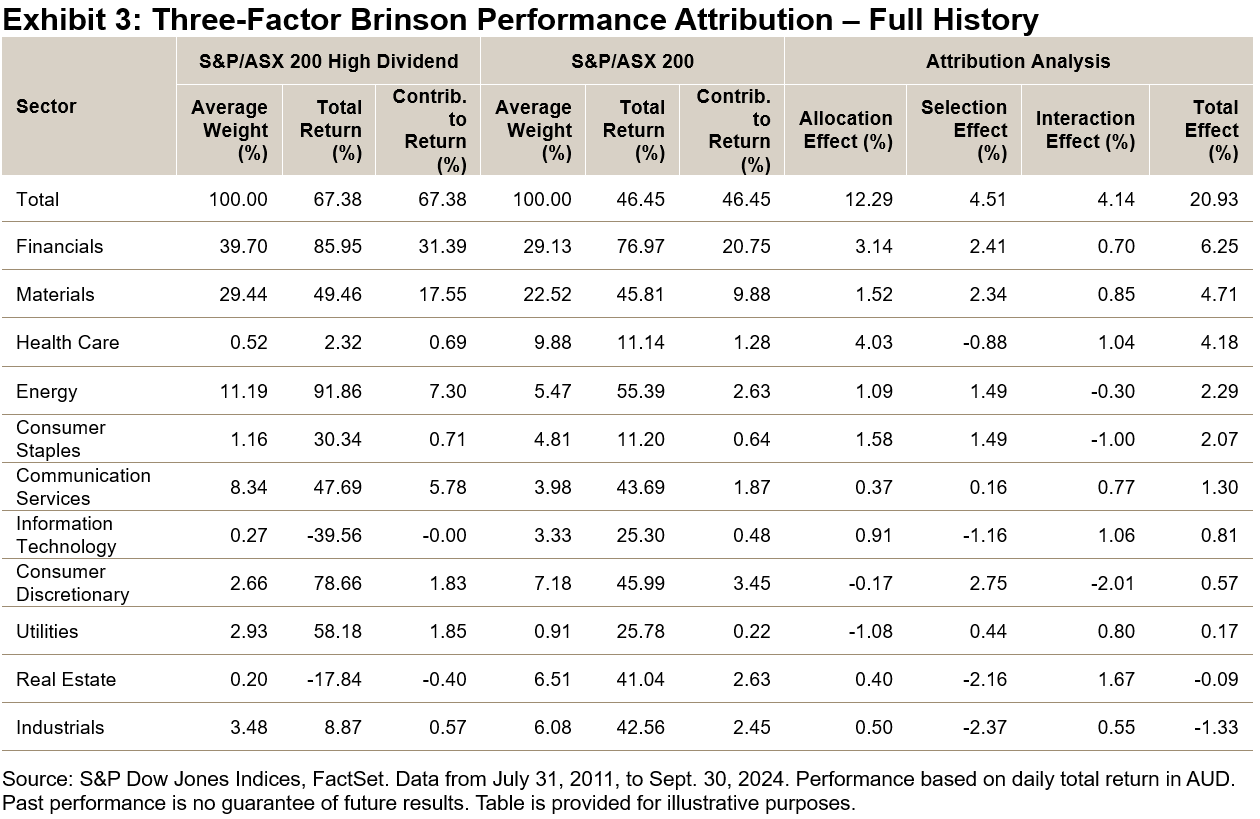
While overweighting Energy and Materials in the S&P/ASX 200 High Dividend Index has not delivered excess return YTD, it has been a major contributor to the long-term outperformance since 2021. From Dec. 31, 2020, to Sept. 30, 2024, the S&P/ASX 200 High Dividend Index had a total return of 68.2%1 in contrast to 46.5% from the S&P/ASX 200. We can mainly attribute the outperformance to allocation effect rather than selection effect (see Exhibit 3). Financials, Materials, Health Care, Energy and Consumer Staples were the largest contributors. Over the longer term, the S&P/ASX 200 Index underweighted Health Care and Consumer Staples, while overweighting Financials, Materials and Energy.

To sustain a higher-than-market dividend yield level, the index selects eligible stocks from the S&P/ASX 200 based on forecast dividend yield. Some familiar names may be excluded due to low yield ranking. As of the July 2024 rebalancing, Wesfarmers, Commonwealth Bank Australia and Macquarie Group had a forecast dividend yield of approximately 3.5%, which is relatively low compared with the weighted average dividend yield of 5.5% for the S&P/ASX 200 High Dividend Index.

As Exhibit 4 shows, the S&P/ASX 200 High Dividend Index has been able to maintain a dividend yield that is about 1.5% higher than the market level for the past 10 years. As of Sept. 30, 2024, the trailing 12-month dividend yield of the S&P/ASX 200 High Dividend Index is 5.14%, while that of the S&P/ASX 200 is 3.47%.

Like all factor indices, the S&P/ASX 200 High Dividend Index has experienced performance reversions during the short term. More importantly, the index consistently targets companies with high dividend yield and has historically delivered some excess return in the long term.

1 FactSet generated index return (see Exhibit 3) is 0.8% less than the official cumulative index total return of the S&P/ASX 200 High Dividend Index.

The posts on this blog are opinions, not advice. Please read our Disclaimers.

Introducing the Dow Jones Developed Green Real Estate Index

Contributor Image
Silvia Kitchener

Director, Global Equity Indices, Latin America

S&P Dow Jones Indices

A renewed interest in Real Estate has emerged as declining interest rates tend to bring more favorable conditions to the industry. For 16 of the last 31 years in developed markets, the Real Estate sector has outperformed the broader equity market as measured by relevant indices.1

The COVID-19 pandemic struck at the core of the Real Estate sector by shutting down offices, hotels, retail stores and more, while subsequent interest rate hikes by the U.S. Federal Reserve to mitigate inflation led to a divergence between these indices. Together, these challenges have hampered industry recovery efforts, keeping Real Estate index performance in negative territory over the past four years.

However, as the pandemic subsided, inflation was reduced to 2.4% in September 2024 from its peak of 9.1% in June 2022,2 and interest rates started to decrease, interest in Real Estate re-emerged. This past year, Real Estate indices have experienced a resurgence in performance, with the Dow Jones Developed Markets Real Estate up 31.2% for the one-year period ending September 2024 (see Exhibit 1).

“Green” Real Estate investments have attracted global market interest, especially as reports show that total energy consumption and CO2 emissions in 2021 surpassed pre-pandemic levels, falling short of 2050 decarbonization goals.3 This trend makes benchmarks like the Dow Jones Developed Green Real Estate Index a critical tool to denote the index constituents that have demonstrated improved sustainabilty credentials and reduce physical risk exposure at the index level as outlined in the index methodology. Exhibit 2 provides a closer look at the key methodology attributes and data sources used in the index.

Exhibit 3 shows that the Dow Jones Developed Green Real Estate Index has historically tracked its benchmark, the Dow Jones Developed Markets Select RESI, very closely, which is consistent with a low tracking error.

Similar to traditional Real Estate indices, the Dow Jones Developed Green Real Estate Index has historically performed better during periods of decreasing rates, and it has historically underperformed when rates rise. This could be expected, as rising rates tend to decrease the profitability of Real Estate investments. For example, between Dec. 31, 2021, and Oct. 24, 2023, when the 10-Year U.S. Treasury rate increased by 343 bps, the Dow Jones Developed Markets Select RESI (USD, TR) was down 32.1%. Conversely, between Oct. 31, 2023, and Sept. 30, 2024, when the 10-Year U.S. Treasury rate dropped 114 bps, the index was up 38.8%.

Historical performance that closely tracks its benchmark is only part of the story; Exhibit 4 shows that the Dow Jones Developed Green Real Estate Index reflects strong score improvements relative to the underlying index.

Conclusion

The Dow Jones Developed Green Real Estate Index measures Real Estate companies through an ESG lens. By integrating environmental data and rigorous selection criteria, the index serves as a benchmark for market participants to monitor not just Real Estate performance but also ESG improvements of the Real Estate sector as companies in the sector seek to align with developing global sustainable initiatives.

1 Reference is based on the Dow Jones Developed Markets Real Estate Index and the Dow Jones Developed Markets Index, which are sub-indices of the Dow Jones Global Index.

2 CPI Home : U.S. Bureau of Labor Statistics

3 Source: U.N. Environment 2022 Global Status Report for Buildings and Construction Towards a zero-emissions, efficient and resilient buildings and construction sector. 2022 Global Status Report for Buildings and Construction | UNEP – UN Environment Programme.


The posts on this blog are opinions, not advice. Please read our Disclaimers.

Equity Exuberance and Fixed Income Foreshadowing

Contributor Image
Anu Ganti

Head of U.S. Index Investment Strategy

S&P Dow Jones Indices

In the immediate aftermath of the 2024 presidential election, U.S. equities soared on Wednesday, November 6, with the S&P 500® up 3%, while small caps surged even higher, with the S&P SmallCap 600® up a substantial 6%. Subsequently, on Thursday, November 7, the much-anticipated Fed rate cut of 25 bps came to fruition. With two previously uncertain macro events in the rearview mirror, the equity market sighed in relief, as VIX® plunged to below the 15 handle, and the S&P 500 marked its 51th record closing high of the year on Monday, November 11.

As we look ahead to the rest of Q4 2024, we can look to history to understand how equity markets typically reacted post-presidential elections. Looking back over 60 years, the S&P 500 rose in 13 out of the past 16 fourth quarters following a presidential election, or 81% of the time.

Turning our attention to smaller caps, albeit with a shorter history, Exhibit 1 illustrates that the S&P 600 rose in 6 out of the 7 fourth quarters following a presidential election since 1996, and it outperformed the S&P 500 in 5 of those quarters. Q4 2020 was a notable example, with a gain of 31% for the S&P 600. As of Nov. 11, 2024, the S&P 500 was up 4% and the S&P 600 was up 8% QTD.

While U.S. equity markets have typically rallied following a presidential election, the bond market’s movements have historically shown less of a directional trend, as shown in Exhibit 2. Looking back 60 years, 10-year U.S. Treasury yields increased in 9 out of the past 15 fourth quarters in presidential election years, or 60% of the time. A noteworthy decrease was in Q4 2008, when the market witnessed an extraordinary decline in yields as investors sought the safety of bonds amid the depths of the Global Financial Crisis. However, yields consistently increased following the last three elections, especially in 2016, upon rising inflation expectations and anticipated Fed rate hikes.

This year is no ordinary election year for bond market participants, as even though the Fed has cut rates twice, 10-year U.S. Treasury yields have increased and are up 50 bps QTD, perhaps due to lingering inflationary concerns that have been exacerbated by anticipated Trump policies, including tax cuts and tariffs.

Another oddity of this election year for the bond market is a yield curve that has begun to disinvert, as measured by the spread between 10- and 2-year U.S. Treasury yields in Exhibit 3. Since 1976, there have been only two presidential election years with inverted yield curves that subsequently disinverted. The first occurred in 1980, when the Fed was hiking rates to battle rampant inflation, and the second was in 2000, when the Fed was also raising rates to fight inflation during the dot-com boom.

The disinversion of the yield curve has been a traditional harbinger of a recession, as seen in 1980 and following the bursting of the tech bubble in 2001. This election year was also the first time a Republican contender beat a one-term Democratic president since 1980. Whether 2024 will follow in the footsteps of history remains to be seen.

The posts on this blog are opinions, not advice. Please read our Disclaimers.

Seeing Green: The Next Infrastructure Wave

Contributor Image
Vidushan Ragukaran

Global Equities & Thematic Indices

S&P Dow Jones Indices

Investment in infrastructure has long been a cornerstone of economic development. It has also been an interesting choice for investors, historically offering stable, predictable cash flows through long-term, inflation-linked contracts, as well as essential services that maintain demand even during economic downturns.

At the Crossroads of Multiple Driving Forces

In the wake of aging assets worldwide, ongoing climate challenges and an artificial intelligence-led digital revolution, the case for infrastructure investment today is more critical than ever. The current interest rate environment also provides useful context, as lower financing costs facilitate larger-scale projects. The U.S. Federal Reserve cut interest rates by 50 bps in September 2024, representing the first cut in four years, with more cuts anticipated throughout the remainder of 2024.1

Global Infrastructure Assets: Updates Available

Many infrastructure assets around the world such as roads, bridges and water systems are reaching the end of their useful lives. In the U.S., for example, the average age of a bridge is 44 years, while the average lifespan for significant pipes and dams is 45 and 57 years, respectively.2

The same applies to Europe’s infrastructure, much of which was built during post-war periods. Aging water infrastructure in the U.K. is responsible for approximately 3 billion liters of daily water loss due to leaky pipes.3 Most of the continent’s nuclear reactors—a key source of energy in countries like France—were built in the 1970s and 1980s and were commissioned to last about 30 years.4 There is renewed interest in nuclear energy and other energy infrastructure to power the rising demand for artificial intelligence.

Governments worldwide face pressure to act by replacing worn-out assets and adopting advanced technology to extend asset life and improve efficiency. In the U.S., the Bipartisan Infrastructure Law, which was signed in 2021 and authorized USD1.2 trillion for transportation and infrastructure spending, has helped fund improvements on over 165,000 miles of roads, while also financing over 1,400 drinking water and wastewater projects across the country to ensure access to clean water.5, 6

The Multi-Trillion-Dollar Gap

Global infrastructure is currently facing a considerable investment shortfall, with previous estimates suggesting a USD15 trillion gap by 2040 to meet worldwide infrastructure needs and achieve the UN Sustainable Development Goals (SDGs) for universal water and electricity access.7 A joint effort between public and private sectors is essential, harnessing the strengths of both channels to build resilient infrastructure—a basic tenet for a well-functioning and modern society.

Tracking Global Infrastructure with S&P DJI Indices

Typically, market participants invest directly in infrastructure assets or through the listed route in the form of publicly traded infrastructure companies.

The S&P Global Infrastructure Index measures the performance of publicly traded companies from around the world that are chosen to represent the listed infrastructure industry. The Dow Jones Brookfield Global Infrastructure Index measures the performance of pure-play infrastructure companies domiciled globally. To be eligible for inclusion, a company must derive more than 70% of its estimated cash flows (based on publicly available information) from infrastructure assets (see Exhibit 1).

Both indices have a global focus, measuring companies from around the world that are listed in developed markets to enhance tradability. While developed markets contend with aging infrastructure and modernization needs, emerging markets face added challenges related to population growth and urbanization.

The infrastructure theme encompasses multiple sectors of the global economy, providing a diversified view of activities related to this topic (see Exhibit 2).

Feeling the Heat: the Climate-Infrastructure Nexus

Climate change is another challenge, harming infrastructure through severe weather and rising sea levels, and leading to damage and higher repair costs. To address this, infrastructure must be purpose-built, in order to better handle climate challenges and reduce environmental harm.

The Dow Jones Brookfield Global Green Infrastructure Index measures the performance of selected securities from the Dow Jones Brookfield Infrastructure Plus Index, a curated universe designed to focus on thematic purity, while considering tradability.8 The former gives due consideration to measures of physical risk, total impact and reduced greenhouse gas (GHG) emissions. The index also features exclusions for companies involved in specific controversial business activities, for example, fossil fuel operations and power generation. Overall, it seeks to track the underlying index while aiming to improve selected index-level ESG characteristics; for example, targeting at least a 30% reduction in GHG emissions and an improved S&P Global ESG Score by excluding the lowest 25% of performers. As of Oct. 31, 2024, it included 73 of the 129 constituents from the underlying index.

The critical need for infrastructure investment presents a unique opportunity sitting at the intersection of several fundamental global issues. The Dow Jones Brookfield Global Green Infrastructure Index tracks pure-play infrastructure companies worldwide, while adhering to strict tradability rules and criteria that highlight selected companies and targets an improved ESG profile at the index level.


1 Reuters (2024). “Federal Reserve to cut rates by 25 basis points at next two meetings: Reuters poll.” Available at: https://www.reuters.com/markets/rates-bonds/federal-reserve-cut-rates-by-25-basis-points-next-two-meetings-2024-10-29/

2 Madden, J. (2024). “America’s Aging Infrastructure.” Blueprint. Available at: https://wp.nyu.edu/blueprint/2024/05/15/americas-aging-infrastructure/

3 Muggleton, J. (2023). “The UK’s water pipe upgrade has made it harder to detect leaks – now the race is on to discover new ways to find them.” The Conversation. Available at: https://theconversation.com/the-uks-water-pipe-upgrade-has-made-it-harder-to-detect-leaks-now-the-race-is-on-to-discover-new-ways-to-find-them-209537

4 Ferreira, V. G. (2024). “Strategic autonomy and the future of nuclear energy in the EU.” European Parliamentary Research Service (EPRS), February. Available at: https://www.europarl.europa.eu/RegData/etudes/BRIE/2024/757796/EPRS_BRI(2024)757796_EN.pdf

5 Pipeline and Hazardous Materials Safety Administration. (2023). “Bipartisan Infrastructure Law (BIL) / Infrastructure Investment and Jobs Act (IIJA).” United States Department of Transportation. Available at: https://www.phmsa.dot.gov/legislative-mandates/bipartisan-infrastructure-law-bil-infrastructure-investment-and-jobs-act-iija

6 The White House. (2024). “FACT SHEET: Biden-Harris Administration Kicks Off Infrastructure Week by Highlighting Historic Results Spurred by President Biden’s Investing in America Agenda.” The White House. Available at: https://www.whitehouse.gov/briefing-room/statements-releases/2024/05/13/fact-sheet-biden-harris-administration-kicks-off-infrastructure-week-by-highlighting-historic-results-spurred-by-president-bidens-investing-in-america-agenda/

7 George, A., Kaldany, R.-R., & Losavio, J. (2019). “The world is facing a $15 trillion infrastructure gap by 2040. Here’s how to bridge it.” World Economic Forum. Available at: https://www.weforum.org/stories/2019/04/infrastructure-gap-heres-how-to-solve-it/

8 The Dow Jones Brookfield Global Infrastructure Plus Index is designed to measure the performance of companies from the Dow Jones Brookfield Global Infrastructure Index and the S&P Global Infrastructure Index. The index is subject to a 75% floor on the weight of all constituents selected from the Dow Jones Brookfield Global Infrastructure Index to focus on thematic purity whilst considering tradability. For more information, please see the index web page.

The posts on this blog are opinions, not advice. Please read our Disclaimers.

A Review of the Recent Strong Performance of the S&P 500 Quality, Value & Momentum Multi-Factor Index

Contributor Image
Hugo Barrera

Senior Analyst, Product Management

S&P Dow Jones Indices

S&P 500 Quality, Value & Momentum Multi-Factor Index

Multi-factor strategies offer a comprehensive approach to index-based investing by combining diverse factors that exhibit low correlations across different market environments. By integrating these factors, multi-factor indices have historically shown lower volatility and better performance, while avoiding the need to time individual factors to align with specific economic trends or market phases.

A notable example is the S&P 500® Quality, Value & Momentum (QVM) Multi-Factor Index, launched on Jan. 30, 2017, which has demonstrated notable performance. In this blog, we will explore the index’s methodology and examine its characteristics, risk/return profile and performance attribution.

Methodology Overview

The S&P 500 QVM Multi-Factor Index tracks 100 stocks from the S&P 500 that exhibit the strongest combination of quality, value and momentum. Utilizing a bottom-up approach, the index selects “all-rounders” that have the highest scores, on average, across all three factors. The S&P 500 QVM Multi-Factor Index aims to provide a richer multi-factor exposure and help address the factor dilution often seen in top-down approaches.1

Selected constituents are weighted by the product of their market capitalization and multi-factor score. Exhibit 1 summarizes the metrics used to construct the S&P 500 QVM Multi-Factor Index.

Live Performance of the S&P 500 QVM Multi-Factor Index

Since its launch date, the S&P 500 QVM Multi-Factor Index has shown strong performance, in line with its benchmark. Notably, its three-year return has exceeded that of the S&P 500 by 3.45% annualized, which is quite remarkable given the recent performance of this large-cap benchmark.

Back-Tested Performance of the S&P 500 QVM Multi-Factor Index

Over the longer term, including back-tested performance, the S&P 500 QVM Multi-Factor Index has outperformed its benchmark both in absolute and risk-adjusted terms. Additionally, the index has exhibited reduced volatility, lower drawdowns and lower downside capture.

Live Sector Weights of the S&P 500 QVM Multi-Factor Index

Exhibit 4 shows how the sector weights of the S&P 500 QVM Multi-Factor Index have changed over time. On average, the largest sector weights in the index have been Information Technology, Financials and Health Care.

Fundamental Metrics of the S&P 500 QVM Multi-Factor Index

Exhibit 5 shows the ROE and long-term debt to capital metrics of the S&P 500 QVM Multi-Factor Index since its launch. On average, the index has shown a higher ROE and a lower long-term debt to capital ratio compared to its benchmark.

YTD Performance Attribution of the S&P 500 QVM Multi-Factor Index

Exhibit 6 evaluates the YTD performance of the S&P 500 QVM Multi-Factor Index using the Brinson attribution method. It reveals that the recent outperformance can be attributed to both allocation and selection effects, which contributed 4.3% and 4.1%, respectively. Notably, the selection effect played a significant role, showcasing the effect of a bottom-up multi-factor strategy based on a composite of quality, value and momentum factors.

Conclusion

Multi-factor strategies offer an approach to navigating the complexities of selecting and timing individual factors. These strategies have historically led to improved risk-adjusted returns and more stable excess return outcomes, thanks to their diverse factor makeup.

The S&P 500 QVM Multi-Factor Index employs a bottom-up methodology that selects stocks with high average multi-factor scores across quality, value and momentum. Over the long term, the index has beaten the S&P 500, demonstrating significant outperformance over the recent three-year period. With historical benefits such as long-term return outperformance, reduced volatility and enhanced multi-factor exposure, the S&P 500 QVM Multi-Factor Index is a unique index with a diversified factor makeup.


1Innes, Andrew, The Merits and Methods of Multi-Factor Investing,” S&P Dow Jones Indices, April 2018.

The posts on this blog are opinions, not advice. Please read our Disclaimers.