Get Indexology® Blog updates via email.

In This List

Contributions across Multiple Sectors as the S&P/ASX All Technology Index Outperforms

S&P DJI’s Global Islamic Equity Benchmarks Rose 13% in H1 2024, Outperforming Conventional Benchmarks

Dispersion at All-Time High Relative to Volatility as Earnings Season Arrives

S&P Dividend Aristocrats and the Search for Income

Of Tariffs Tango and Manufacturing Moves

Contributions across Multiple Sectors as the S&P/ASX All Technology Index Outperforms

Contributor Image
Sean Freer

Director, Global Exchange Indices

S&P Dow Jones Indices

As well-known technology giants continue to make headlines globally, acquiring monikers such as FAANG and the Magnificent 7, there are smaller (yet no less innovative) Australian-listed companies across a range of sectors that are at the forefront of fast-paced technology advancements such as AI and digital transformation.

The S&P/ASX All Technology Index outperformed all Australian equity segments, sectors and styles in 2023, posting a total return of 36.0%. The index continued the same growth trajectory in the first half of 2024, ending the period with a total return of 17.0%. Over the longer term, the index has returned 12.7% per year over 5 years and 14.6% per year over 10 years, significantly outperforming the S&P/ASX 200.

Unlike for the S&P 500®, Information Technology Companies Are Not Driving S&P/ASX 200 Returns

The Magnificent 7 (Apple, Microsoft, Nvidia, Amazon, Alphabet and Meta) make up over 30% of the S&P 500 and are key drivers of performance for the iconic large-cap U.S. equity index. However, the big banks and mining companies are still the main market drivers in Australia. The S&P/ASX 200 contains just 11 Information Technology companies, which comprise just over 3% of the flagship Australian equity index.

A Multi-Sector Approach to Technology throughout Size Segments

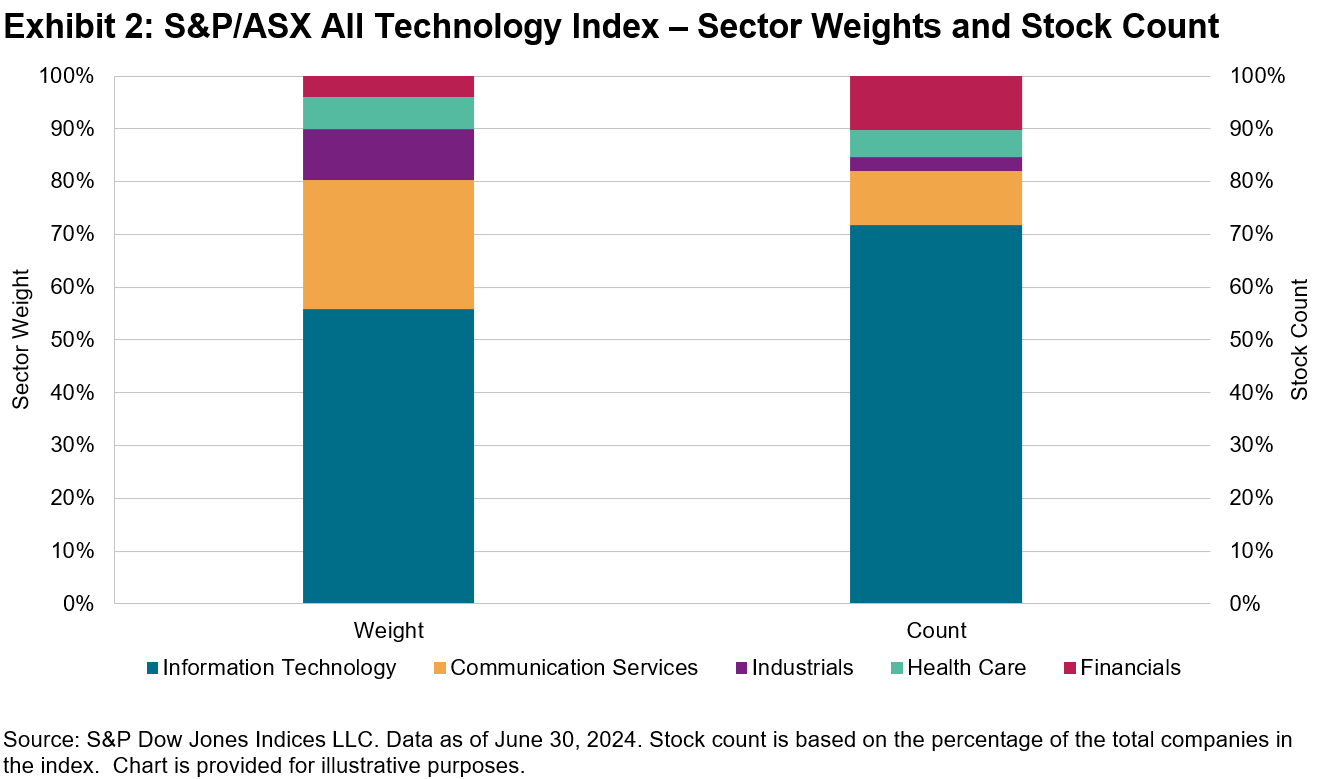
Launched in February 2020, the S&P/ASX All Technology Index reflects innovative technology-oriented companies across a broad range of sectors and industries, as well as market capitalization size segments. Currently comprising 39 companies, the index measures not just the Information Technology sector, but also companies in specific technology oriented sub-industries within the Health Care, Consumer Discretionary,1 Communication Services, Industrials and Financials sectors.

The S&P/ASX All Technology Index also looks beyond the well-established companies in the S&P/ASX 200. Smaller companies that could be future technology leaders are also eligible for inclusion, provided they meet the minimum float-adjusted market capitalization average of AUD 120 million over the previous three months at the rebalance reference date.2

Performance Drivers

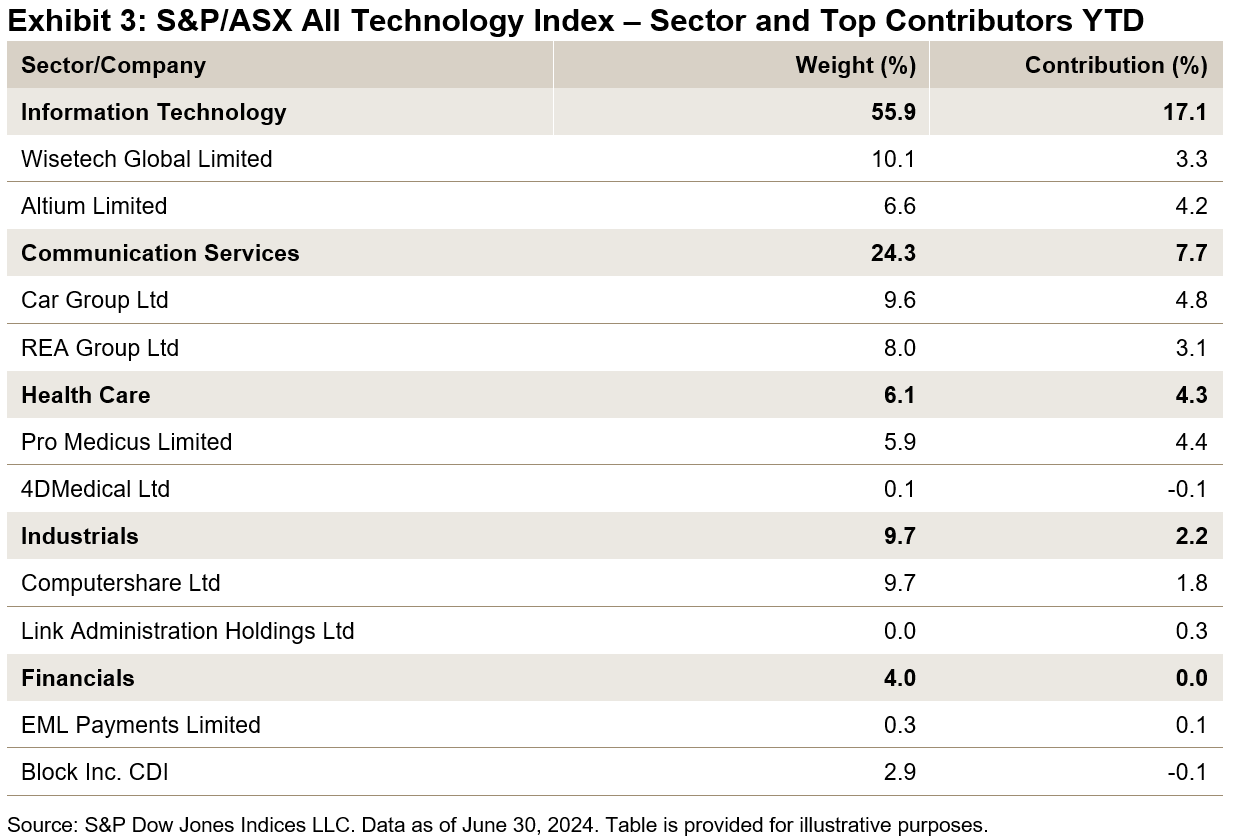
While the Information Technology sector contributed the most to performance YTD, key performance drivers at the stock level within the S&P/ASX All Technology Index have come from the Communication Services sector, with Car Group (formerly Carsales.com), and the Health Care sector, via Pro Medicus limited. All sectors contributed positively to the index’s return in the one-year period ending June 30, 2024.

New Index Additions and Deletions

Three new companies were added to the S&P/ASX All Technology Index at the recent June 2024 rebalance: Bravuria Solutions, Gentrak Group and Qoria Ltd. Bravuria Solutions is classified in the Information Technology sector and provides software solutions to financial services businesses. Initially listed on the ASX in 2016, Qoria Ltd. is in the Information Technology sector and provides child digital safety and well-being solutions. Gentrack Group is a New Zealand headquartered company with shares floated on both the NZX and ASX and provides cleantech solutions to Utilities companies.

Link Market Services was fully acquired by Mitsubishi UJF Trust Banking Corporation and exited the index in May 2024 upon the listing removal from the ASX.

1 Note, there are currently no companies that are eligible for inclusion from the Consumer Electronics sub-industry of the Consumer Discretionary sector.

2 For more information on index construction, see the methodology.

The posts on this blog are opinions, not advice. Please read our Disclaimers.

S&P DJI’s Global Islamic Equity Benchmarks Rose 13% in H1 2024, Outperforming Conventional Benchmarks

Contributor Image
Sue Lee

Director and APAC Head of Index Investment Strategy

S&P Dow Jones Indices

Global equities extended their upward trend into Q2 2024 on the back of sustained economic growth and moderating inflation. The S&P Global BMI posted a healthy 10.4% return in the first half of the year, led by the U.S where the S&P 500® had an impressive run with a 15.3% gain and new record highs. Shariah-compliant global benchmarks beat their conventional counterparts, with the S&P Global BMI Shariah and Dow Jones Islamic Market (DJIM) World Index both generating excess returns of 2.6% in H1 2024. Emerging markets started catching up with developed markets in the second quarter, narrowing their YTD return differentials to 3% in conventional benchmarks and 6% in Shariah-compliant benchmarks (see Exhibit 1).

MENA equities diverged from the global trend and remained sluggish. The S&P Pan Arab Composite posted a 1.1% loss in H1, led by Saudi Arabia (-1.5%), UAE (-3.5%) and Qatar (-2.4%). Egyptian equities stabilized after the loan extension by the International Monetary Fund, with the S&P Egypt BMI remaining almost flat in U.S. dollar terms in Q2.

Drivers of Shariah Index Performance in H1 2024

The first six months of 2024 were characterized by the outperformance of large-cap Information Technology and Communication Services companies. Information Technology, which accounts for 36.8% in the S&P Global BMI Shariah versus 24.2% in the S&P Global BMI, contributed 62% of the Shariah index’s return and generated an excess return of 2.9% against the conventional benchmark. On the other hand, Financials brought the heaviest negative effect to the relative performance with an excess return of -1.4%, due to its reduced weightings (2.6% in the S&P Global BMI Shariah versus 15.7% in the S&P Global BMI) as well as the underperformance of Shariah-compliant Financials companies against non-compliant ones (see Exhibit 2).

Global Sukuk Gained Modestly in H1 2024

With adjusted market expectations for the U.S. Fed to reduce interest rates in 2024, U.S. dollar-denominated investment-grade bonds remained under pressure globally, resulting in a 0.5% loss in the iBoxx USD Overall in H1. In comparison, the Dow Jones Sukuk Index, which comprises U.S. dollar-denominated investment-grade sukuk, gained 0.6%, largely due to relatively lower duration. The sukuk benchmark had a yield of 5.3% and a spread of 82 bps over the U.S. Treasury bonds as of the end of June 2024.

This article was first published in IFN Volume 21 Issue 29 dated July 17, 2024.

The posts on this blog are opinions, not advice. Please read our Disclaimers.

Dispersion at All-Time High Relative to Volatility as Earnings Season Arrives

Contributor Image
Michael Orzano

Head of Exchange Products and Digital Assets

S&P Dow Jones Indices

Despite a recent uptick to a more normal level near 16, the Cboe Volatility Index (VIX®) has averaged around just 12.8 over the past 30 trading days as of July 18, indicating relative calm in U.S. equities. Meanwhile, a complementary measure of U.S. equity market risk, the CBOE S&P 500® Dispersion Index (DSPX), has surged to multi-year highs in the mid-thirties—suggesting the market expects unusually large swings in single stock prices during earnings season.

Typically, DSPX is positively correlated to VIX, so when VIX is high and the S&P 500 is experiencing large day-to-day moves, underlying stocks tend to have larger swings and therefore higher dispersion. For example, both VIX and DSPX reached their all-time highs during the height of the COVID-19 selloff in March 2020. Additionally, DSPX tends to rise somewhat during earnings season as traders anticipate greater idiosyncratic performance of companies as earnings reports are released.

That said, a particularly unusual aspect of the current environment is how high implied dispersion is compared to implied volatility. In fact, the spread between DSPX and VIX recently reached an all-time high stretching back to the beginning of the back-tested history of DSPX in 2014 (see Exhibit 1).

A key driver dampening overall U.S. market volatility of late has been historically low correlation. In fact, the correlation between the S&P 500 constituents fell to a rare 0.06 for the month of June, indicating stocks have often been moving in divergent directions. Likewise, the Cboe 3-Month Implied Correlation Index—which measures the market’s expectations for the S&P 500 index constituent correlation based on options prices—reached all-time lows over the past few weeks.

The high-dispersion and low-correlation environment has been visible in several corners of the market even for casual observers. For example, Information Technology stocks have rocketed higher over the past year—with those being viewed as the major beneficiaries of AI, like Nvidia, experiencing the largest gains within the sector. On the other hand, Real Estate, Energy and Materials stocks have significantly lagged the broader market over this period. Interestingly, over the past few trading sessions, we’ve seen a reversal in leadership, with Info Tech stocks sinking while Energy and Real Estate have experienced gains.

Important to note is that the current dynamic is an extension of a trend that has been playing out over the past few years. Exhibit 2 illustrates the transformational shift in risk dynamics of U.S. equities over the past five years. VIX reached its all-time high during the height of the pandemic selloff in March 2020 as macro events overwhelmed underlying fundamental drivers of risk. As we emerged from the pandemic and markets calmed, we started to see more pronounced divergence in sector and stock level performance. That trend has continued to intensify, bringing us to where we are today with idiosyncratic factors overpowering macro risk.

With the U.S. presidential election taking place in less than four months, it will be interesting to see how the risk landscape in U.S. equities may further evolve. However, one thing is true, VIX continues to be the most essential gauge of market volatility, and using a range of equity market risk indicators—such as DSPX—can provide deeper insight into the volatility landscape.

The posts on this blog are opinions, not advice. Please read our Disclaimers.

S&P Dividend Aristocrats and the Search for Income

A company’s dividend track record is often seen as a sign of corporate maturity and balance sheet strength, but not all dividend strategies are created equal. Join S&P DJI’s Anu Ganti, Ben Voros and Elizabeth Bebb for an exploration of what makes the S&P Dividend Aristocrats Index Series unique.

The posts on this blog are opinions, not advice. Please read our Disclaimers.

Of Tariffs Tango and Manufacturing Moves

Contributor Image
Srineel Jalagani

Senior Director, Thematic Indices

S&P Dow Jones Indices

It’s well known that as the U.S. consumer goes, so goes its economy. Various estimates suggest that around 67% of U.S. GDP depends on consumer spending. At the macro level, all this consumer spending translates into the consumption of goods and services. The U.S. economy, like most developed economies, comfortably falls into the category of a service-driven economy. Although manufacturing’s contribution to nominal U.S. GDP is small, the manufacturing segment is a closely tracked macroeconomic metric that forms part of the Leading Economic Indicators (LEI) basket to track the economic cycle.

Manufacturing in Policy Crosshairs

On the global stage, the manufacturing segment has come under increased scrutiny in the current geopolitical climate, as approximately 50% of the world’s population heads to the voting booth. The peak pandemic supply chain disruptions exposed the fault lines around the Just-In-Time manufacturing framework, which was optimized for low cost above all else. There is now a reassessment of these supply chains with increased emphasis on resilience to global disruptions (e.g., the COVID-19 pandemic) and perceived national security threats.

Tariffs have increasingly been used as a policy instrument by governments even before the pandemic, as part of a carrot-and-stick approach to rejuvenate domestic manufacturing. While not all tariffs induce growth in local manufacturing, both the previous and current U.S. administrations have cited increased domestic manufacturing as a major factor in applying tariffs. On the carrot side of this approach, the current administration’s fiscal spending programs also allocate a sizable amount to incentivize local manufacturing. Companies and financial markets have also responded to this evolving trend, with references to “reshoring” and related terms in the earnings calls soaring in the last couple of years.1

Fabrication with a Focus

The S&P U.S Manufacturing Select Index was launched in April 2024 and tracks U.S.-listed companies that have a significant portion of their revenue sourced from U.S. markets, and whose revenue streams fall into one of the 11 industry group categories as defined within FactSet’s Revere Business Industry Classification System (RBICS) Focus framework. The index is weighted using an adjusted float-market-cap approach, optimized for constraints to provide constituent-level and RBICS category-level diversification.

The 11 revenue categories for this index are spread across three main RBICS Focus sectors—Industrial Manufacturing, Consumer Vehicles and Parts, and Electronic Components and Manufacturing. These categories are selected based on their direct relevance to U.S. tariffs and legislations targeting a U.S. manufacturing resurgence. Fractious geopolitics are expected to bring about a new era of increased defense spending, and some of the selected revenue categories also align with U.S. strategic priorities around building a “resilient industrial base.”

FactSet’s Geographic Revenue data categorizes approximately 67% of the index constituents’ revenue being sourced from the U.S. As expected, the latest basket is heavily tilted toward the Industrials sector (approximately 75%), with Machinery, Electrical Equipment, and Aerospace & Defense as the primary industries. The index is balanced across the RBICS industry groups, with the 5 biggest groups accounting for 52% of the index weight.

The index’s five-year performance has been robust, slightly outperforming its starting universe of the S&P United States BMI, as well as the S&P 500 Industrials.

Conclusion

The world’s largest economy is pushing to reimagine its manufacturing sector for greater resilience in an environment of increased supply chain risks, coupled with attention to national security concerns. The S&P U.S. Manufacturing Select Index tracks a subset of companies belonging to a curated list of RBICS revenue focus categories, which we believe are closely aligned with industries at the forefront of these manufacturing shifts—sometimes characterized as “reshoring.” This multifaceted approach leads to index constituents not only from the Industrials sector, but also from Information Technology (Semiconductors segment) and Consumer Discretionary (Consumer Vehicles segment) sectors.

1 Sources: ETFStream, The Wall Street Journal, Yahoo Finance and Bank of America Institute.

The posts on this blog are opinions, not advice. Please read our Disclaimers.