


What are the potential benefits of a passive approach to covered calls? S&P DJI’s Phil Brzenk and ProShares’ Simeon Hyman take a closer look at the S&P 500 Daily Covered Call Index, its performance, and why the index uses a daily approach vs. a more standard weekly or monthly approach.
The posts on this blog are opinions, not advice. Please read our Disclaimers.Indexing Covered Calls: A New Tool for Income Seekers
Balancing Growth and Value in the Mid-Cap and Small-Cap Spaces: The S&P MidCap 400 GARP and S&P SmallCap 600 GARP Indices
A Long-Term Look at S&P 500 Equal Weight Index
Turtle Returns: The Hare and the Tortoise
How Sector Neutrality Influences Risk/Return in S&P Dividend Aristocrats
Indexing Covered Calls: A New Tool for Income Seekers
Balancing Growth and Value in the Mid-Cap and Small-Cap Spaces: The S&P MidCap 400 GARP and S&P SmallCap 600 GARP Indices

Wenli Bill Hao
Director, Factors and Dividends Indices, Product Management and Development
S&P Dow Jones Indices
Launched in February 2019, the S&P 500® GARP Index was the first transparent benchmark tracking growth companies that are identified as being higher quality with lower valuations. Given the success of this index, we launched the S&P MidCap 400® GARP Index and S&P SmallCap 600® GARP Index to expand the available toolkit. Since their launches in 2023, these two indices have outperformed their corresponding benchmarks by a wide margin (see Exhibit 1). For market participants seeking to diversify their mega-cap exposures, the S&P MidCap 400 GARP and S&P SmallCap 600 GARP Indices may provide two alternatives. In this blog, we investigate the index’s design, performance, characteristics and attribution.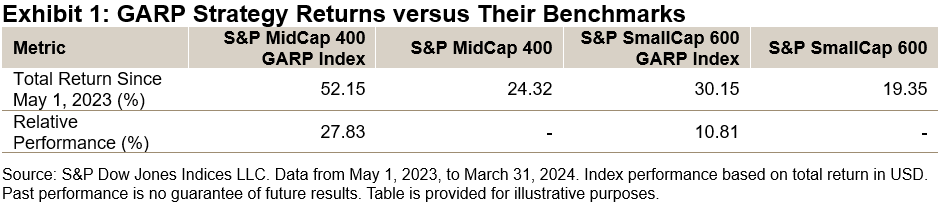 Rationales and Index Design
The S&P GARP Index Series strives to select companies with top earnings and sales growth, strong earnings power, solid financial strength and reasonable valuation. To meet the index objective, the S&P GARP Index Methodology uses a two-layer sequential filtering approach to select its constituents (Exhibit 2).
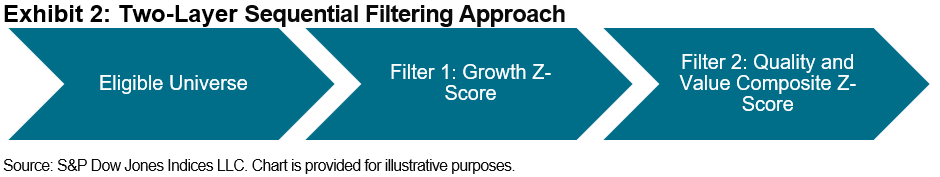
In the first step (filter 1), stocks are ranked by their growth z-scores (three-year earnings per share [EPS] and sales per share [SPS] growth), with the top 30% of the universe stocks remaining eligible for constituent inclusion. In the second step (filter 2), the eligible stocks are ranked by their quality and value (QV) composite z-scores and one-half of the top-ranked stocks are selected.1 The QV score is based on the average of two quality factors (return on equity and financial leverage ratio) and one value factor (earnings-to-price ratio).
The selected constituents are weighted proportional to their growth exposure, subject to the maximum individual weight of 5% and sector weight of 40%. This approach seeks to provide high growth exposure and limit concentration risk.
Performance Comparison
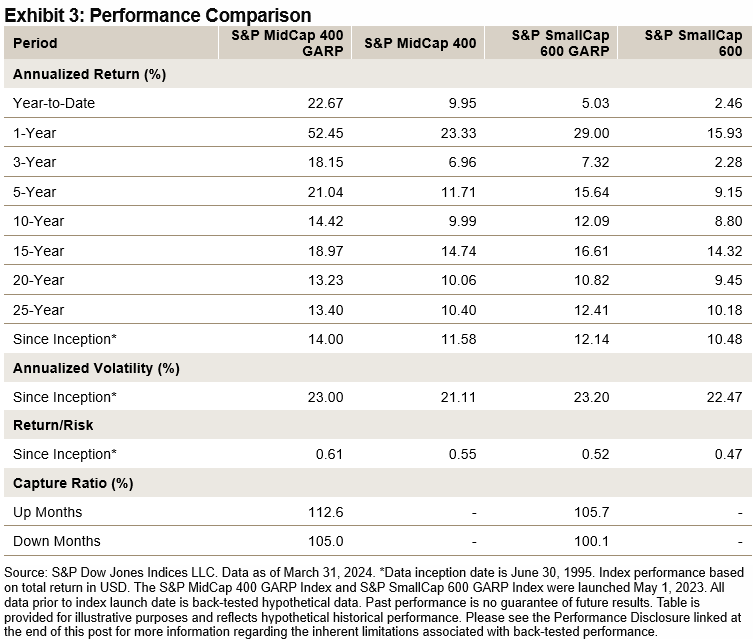
Historically, the S&P GARP strategies have outperformed their corresponding benchmarks over the short and long term with respect to total return and risk-adjusted return (see Exhibit 3). Additionally, they have tended to exhibit growth characteristics, as evidenced by a higher participation ratio in up markets and a similar participation ratio to their benchmarks in down markets.
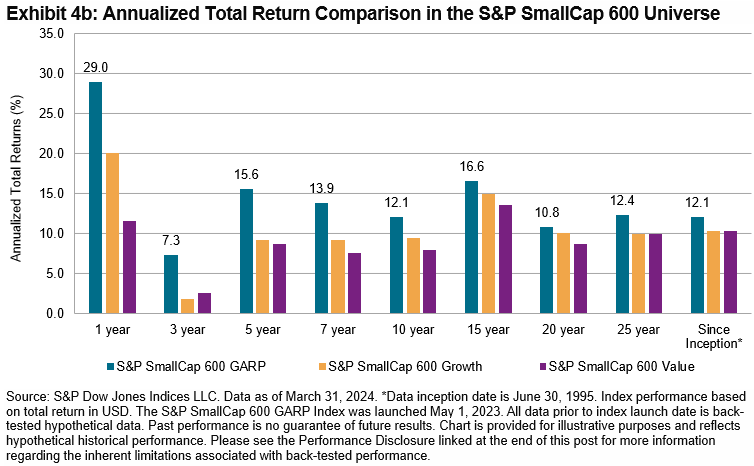
Balancing Growth and Value
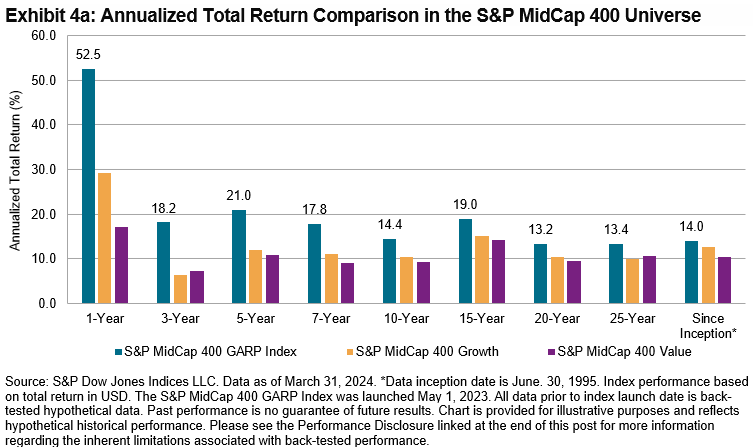
The S&P GARP Indices seek to strike a balance between growth and value. Historically, they have outperformed their corresponding growth and value strategies over the short and long term with respect to total return (see Exhibit 4a and 4b) in both S&P MidCap 400 and S&P SmallCap 600 universes.
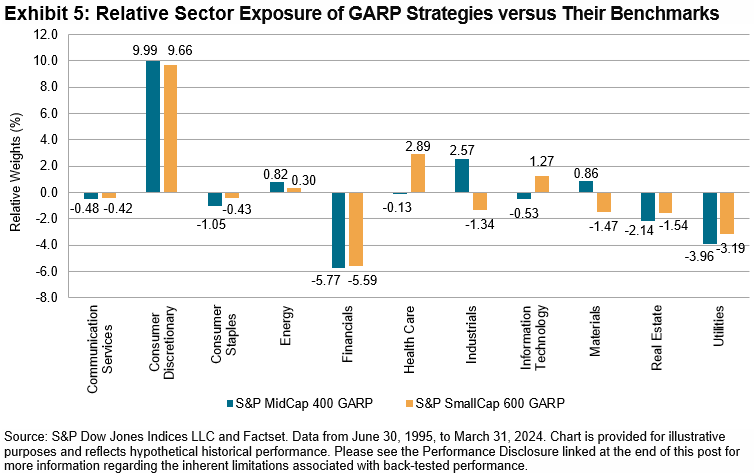
 Sector Exposure
We next explore the relative sector exposures2 of the S&P GARP strategies versus their corresponding underlying universes (S&P MidCap 400 and S&P SmallCap 600). As seen in Exhibit 5, GARP strategies historically have had a significant overweight in Consumer Discretionary (close to +10%) relative to their corresponding benchmarks, with a large underweight in Financials (about -5.5%) and Utilities (about -3.5%).
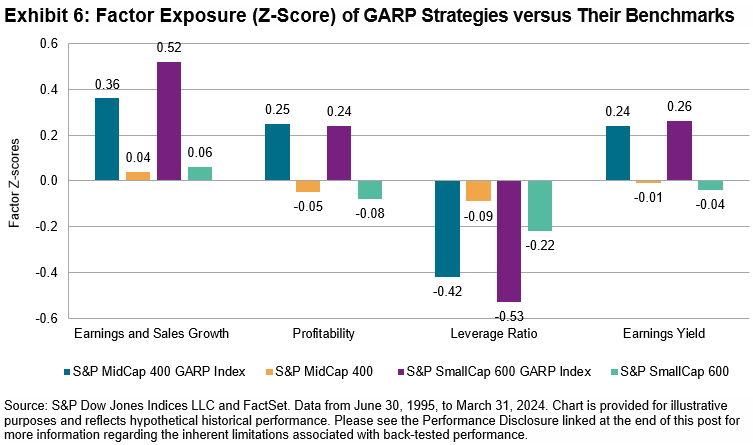
Factor Exposure
Exhibit 6 shows the factor exposure of the S&P GARP strategies versus their corresponding benchmarks in terms of the Axioma US Risk Model Factor Z-scores. In line with their design objectives, the S&P GARP strategies demonstrated strong growth, quality and value tilts versus their corresponding benchmarks. Specifically, the S&P GARP strategies had higher exposures to EPS and sales growth, profitability and value factors, with a lower exposure to leverage ratio than their corresponding benchmarks.
1 Please refer to the methodology for more details. The indices apply a 20% selection buffer according to the following process: 1. Rank the top growth z-score stocks by QV composite z-score. Select automatically the top 80% highest ranking stocks for index inclusion. 2. Select current constituents ranked within the top 120% by QV composite z-score for index inclusion in order of QV composite z-score until the target QV count is reached. 3. If, at this point, there are not enough constituents selected to meet the QV count, select non-constituents based on QV composite z-score ranking until the target count is reached.
2 Relative sector weight = GARP sector weight – corresponding benchmark sector weight
The posts on this blog are opinions, not advice. Please read our Disclaimers.
A Long-Term Look at S&P 500 Equal Weight Index
How have S&P 500 Equal Weight Index’s exposures informed its performance over time? S&P DJI’s Hamish Preston and Invesco’s Nick Kalivas look under the hood at the features influencing S&P 500 EWI’s risk/return and explore what its expanding ecosystem, including sectors and futures could mean for its range of potential applications moving forward.
The posts on this blog are opinions, not advice. Please read our Disclaimers.
Turtle Returns: The Hare and the Tortoise

The tale of a footrace between a determined tortoise and a swift but ultimately complacent hare has been with us for a long time. The earliest known version is two and a half thousand years old; it begins with the hare mocking the tortoise’s slow feet, which leads to a challenge and a contest, and ends in a surprising victory.
We recently published a paper on the rise of passive investing in the fixed income markets and borrowed the title of Aesop’s fable for our purposes. Those who are more audibly inclined can hear an interview on the topic conducted via S&P Global’s “The Essential Podcast”—which I must admit was great fun to participate in.
There are a couple of ways in which a comparison between Aesop’s fable and passive bond investing may be germane. On the one hand, active investing is the more nimble and celebrated approach: beating the index, never settling for “average,” in comparison to the methodical and pedestrian process of passively tracking a market. In this reading, active managers play the role of the hare, index investors the tortoise.
On the other hand, the story of passive investing is more frequently told with regards to the stock market: the first index fund, the first ETF, the greatest proportion of assets—are all assigned to the equity story. The stock markets (and their indices) are also subject to more glamorous and exciting media coverage, most of the time. In terms of passive adoption, it is the bond markets that are the tortoise.
Both interpretations align with a general perception among professional investors that the bond markets are more suited to active management. It seems to be widely believed that active managers have a greater success rate in bonds, and while that may not necessarily be true, it is a fact that passive adoption is less material among bond mutual funds, and tracking bond indices can be much harder than tracking equity indices.
Nonetheless, much like the slow-and-steady tortoise, passive investing is catching up in bonds. This is a trend of significant importance to those working in or using financial services. If the current trajectory continues, the profession of fixed income investment management may be set for a fundamental evolution—echoing that which has occurred in equities over the past 50 years.
Slow and steady doesn’t always win the race, but there is mounting evidence—including in our SPIVA® Scorecards—suggesting that it’s not a bad approach to the markets. To dig into the details, we invite you to take a dive into the paper or listen to the podcast.
The posts on this blog are opinions, not advice. Please read our Disclaimers.How Sector Neutrality Influences Risk/Return in S&P Dividend Aristocrats
- Categories Equities
- Tags diversification, ETFs, high yield dividend growers, indexing, large-cap equities, mid-cap equities, quality dividend growers, Rupert Watts, S&P 1500, S&P 400, S&P 500, S&P 600, S&P Composite 1500, S&P Dividend Aristocrats, S&P Sector-Neutral High Yield Dividend Aristocrats, sector neutrality, sectors, small-cap equities, U.S. equities
What are the potential benefits of a sector neutral approach to S&P Dividend Aristocrats? S&P DJI’s Rupert Watts and State Street Global Advisors’ Colin Ireland explore the construction and range of potential applications for the S&P Sector-Neutral High Yield Dividend Aristocrats.
The posts on this blog are opinions, not advice. Please read our Disclaimers.