


Why is the S&P 500 relevant to markets around the world? Take a closer look at this iconic index with S&P DJI’s Priscilla Luk and Hang Seng Investment Management’s Yvonne Ngai, including its role in our daily lives and some key highlights about why the S&P 500 is widely regarded as the best single gauge of U.S. large-cap equities.
The posts on this blog are opinions, not advice. Please read our Disclaimers.Getting to Know the S&P 500 in Hong Kong
Meet the S&P 500 Dynamic Intraday TCA Index
The S&P 500 Low Volatility Index: Currently Valued at the 99th Percentile of Cheapness Relative to the S&P 500
Diversification, Equity & Indices
Measuring the Global Water Opportunity Set
Getting to Know the S&P 500 in Hong Kong
Meet the S&P 500 Dynamic Intraday TCA Index
Combining a trend-following mechanism with the ability to rebalance up to 13 times during the trading day, this innovative multi-asset index seeks to provide a more stable volatility experience by leveraging the next generation of risk control technology.
The posts on this blog are opinions, not advice. Please read our Disclaimers.The S&P 500 Low Volatility Index: Currently Valued at the 99th Percentile of Cheapness Relative to the S&P 500

Investor enthusiasm for AI and mega-cap technology stocks has propelled the S&P 500® to a gain of more than 30% over the past 12 months. As the S&P 500 has been reaching new highs on a regular basis, it is understandable if low volatility stocks have not been at the top of investors’ minds. This blog will serve as a reminder of just how effective the S&P 500 Low Volatility Index has been at delivering defensive qualities and superior risk-adjusted returns over the long term. Furthermore, we will examine the S&P 500 Low Volatility Index’s historically attractive current relative valuations, solid profitability, enhanced dividend yields and, perhaps unnoticed, significantly higher growth versus the S&P 500 in recent years.
Defensive Qualities and Superior Risk-Adjusted Returns
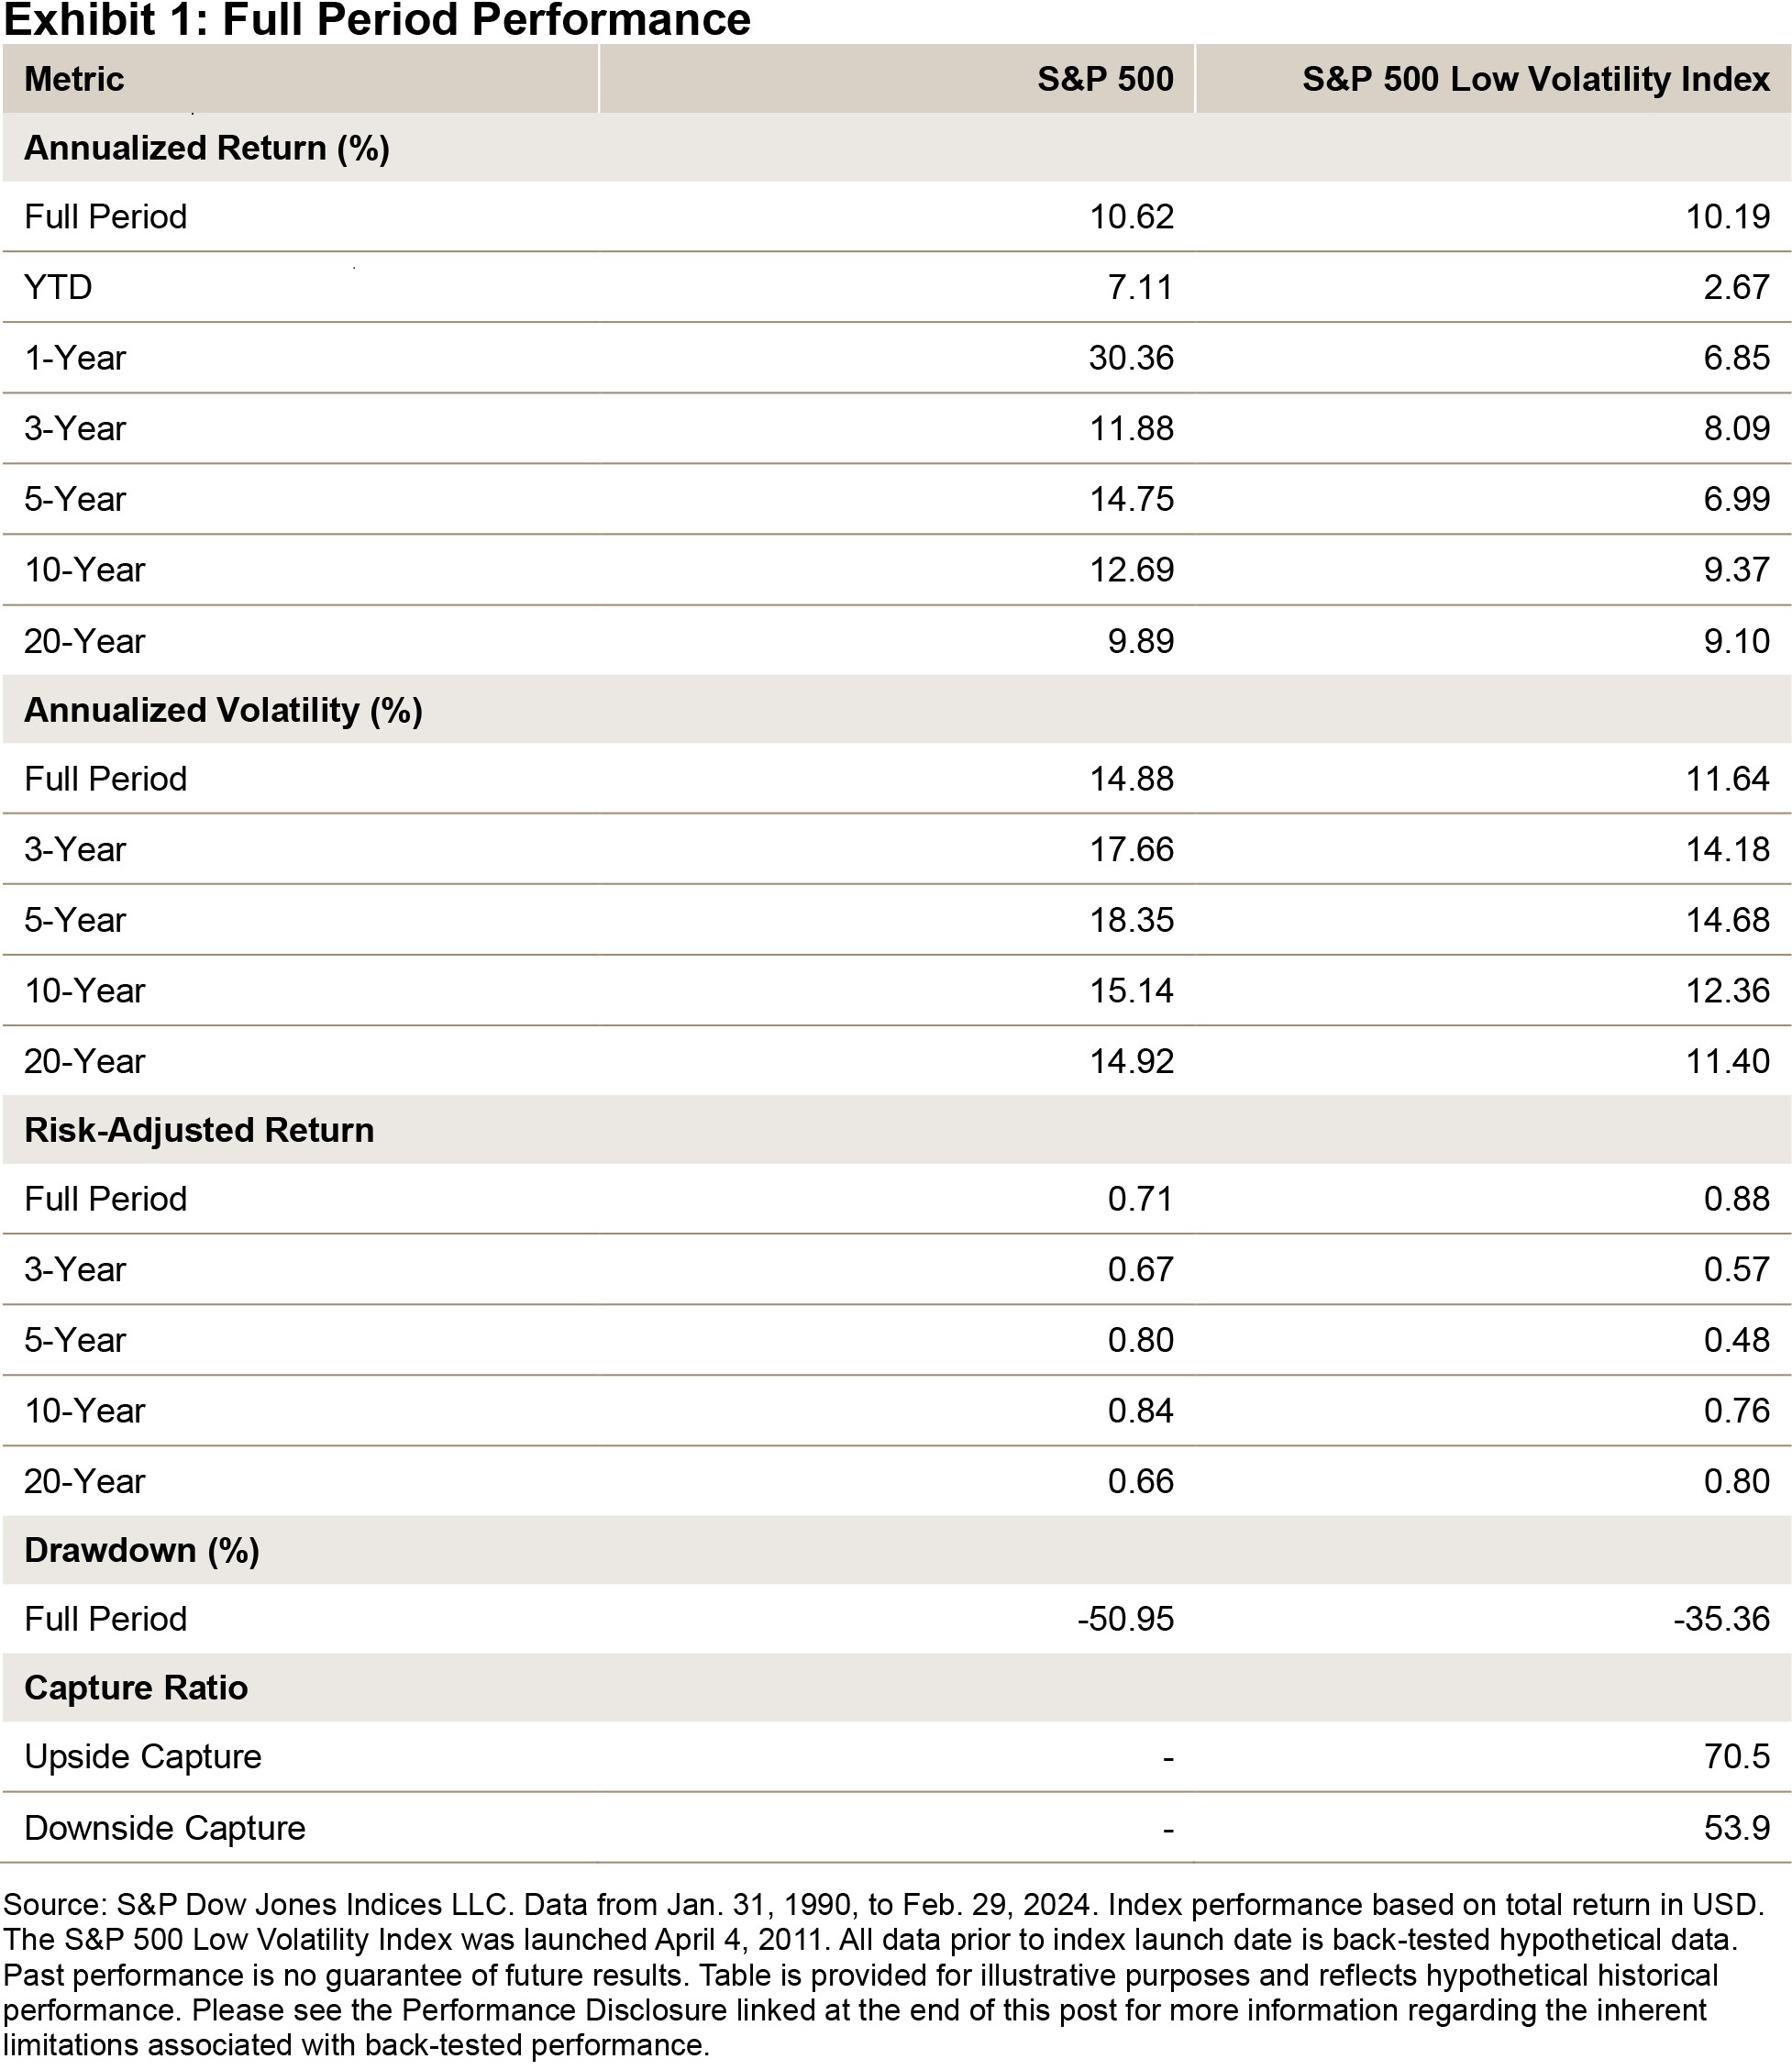
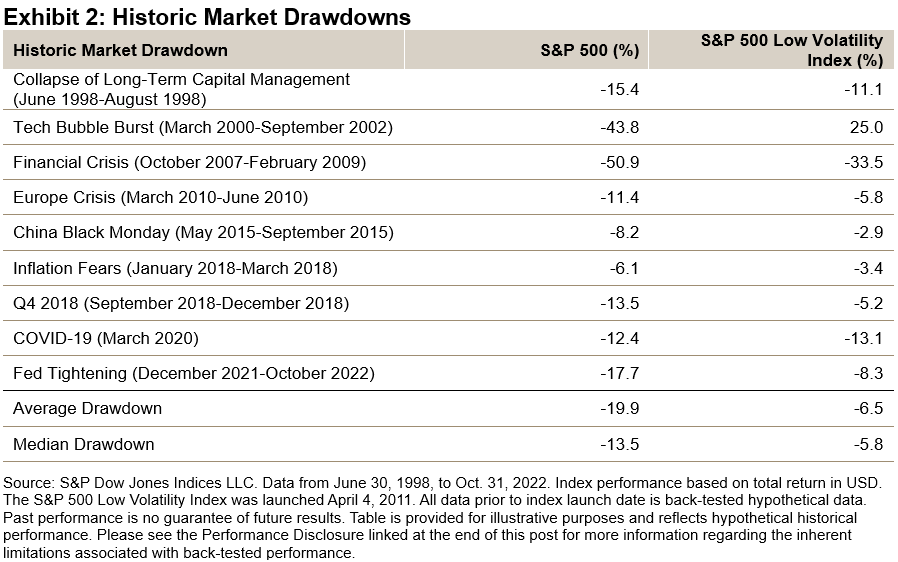
Exhibit 2 displays the consistent downside protection that the S&P 500 Low Volatility Index has provided during historic market drawdowns. It has outperformed in all drawdown periods shown except for the COVID-19 drawdown, when it underperformed by 0.7% over the course of one month. During these periods, the S&P 500 returned an average of -19.9%, versus -6.5% for the S&P 500 Low Volatility Index. Notably, during the tech bubble burst drawdown, the S&P 500 declined 43.8%, versus a gain of 25.0% for the S&P 500 Low Volatility Index, translating to an outperformance of 68.8%.
S&P 500 Low Volatility Is Currently Valued at the 99th Percentile of Cheapness Relative to the S&P 500
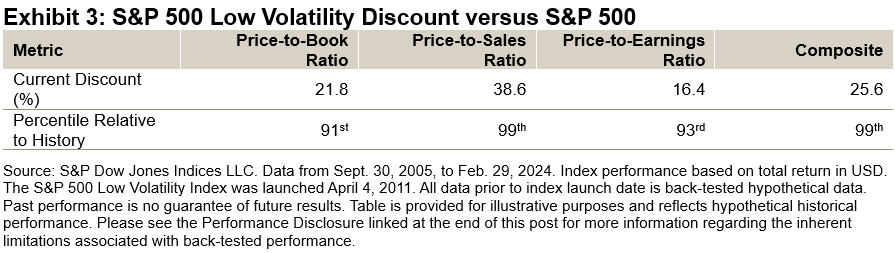
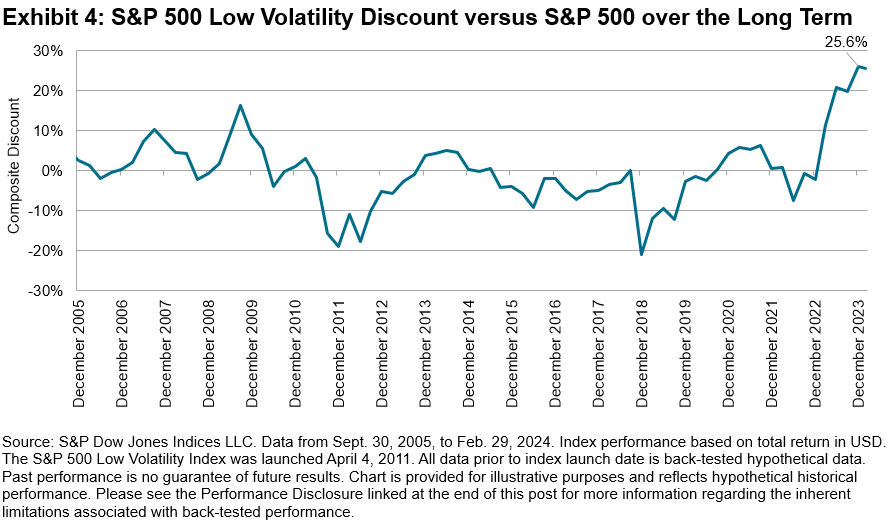
Exhibits 3 and 4 show the historically attractive current valuation discount of the S&P 500 Low Volatility Index relative to the S&P 500. On a price-to-book, price-to-sales and price-to-earnings ratio, as well as on a composite basis (i.e., a simple average of the three metrics), the S&P 500 Low Volatility Index currently trades at a 21.8%, 38.6%, 16.4% and 25.6% discount, respectively. As Exhibits 3 and 4 both indicate, the 25.6% composite discount places the index in the 99th percentile of cheapness relative to the S&P 500 going back to September 2005.
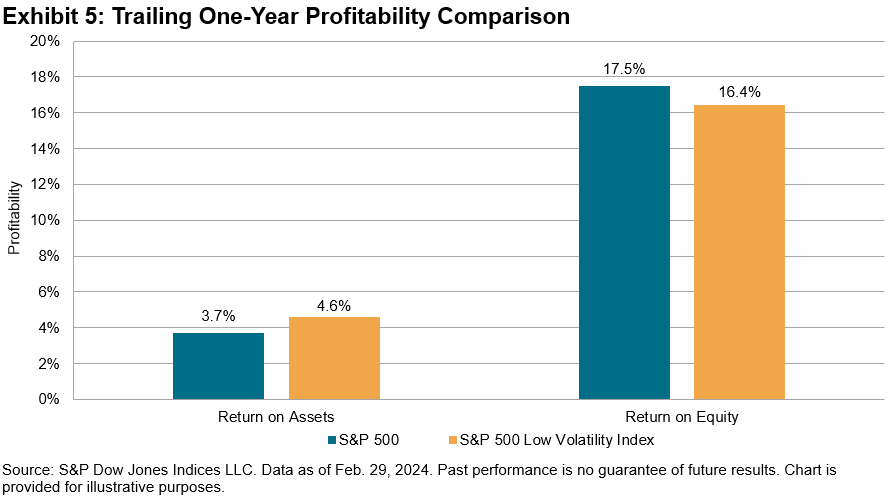
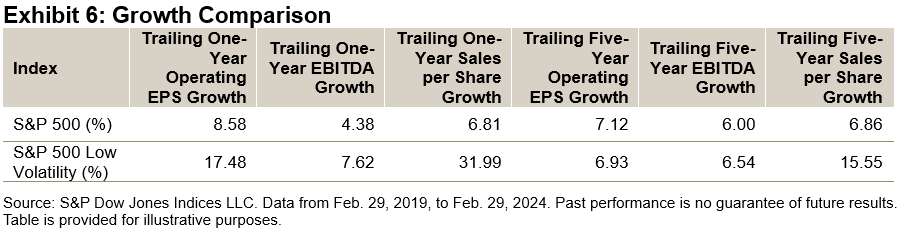
Exhibit 5 compares the return on assets and return on equity of the indices, while Exhibit 6 compares the trailing one- and five-year growth metrics. It is interesting to note that, over the past 12 months, the S&P 500 Low Volatility Index was on par with the S&P 500 from a profitability perspective, in addition to demonstrating materially higher earnings and sales growth over the trailing one- and five-year periods.
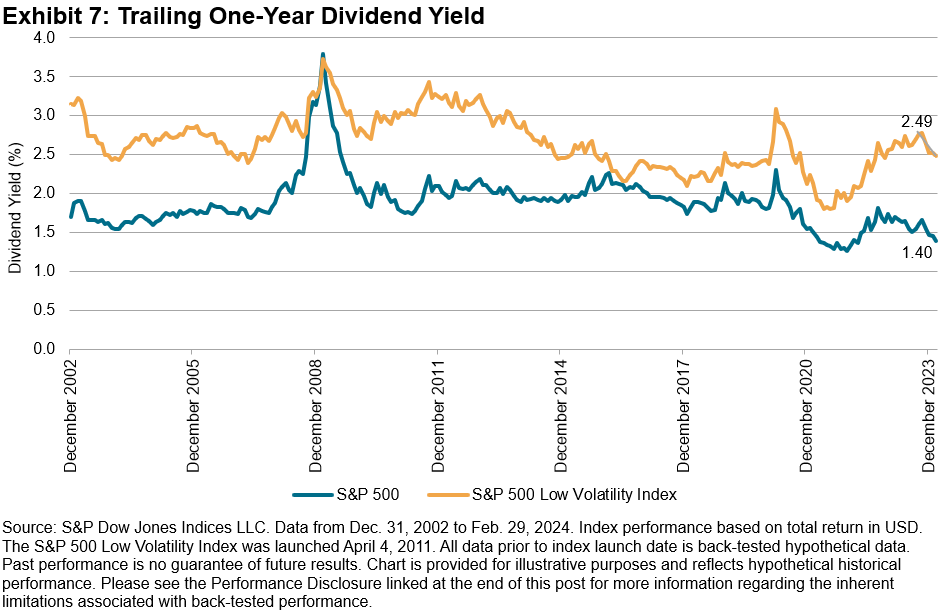
As Exhibit 7 shows, the S&P 500 Low Volatility Index has typically had a superior dividend yield versus the S&P 500 over the long term. Recently however, the dividend yield spread has materially widened to 1.09%, a result of the S&P 500 Low Volatility Index yielding 2.49%, versus the S&P 500 yielding 1.40%. The current dividend yield spread is in the 87th percentile going back to December 2002.
Conclusion
Over the long term, the S&P 500 Low Volatility Index has historically provided investors with superior risk-adjusted returns relative to the S&P 500. Although recent performance has lagged the S&P 500, it has come at a time when the S&P 500 Low Volatility Index has demonstrated similar profitability and significantly higher growth versus the S&P 500. For market participants who are hesitant about lofty valuation multiples but want exposure to solid fundamental performance and enhanced dividend yields, the S&P 500 Low Volatility Index may be an option to consider.
The posts on this blog are opinions, not advice. Please read our Disclaimers.
Diversification, Equity & Indices

The results of S&P DJI’s latest SPIVA U.S. Scorecard are in: Most large-cap active managers underperformed the S&P 500® for the 14th consecutive year in a row. 60% of active large-cap funds underperformed the S&P 500 in 2023, slightly better than the long-term average of 64%, and a relatively benign result considering the dominance of the U.S. equity market’s largest stocks.

The current environment characterized by large-cap dominance can help add a unique perspective that can offer fresh insights into these results. Market concentration concerns in the U.S. have been prevalent, with the weight of the largest five companies in the S&P 500 rising from 19.5% a year ago to 25.2% as of the end of February, reaching levels we haven’t seen since the early 1970s. Parallel to the increase in market concentration, the S&P 500 Equal Weight Index has suffered accordingly, underperforming the S&P 500 by 17% in the 12-month period ending Feb. 29, 2024, its worst 12-month relative performance since its launch more than 20 years ago.
The simultaneous increase in concentration, underperformance of Equal Weight and majority underperformance by active managers is not surprising, as when the largest stocks outperform, the market becomes more concentrated in those names, leading to the outperformance of cap-weighted indices versus their equal-weighted counterparts. Consequently, active managers generally face challenges in keeping pace with the market-cap weights of the largest companies.
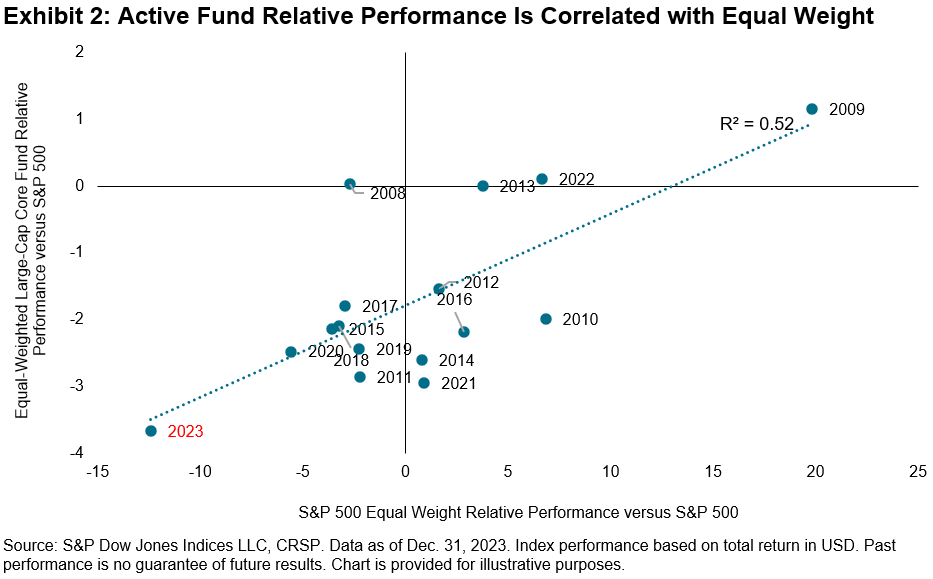
Germane to concentration concerns, the ability to diversify away from capitalization weights via regular rebalancing is often touted as one of the benefits of active management. As a result, we might expect the relative returns of active managers to mirror that of Equal Weight, and that is exactly what we observe in Exhibit 2, which shows a strong linear relationship historically between the equal-weighted average excess return of funds in the U.S. Large-Cap Core category versus Equal Weight’s excess return relative to the S&P 500.
Given their similarities, a natural question one can ask is how have active funds performed when compared to Equal Weight? 2023 was a notable outlier, with 68% of domestic equity funds outperforming Equal Weight, perhaps not coincidentally aided by the index’s severe decline, with similar occurrences in 2007, 2008 and 2020. However, beating Equal Weight as a benchmark has proven to be difficult over the long term. Exhibit 3 shows that a majority of all actively managed domestic U.S. equity funds underperformed the S&P 500 Equal Weight Index in 16 of the last 20 years, with an annual average underperformance rate of 65%.

The data is evident that it has been very challenging historically to consistently outperform the benchmark, regardless of whether it is cap weighted or equal weighted. To dig deeper into how active managers across asset classes and geographies fared, we invite you to explore the results of our SPIVA U.S. Year-End 2023 Scorecard.
The posts on this blog are opinions, not advice. Please read our Disclaimers.Measuring the Global Water Opportunity Set
Look inside the S&P Global Water Index and how it tracks the companies helping the world meet demand for this vital resource.
The posts on this blog are opinions, not advice. Please read our Disclaimers.