Get Indexology® Blog updates via email.

In This List

Parsing Persistence

Why a Bitcoin Index

Reductions in Risk Caused Disparate Returns for Commodities in April

ESG in Australian Strategies: How Does It Look?

Results from the SPIVA India Year-End 2021 Scorecard

Parsing Persistence

Contributor Image
Anu Ganti

U.S. Head of Index Investment Strategy

S&P Dow Jones Indices

Similar to active managers, who attempt to identify stocks with above-average performance, investors who use active funds aim to identify managers who will outperform their peers. Our SPIVA® Scorecards consistently show that most active managers underperform most of the time. But not all funds, and not all the time. How might such outperforming funds be identified in advance?

Notwithstanding the commonly used disclaimer that “past performance is no guarantee of future results,” one obvious place to search is among those funds that outperformed in the past. However, the reliability, if any, of history as a guide to manager selection is critical: examining the persistence of active success helps us disentangle managers with true skill, from those simply visited by good fortune.

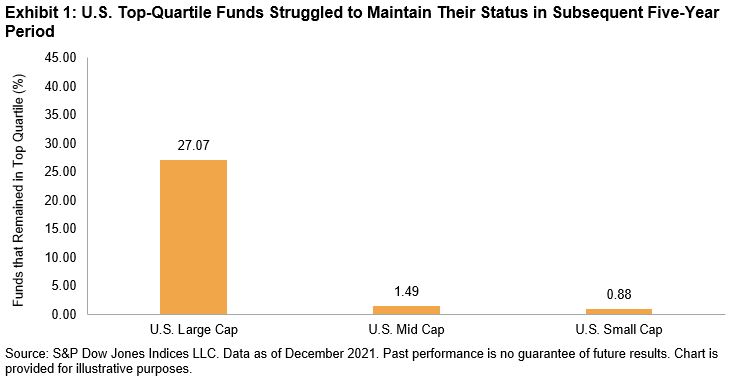
Our Persistence Scorecards measure the degree to which historical relative performance predicts future relative performance. One measure included in the report is the proportion of funds that were top quartile (versus their peers) that remained so over various time periods. Sourced from our U.S. Persistence Scorecard Year-End 2021, Exhibit 1 shows that only 27% of top-quartile U.S. large-cap funds from December 2011-December 2016 remained in the top quartile for the next five years, slightly above the 25% rate we’d see if performance were completely random. Meanwhile, U.S. mid- and small-cap funds performed even worse. A miniscule 1% of top-quartile U.S. mid- and small-cap funds remained in the top quartile during a subsequent five-year period, refuting a common assertion that it is easier to sustain outperformance within the smaller-cap space.

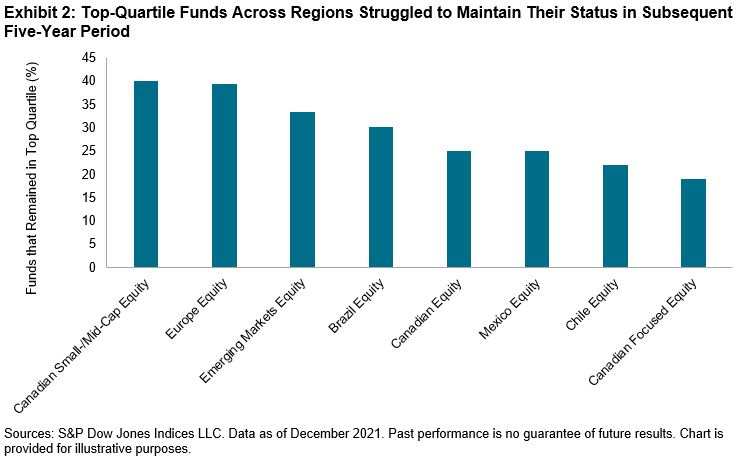
More importantly, these performance persistence problems are not unique to the U.S, with similar results across Canadian, European, Latin American and global emerging markets,1 as illustrated in Exhibit 2.

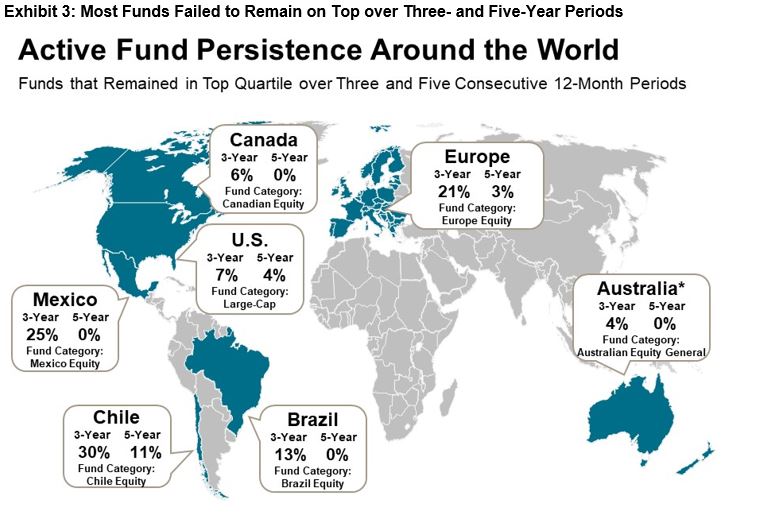
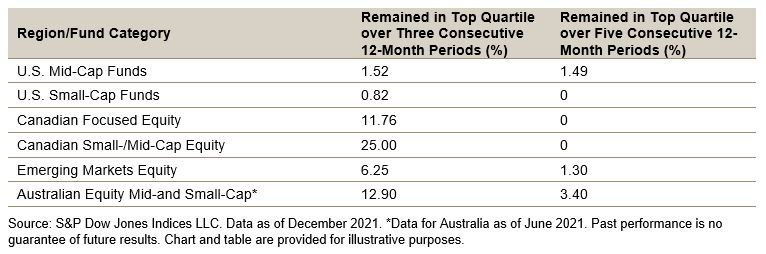
Extending our time horizon, Exhibit 3 shows there is an exponential decrease in persistence over longer time periods. For example, while 25% of Canadian Small-/Mid-Cap Equity funds maintained their top status over three consecutive years, that number dropped drastically to zero over a five-year period. Funds across regions fared no better, with none of the U.S. Small-Cap, Canadian, Brazil or Mexico Equity funds able to stay in the top quartile over five consecutive years, indicating that when outperformance does in fact occur, it tends to be fleeting. 

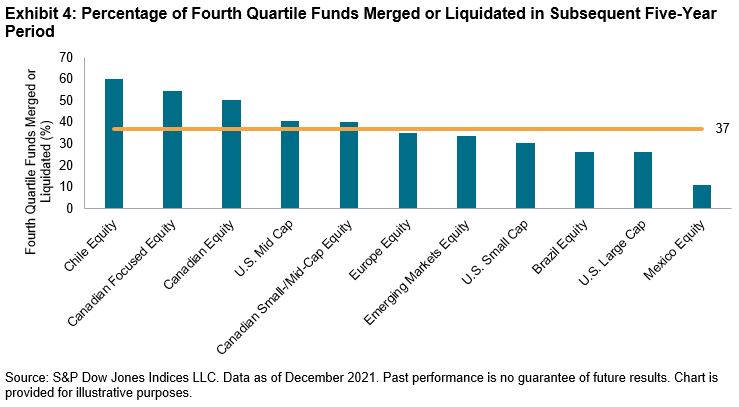
Unsurprisingly, the worst-performing funds across regions are likely to end up merging or liquidating. We see in Exhibit 4 that on average almost 40% of fourth-quartile funds globally disappeared over a subsequent five-year period.

The lack of persistence among active managers globally is not a new phenomenon. These results suggest that short-term success, when it occurs, may arise as much from luck as from genuine stock selection skill.


1 Benchmark is the S&P/IFCI Composite for Euro-denominated Emerging Markets Equity funds.

The posts on this blog are opinions, not advice. Please read our Disclaimers.

Why a Bitcoin Index

Contributor Image
Sharon Liebowitz

Former Head of Innovation

S&P Dow Jones Indices

Since the launch of the S&P Cryptocurrency Indices in 2021, we often get asked about the difference between a price (more formally known as a reference rate) and a single-coin index.

So, let me unpack this into three questions:

  1. What is a reference rate?
  2. What is a single-coin index? And especially, why is it different from a reference rate?
  3. What is the value of an index overall?

 Crypto Reference Prices

Simply put, a reference price for a cryptocurrency is the price for which one can buy that coin (or token) from an exchange. This is often referred to as the crypto price.

Beyond that, cryptocurrency pricing is anything but straightforward.

In fact, in cryptocurrency markets, we believe that one of the biggest challenges is access to robust, transparent pricing.

  • The cryptocurrency market is decentralized, with hundreds of exchanges operating globally 24/7. This means there is no one definitive market price nor the concept of a “consolidated tape,” as exists for equity prices.
  • The quality of exchanges varies widely—in terms of operational aspects, the regulations to which they are subject, their governance practices, and the security and robustness of their platforms.
  • Exchanges vary in terms of the robustness of their trading volume, liquidity and pricing.
  • It is a challenge to obtain a unique indication of price from these exchanges.

S&P DJI’s selection of Lukka, an institutional-quality crypto price aggregator, as our price provider for the cryptocurrencies used in our indices gives us the ability to use standardized cryptocurrency data selected from a set of comprehensive and reliable exchanges in our indices.

Single-Coin Indices

The goal of a single-coin index, unlike a crypto reference price, is to reflect what happens if a single user buys a single coin and what its returns are from that point on. The S&P Bitcoin Index is intended to do this for Bitcoin.

While the concept is quite simple, making sure that the methodology is rules based and the calculation is accurate requires a number of adjustments to ensure the index fully reflects returns on the asset and its value over time. As part of the index methodology, S&P DJI takes Lukka’s price and applies a base value to it. For the S&P Bitcoin Index, the base value is 100 on Jan. 1, 2014. The level of the index is calculated to represent the changes in the reference price from day to day and shows the change in relative value over time.

In addition, the S&P Bitcoin Index, as well as the other S&P Cryptocurrency Indices, adjust for coin supply (akin to shares outstanding) and coin events (akin to a corporate action). Coin events include forks, air drops and staking rewards (see page 12 of the methodology for more details). These features all distinguish a single-coin index from a reference price and make the index value different than a reference price.

Index Benefits and Uses

The benefits of an index are to bring transparency and accessibility to markets. Indices allow market participants to understand the relative growth of an asset class. In the case of crypto, the S&P Cryptocurrency Indices help clarify the relative growth of various cryptocurrencies and the overall cryptocurrency market over time.

Many investors benchmark their investments to indices to determine whether their investments are outperforming or underperforming the markets in which they invest. Other investors want the precision of an index when they benchmark their returns—for example, price return versus total return, time of the index, and type of pricing (fair market value, volume-weighted average price, etc.).

Most importantly, for financial institutions looking to create an index-linked investment product—such as a Bitcoin ETF—an index is a necessity.

Learn more about the S&P Cryptocurrency Indices here.

The posts on this blog are opinions, not advice. Please read our Disclaimers.

Reductions in Risk Caused Disparate Returns for Commodities in April

Contributor Image
Jim Wiederhold

Former Director, Commodities and Real Assets

S&P Dow Jones Indices

Another higher inflation reading helped the S&P GSCI, the broad commodities benchmark, to post an additional 5.1% gain in April. Many market participants realized the U.S. Fed may be behind the curve and have started allocating capital to commodities in 2022. Agriculture and energy continued to outperform last month, while metals and livestock underperformed. Among the major asset classes, commodities’ outperformance YTD is striking (see Exhibit 1).

The S&P GSCI Energy rose another 9.0% in April, with an impressive 59.2% YTD performance. Natural gas and heating oil led the way for the month, rising 26.9% and 24.7%, respectively, as the major crude oil grades continued to consolidate from the March peak in prices. Demand for U.S. natural gas exports rose dramatically this year with the global push to break dependence on Russian supplies. Natural gas production in the U.S. has slowed and the Energy Information Administration increased its price forecasts for 2022 to reflect this supply/demand imbalance.

Consolidation was evident in the metals markets in April. The S&P GSCI Industrial Metals declined 7.6%. Copper and aluminum fell notably, as COVID-19 restrictions in top consumer China and the growing likelihood of aggressive interest rate hikes fueled concern of weaker global growth.

Gold’s appeal waned in April. While gold is perceived as an inflation hedge, higher short-term U.S. interest rates and bond yields tend to increase the opportunity cost of holding a zero-yield asset such as the yellow metal. The S&P GSCI Precious Metals ended the month down 2.1%.

The S&P GSCI Agriculture gained 5.8% over the month, propelled higher by strong performance across the grains and oilseeds complex. The stand-out performer for the month was corn; the S&P GSCI Corn rallied 9.6%. U.S. corn planting in the last week of April was the slowest pace since 2013; the risk of late corn planting is that the crop is likely to pollinate later, and that can often feature hotter, yield-limiting temperatures. U.S. corn predominantly pollinates in July. The S&P GSCI Soybean Oil rose to record levels in April, ending the month up 23.0%. Access to oils for making food and fuel has been thrown into disarray, as war in Ukraine and weather-driven supply woes reduced availability, and the situation was exacerbated in April following Indonesia’s sweeping ban on palm oil exports.

Livestock markets struggled in April under the weight of higher feed costs and the protracted lockdown across China, a key export market particularly for U.S pork. The S&P GSCI Livestock ended the month 6.9% lower.

The posts on this blog are opinions, not advice. Please read our Disclaimers.

ESG in Australian Strategies: How Does It Look?

Contributor Image
Barbara Velado

Senior Analyst, Research & Design, Sustainability Indices

S&P Dow Jones Indices

The world of sustainable investing, better known for incorporating environmental, social and governance (ESG) criteria into what was before mostly financially driven investment decision-making, seems to be here to stay. As ESG index investing continues to evolve, so does our suite of ESG indices—expanding both in terms of methodologies and regions covered. Australia is no exception. In a recent paper, we looked at how a hypothetical ESG index of indices could provide tangible ESG benefits while not deviating much from a hypothetical baseline index of indices. Let’s see how.

How Were the Baseline and ESG Indices of Indices Constructed?

We can think about these as a collection of indices, with the baseline comprised of traditional market-cap-weighted indices and the ESG one made up of their respective ESG counterparts. Weights were assigned based on the latest Australian asset allocation data.1 The underlying ESG indices include a broad-based Australian ESG index, international carbon control indices, a global ESG real estate index and a global net zero 2050 infrastructure index. Each of these ESG index series were created to serve different investment and ESG objectives.

A Closer Look at the Underlying Indices

Exhibit 2 highlights how all of the ESG index variants have historically closely tracked their benchmark indices2 (annual tracking error ranging from 1.0% to 2.6%), while Exhibit 3 reflects the relationship between ESG gains and level of tracking error.

Most ESG indices displayed both S&P DJI ESG Score improvement and carbon intensity reductions at the index level (see Exhibit 3). The S&P Carbon Control Indices led for carbon intensity reduction, followed by the Dow Jones Brookfield Global Infrastructure Net Zero 2050 Climate Transition ESG Index. This is in line with both the indices’ objectives—to minimize carbon intensity and be compatible with a 1.5°C scenario, respectively. As for S&P DJI ESG Score improvement,3 the winners were the S&P ASX 200 ESG Index and Dow Jones Global Select ESG RESI, which were designed to raise index sustainability performance measured by the S&P DJI ESG Scores and the GRESB Scores, respectively.

Combining Underlying Indices into Baseline and ESG Indices of Indices

The ESG index of indices shows reductions in carbon intensity and fossil fuel reserve emissions close to 50%, as well as enhancements in the S&P DJI ESG Score and its dimensional environmental, social and governance scores, relative to the baseline index of indices (see Exhibit 4). All these ESG gains were attained for a low level of tracking error (0.81% annualized; see Exhibit 5).

We highlighted how a collection of ESG-focused indices could reflect substantial ESG improvements, from lower carbon intensity and minimized fossil fuel reserve emissions to improved S&P DJI ESG Scores, as well as dimensional E, S and G score enhancements, while closely tracking the baseline collection of indices. The variety of underlying sustainable indices used reflects the diverse nature of investment and ESG needs. Combined into a holistic strategy, ESG indices could present an effective, sustainable alternative to traditional cap-weighted benchmarks, helping drive sustainable strategies forward.


1 Based on back-tested data for the period analyzed.

2 Sourced from the Australian Prudential Regulation Authority (APRA). Available here.

3 S&P DJI ESG Score improvement is calculated as the difference between index-level ESG score of the ESG index and its benchmark.

The posts on this blog are opinions, not advice. Please read our Disclaimers.

Results from the SPIVA India Year-End 2021 Scorecard

Contributor Image
Benedek Vörös

Director, Index Investment Strategy

S&P Dow Jones Indices

The S&P Indices Versus Active (SPIVA®) Scorecard,1 published semiannually, measures the performance of actively managed funds against their corresponding benchmarks. The latest SPIVA India report provides a number of interesting insights about the performance of active versus passive across active fund categories.

1. Long-Term Outperformance of Active Funds Was Difficult

Indian bond funds had a tough time throughout the past decade, with most active bond managers underperforming their respective benchmarks over 1-, 3-, 5- and 10-year time horizons. Equity funds fared slightly better, with almost three-quarters of Indian ELSS active managers outperforming their benchmark in the past year and just over half of Indian Equity Mid-/Small-Cap managers outperforming over a three-year time horizon. Over a holding period of 5 or 10 years, however, most actively managed equity and bond funds underperformed, while a full 100% of Indian Composite Bond funds underperformed the S&P BSE India Government Bond Index over the past 10 years.

2. Government Bond Funds Have Struggled to Survive, While ELSS Funds Have Proven Long(er)-Lasting

The survivorship rates of Indian funds deteriorated over time across all categories, but the rate at which funds went extinct varied greatly across categories. While Indian ELSS funds have proven resilient, with over four-fifths surviving after 10 years, Indian Government Bond funds had the lowest survival rate, with 60% closing up after a decade.

3. There Was a Wide Dispersion in Active Fund Performance, Especially in the Mid-/Small-Cap Category

As we previously highlighted, Indian Mid-/Small-Cap managers fared better in the long run than active fund managers in other categories. While one may argue that long-term “alpha” exists in the mid-/small-cap space, identifying outperforming managers in advance can be difficult. The difference between a “good” and a “bad” choice is material. Highlighting the significant fund selection risk that investors face in this category, the interquartile range (which is the spread between the first and third quartile breakpoints of active funds in a given category) was a substantial 19% for Indian Mid-/Small-Cap funds in 2021, and over 4% annualized over the past decade.

1 SPIVA Scorecards: An Overview. https://www.spglobal.com/spdji/en/education/article/spiva-scorecards-an-overview

The posts on this blog are opinions, not advice. Please read our Disclaimers.