Get Indexology® Blog updates via email.

In This List

Latin American Equities Close 2021 in the Red for a Second Consecutive Year, Driven by Weakness in Brazil

Increasing Diversification of the Australian Equity Market

Global Islamic Indices Advanced 20% YTD, Outperforming Conventional Benchmarks in 2021

A Stellar 2021 for Indian Equities

No Safe Harbor for Stockpickers

Latin American Equities Close 2021 in the Red for a Second Consecutive Year, Driven by Weakness in Brazil

Contributor Image
Silvia Kitchener

Director, Global Equity Indices, Latin America

S&P Dow Jones Indices

2021 started on a hopeful note, with COVID-19 vaccines coming to save the world. However, as in many other parts of the world, Latin American countries struggled to control the pandemic’s impact on their economies and societies. Additionally, political uncertainty and civil unrest in several countries contributed to a disappointing year.

While most global markets experienced strong performance in 2021, the S&P Latin America BMI finished the year down 12%, with negative returns in three out of four quarters. It is interesting to note, however, that Latin America excluding Brazil had a different outcome, as the S&P MILA Pacific Alliance Composite gained 6.7% for the year (see Exhibit 1).

While headline indices from Argentina, Chile, Colombia, and Peru all closed 2021 in positive territory in local currencies, Mexico was the standout performer among Latin American countries as the S&P/BMV IRT gained 24.4% YTD (see Exhibit 2). The story was different in U.S. dollar terms, as all markets except for Argentina and Mexico ended in the red due to local currency depreciation against the U.S. dollar.

Brazil was the worst performer in 2021 in both Brazilian reals and U.S. dollars. Most Brazilian sectors underperformed; Financials, represented by the S&P Brazil BMI Financials Index (-24.3%), had significant losses and the greatest impact on the entire market. Mexico, on the other hand, had the largest annual gain since 2009, as shown by the S&P/BMV IRT. Most of this was driven by the double-digit gains of some of the largest Mexican companies like America Movil, Cemex, and Walmart de Mexico.

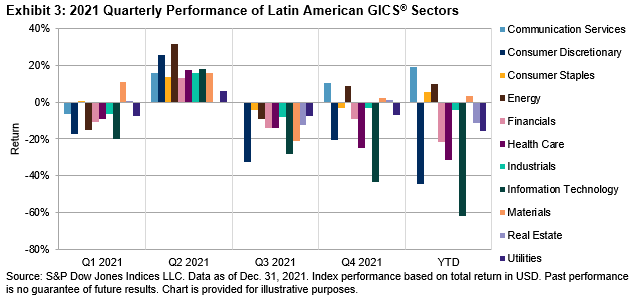
In terms of regional sectors, nearly all of them struggled to stay afloat (see Exhibit 3). In the end, for 2021, Communication Services (19.2% YTD), Consumer Staples (5.7% YTD), Energy (10.0% YTD), and Materials (3.1% YTD) were the only ones that accomplished that goal. The pandemic drove most people indoors to work, play, and shop. In Communication Services, companies like America Movil, Grupo Televisa, and Telefonica Brasil greatly benefited from increased subscribers to their online and pay TV services. Energy was driven up by solid annual price performances from Petrobras and Ecopetrol, which represented nearly 77% of the Energy sector. Consumer Staples, typically a reliable defensive sector, did not disappoint. Finally, Materials companies, which include producers of building materials, benefited from high demand for their products. Likewise, mining companies, particularly copper exporters, gained from historically high prices for their exports in 2021.1 On the downside, Financials, the largest sector in the region, was down 21.6% for the year. Brazilian financial institutions, representing 64% of the sector, had the most losses for the year, greatly contributing to the region’s disappointing returns.

As the COVID-19 pandemic continues to evolve, uncertainty envelops the region at the start of 2022. High inflation, weakness in local labor markets, expectations for rising interest rates, and political instability in several Latin American countries continue to weigh on equity market sentiment. All this points to what could be a significant shift in economic and governmental policies in 2022. For better or for worse, it promises to be another fascinating year.


For more information on how Latin American benchmarks performed in Q4 2021, read our latest Latin America Scorecard.

1 Source: S&P Global Ratings and CapitalIQ. Copper (Comex HG).

The posts on this blog are opinions, not advice. Please read our Disclaimers.

Increasing Diversification of the Australian Equity Market

Contributor Image
Eduardo Olazabal

Associate Director, Global Exchange Indices

S&P Dow Jones Indices

Equity markets have changed considerably over the past 10 years, reflecting the growth of stocks and sectors in each market. While this growth has led to increased concentration in most of the world’s largest equity markets, Australia is a notable exception, as diversification has improved both in terms of stock concentration and along sector lines.

We can analyze stock concentration at a high level by using the Herfindahl-Hirschman Index (HHI). This index is a widely used measure of market concentration that can also be applied to stock market indices. It is calculated by squaring the market share (weight) of each stock in an index and then summing the resulting numbers. A greater HHI indicates a higher level of market concentration, while a lower value indicates less concentration.

Exhibit 1 shows that market concentration declined significantly for the S&P/ASX 200 over the past decade, while it increased in benchmarks measuring four of the world’s five largest equity markets. The S&P 500 and Canada’s S&P/TSX Composite experienced the largest increases, while the U.K. was the only top five market to see a decrease.

Examining the S&P/ASX 200 and S&P 500, we can see how the sector dynamic played out during this period. The weight of Materials and Financials declined for both indices, while Information Technology increased. However, the Information Technology sector had barely any participation in the S&P/ASX 200 10 years ago, which perhaps makes this change even more significant in Australia, given the small initial base.

In Exhibit 3, we can see how much each sector’s weight has changed over the past 10 years. While some sectors declined across all markets, such as Energy and Materials, others like Information Technology have increased—this was most notable in the U.S., with its share in the S&P 500 going up by 13%.

For the S&P/ASX 200, Materials and Financials each declined 6%, while Health Care and Information Technology increased by 7% and 4%, respectively. This is quite notable, as the sectors that have traditionally dominated the index (Financials, Materials, and Energy) accounted for 67% of the index 10 years ago, and now with the growth of Health Care, Real Estate, and Information Technology, this has lowered to 53%.

In conclusion, changes in the level of diversification varied across markets over the past decade. While the S&P/ASX 200 has become more diversified as a result of growth within newly emerging companies and sectors, growth in other markets was centered on previously large companies and sectors, which led to more concentration in the market overall.

The posts on this blog are opinions, not advice. Please read our Disclaimers.

Global Islamic Indices Advanced 20% YTD, Outperforming Conventional Benchmarks in 2021

Contributor Image
John Welling

Director, Global Equity Indices

S&P Dow Jones Indices

Global equities gained in the last quarter of the year, climbing 5.8% as measured by the S&P Global BMI. Shariah-compliant benchmarks, including the S&P Global BMI Shariah and Dow Jones Islamic Market (DJIM) World Index, outperformed their conventional counterparts by approximately 2.5% in the quarter due largely to their overweight in the U.S. Information Technology sector, which gained nearly 14% during Q4. Global Islamic indices finished the year with a near 2% advantage, while the performance differential varied across regions, as Asia Pacific developed and emerging markets underperformed their conventional benchmarks.

Drivers of 2021 Shariah Index Performance

While global equities enjoyed broad gains throughout 2021, the greatest contributors of Shariah index performance were at the sector and country level (see Exhibits 2 and 3).

Energy—which enjoyed a substantial rebound in 2021 after poor performance in 2020—was the best-performing sector. Due to its low weight in indices, however, performance impact was muted. Meanwhile, Information Technology—which tends to hold an overweight position in global Islamic indices—gained nearly 30%, contributing one-half of annual gains.

On a regional basis, high average weight toward the U.S. favored the S&P Global BMI Shariah during 2021, as the country enjoyed the best regional performance. The underperformance of the Asia Pacific developed and emerging markets regions limited overall gains, as Shariah-compliant stocks in Japan, South Korea, and China suffered during the period.

MENA Equities Continued to Gain in 2021

MENA regional equities gained considerably in 2021, as the S&P Pan Arab Composite advanced 32.7%. All MENA country indices finished the year in positive territory, led by the S&P United Arab Emirates BMI, which gained an impressive 50.8%, followed by the S&P Saudi Arabia BMI, up 34.8%. The S&P Egypt BMI led performance during Q4, rallying 16.3% and sending the country index into positive territory at year end.


For more information on how Shariah-compliant benchmarks performed in Q4 2021, read our latest Shariah Scorecard.

This article was first published in IFN Volume 19 Issue 02 dated the 12th January 2022.

The posts on this blog are opinions, not advice. Please read our Disclaimers.

A Stellar 2021 for Indian Equities

Contributor Image
Benedek Vörös

Director, Index Investment Strategy

S&P Dow Jones Indices

Indian equities had a stellar 2021—the S&P BSE SENSEX rose over 23%, outpacing most major emerging markets, though slightly lagging the S&P 500®, which gained 29%. Information Technology and Financials were the top contributors, adding 9% and 6%, respectively, to the performance of the Indian bellwether. Smaller Indian companies did even better than blue chips; the S&P BSE SmallCap returned over twice as much as the S&P BSE SENSEX, with a thumping 64% total return, while mid caps also provided a bright spot, rising 41% in 2021.

After exhibiting outsized moves in 2020, equities settled back into a more benign volatility regime; the annualized volatility of daily S&P BSE SENSEX returns dropped by more than half, to below 16% in 2021, and the S&P BSE MidCap and S&P BSE SmallCap volatility also subsided, dropping to 18% and 17%, respectively, from over 28% in 2020.

All S&P BSE sectors and industries were up for the year, with Power leading the way, soaring by 74%.

Despite the well-publicized setback for the Paytm IPO, the S&P BSE IPO surged 56% in 2021, the second-best-performing Indian equity strategy we regularly report on, lagging just 1% behind 2021’s winner, the S&P BSE Enhanced Value Index.

Majority state-owned firms have also had an outstanding year following a dismal 2019 and 2020, as the S&P BSE PSU and the S&P BSE CPSE climbed 48% and 43%, respectively.

Unlike equities, fixed income performance was much more muted. The S&P BSE India 10 Year Sovereign Bond Index edged up 2%, while the S&P India Sovereign Inflation-Linked Bond Index was essentially flat, as demand for inflation protection waned in parallel with a deceleration of inflation pressures in the Indian economy.

Consistent with global trends, indices incorporating environmental, social, and governance (ESG) factors are increasingly gaining in popularity with Indian investors. Their interest might have been raised further by the recent strong run of the S&P BSE 100 ESG Index, which outperformed its parent index for the third year running, returning 29% in 2021 against 27% for the S&P BSE 100.

One group that is having difficulty outperforming the S&P BSE 100 is that of active managers. According to our S&P Index Versus Active (SPIVA) India Mid-Year 2021 Scorecard, over 86% of active Indian equity large-cap managers were beaten by the S&P BSE 100 over the previous 12-month period, and the numbers don’t look much different on a three-  or five-year horizon either, with underperformance rates of 87% and 83%, respectively. Offering an indication of the breadth of opportunity available to “stock pickers,” annualized dispersion (a measure of the spread of stock returns) in the S&P BSE SENSEX declined to a monthly average of 20% this year, having averaged 21% over the 2010-2019 period. Among other consequences, declining dispersion lowers the magnitude of rewards for active managers seeking to beat their benchmarks by over- or underweighting individual names.

The posts on this blog are opinions, not advice. Please read our Disclaimers.

No Safe Harbor for Stockpickers

Contributor Image
Anu Ganti

U.S. Head of Index Investment Strategy

S&P Dow Jones Indices

We can use volatility and its components dispersion and correlation to analyze stock selection conditions globally. Most active managers run less diversified, more volatile portfolios than their index counterparts. Active managers should prefer above-average dispersion because stock selection skill is worth more when dispersion is high. The role of correlation is more subtle. While counterintuitive, the benefit of diversification is less when correlations are high. Therefore, they should prefer above-average correlations because it will reduce the opportunity cost of a concentrated portfolio. We observe in the U.S. that while 12-month average dispersion declined slightly, we saw a dramatic decline in correlations in 2021 compared to 2020.

Two years ago, we conceptualized the cost of concentration, defined as the ratio of the average volatility of the component assets to the volatility of a portfolio. A higher cost of concentration implies a larger foregone diversification benefit, translating into a higher hurdle for active managers to overcome.

How much higher do returns have to be to justify the additional volatility active managers take on? By multiplying the cost of concentration by a rate of return consistent with the market’s historical performance (e.g., 10% for the S&P 500), we arrive at the required incremental return shown in Exhibit 2 for the S&P 500. Driven by the lower correlations seen in Exhibit 1, this measure almost doubled last year, indicating that active managers gave up a larger diversification benefit in 2021 than in 2020.

Finally, to understand how difficult it is to earn this incremental return, we divide the required incremental return by dispersion to translate the measure into dispersion units. We can interpret a higher number of dispersion units to mean more challenging conditions for active management.

The bars in Exhibit 3 indicate the average value of the required incremental return in dispersion units for several indices across regions. As dispersion and correlations were generally lower, we observe a relatively more difficult environment for active management across most markets.

The challenging environment for stock selection is not unique to the U.S. 2021 stands in stark contrast to 2020, when both dispersion and correlations rose globally. Despite those relatively favorable conditions for stock selection, most active managers still underperformed, proving that true stock selection skill is rare. When SPIVA® results for 2021 become available, it would not be surprising if we saw dreary global active management performance once again.

The posts on this blog are opinions, not advice. Please read our Disclaimers.