Get Indexology® Blog updates via email.

In This List

The Senate’s Approval of the Infrastructure Bill and Its Effect on Cryptocurrency

Introducing the S&P Multi-Asset Dynamic Inflation Strategy Index – Part 2

Introducing the S&P Multi-Asset Dynamic Inflation Strategy Index – Part 1

A Diverse Approach to Sectors: Examining the S&P BSE SENSEX 50

Industrial Commodities Push the S&P GSCI Lower in August

The Senate’s Approval of the Infrastructure Bill and Its Effect on Cryptocurrency

Contributor Image
Olya Veramchuk

Director of Tax Solutions

Lukka

On Aug. 10, 2021, the US Senate approved the much-debated Infrastructure Bill, a cornerstone of President Joe Biden’s agenda. The bill overall is worth over $1 trillion. Yet the impact on the digital asset community, while small from a dollar perspective, may be equally outsized. It is estimated that the bill will increase tax revenue collected from digital asset investors by $28 billion, not by raising tax rates or creating new taxes but rather by applying new information reporting requirements on participants in the digital asset industry.

Generally, under Section 6045 rules, those falling under the definition of a “broker” are required to issue a Form 1099 to report gross proceeds on a transaction-by-transaction basis together with their customers’ names, social security numbers, and other relevant information. The bill expands the definition of a broker to include “any person… effectuating transfers of digital assets, including any decentralized exchange (DEX) or peer-to-peer marketplace.”

This development could have a significant impact on many participants in the digital asset ecosystem, particularly within decentralized finance (DeFi), and would likely put a strain on the entire sector.

Complying with Section 6045 information reporting requirements may not prove possible for many DeFi participants as they have no visibility to the parties sending or receiving digital assets. The approved bill’s language has an extensive net, potentially covering miners, services that stake digital assets, node operators, validators, smart contracts, open source developers, hardware and software wallet manufacturers, DAO token holders, and others. This also touches individual investors who are either:

    • Buying or selling crypto from other individuals
    • Trading crypto for crypto through a crypto exchange (or equivalent) as crypto/crypto trades are simply two transfers occurring at the same time that a broker or dealer facilitates, most often through the use of technology, or through a DEX, where there may not be an institution or any entity at all and only technology facilitating an exchange between individuals

This would effectively require affected individuals to report at the level of institutions. Transactional reporting is easily done by traditional financial institutions, where it is clear who the broker is (for example, an entity like fund manager) and who the customers are (for example, investors in fund manager’s funds).

The issue was recognized by a number of Senators, including Senators Wyden, Toomey, and Lummis, who advocated revising the language to clearly exclude miners, hardware and software wallets providers, and limit the reporting obligations to the parties who can actually report (for example, crypto exchanges).

However, the narrowed scope was determined to reduce the projected revenue by approximately $5.17 billion. Despite Senator Portman tweeting that an agreement was reached on “an amendment to clarify IRS reporting rules for crypto transactions without curbing innovation or imposing information reporting requirements on stakers, miners, or other non-brokers,” the language remained in the originally proposed form.

If the bill becomes law without narrowing down the definition of a broker it may result in overly broad application of the information reporting rules by the IRS, in turn resulting in the outflow of talent and innovation overseas as venues owned and administered by foreign persons are out of reach of US reporting rules. This could materially limit the economic benefits of the digital asset industry in the United States compared to the global economy. Since most cryptocurrencies themselves are borderless, this may not impact cryptocurrency indices overall, but rather it could affect which projects grow in the US versus ex-US.

Because the Treasury and the IRS are yet to issue any formal guidance on the taxation of digital assets, it is not unreasonable to expect at least 18-24 months of preparation time before the new rules come into effect. Currently, the law is expected to be implemented in 2023.

Tracking the performance of a selection of cryptocurrencies, including Bitcoin and Ethereum, the S&P Cryptocurrency Indices are designed to bring transparency to this evolving, unique asset class. You can learn more about S&P DJI’s digital asset solutions here.


Disclaimer:

The views and opinions of any third-party author are his/her own and may not necessarily represent the views or opinions of S&P Dow Jones Indices or any of its affiliates.

The posts on this blog are opinions, not advice. Please read our Disclaimers.

Introducing the S&P Multi-Asset Dynamic Inflation Strategy Index – Part 2

Contributor Image
Lalit Ponnala

Director, Global Research & Design

S&P Dow Jones Indices

In a previous blog, we highlighted the objective of the S&P Multi-Asset Dynamic Inflation Strategy Index and summarized its methodology. We justified our strategy choice for each inflation regime (high, medium, low) and illustrated how the index dynamically switches between these strategies based on a monthly inflation forecast. In this blog, we will take a closer look at the performance of the index in comparison to its underlying strategies and demonstrate some possible advantages of the dynamic switching approach.

During a recent three-year period ending July 2021 (see Exhibit 1), we see that the S&P Multi-Asset Dynamic Inflation Strategy Index (SPMADIST) outperformed its component strategies as well as some of the popular “inflation hedge” asset classes, such as broad commodities (GSCI), real estate (REIT), and inflation-protected bonds (TIPS). To understand how the index achieved this, let us examine the inflation regimes in detail.

Based on our definitions, inflation stayed in the medium regime until February 2020, during which time the volatility-weighted (VolWt) strategy took effect. This led to gains from exposure to fixed income (Bonds, TIPS), which had relatively lower volatility. During the low inflation regime that followed, the index switched into the 60/40 strategy, outperforming REIT and GSCI, which were particularly hard hit during the early months of the COVID-19 pandemic. Starting March 2021, higher CPI (YoY) readings led the index to switch into the pro-inflation beta (ProIB) strategy, which yielded strong returns due to being overweight GSCI and Gold.

Cumulatively, over the course of the three-year period, the observed outperformance of the index is the result of these dynamic adjustments. This case study demonstrates how the switching mechanism could enhance the performance of the index as the inflation regime changes over time.

Performance Attribution

To assess how the dynamic index times its exposure to the underlying asset classes, we ran a performance attribution analysis over the same three-year period, treating each strategy as a separate benchmark. The results (see Exhibit 2) indicate that in comparison to 60/40, the index performance was adversely affected by its GSCI exposure, but this was more than compensated for by gains from its exposure to Bonds, Gold, and TIPS, leading to an outperformance of 1.46%. While this may not seem significant, it is important to note that this outperformance is achieved with lower volatility, leading to a higher risk-adjusted return.

The index exhibited stronger outperformance in comparison to VolWt primarily due to its higher equity exposure, as well as better timing of its exposure to Bonds and TIPS. The ProIB strategy had a higher exposure to GSCI and lower exposure to TIPS, which explains the bulk of its underperformance relative to the index over the entire three-year period.

Correlation to Unexpected Inflation

During periods of rising inflation, we are likely to obtain inflation readings higher than expected for several months in a row. For our index to effectively hedge inflation during such periods, its performance must be positively correlated to unexpected inflation. If the forecast of CPI (YoY) is considered the “expected” inflation rate for a given month, then the unexpected portion would be the excess (i.e., above the “realized” inflation) for that month.

Exhibit 3 illustrates that the dynamic index had a relatively better correlation to unexpected inflation compared to some of its component strategies. While ProIB had a higher correlation overall, its performance was affected by significantly higher volatility and more severe drawdowns.

The posts on this blog are opinions, not advice. Please read our Disclaimers.

Introducing the S&P Multi-Asset Dynamic Inflation Strategy Index – Part 1

Contributor Image
Fiona Boal

Managing Director, Global Head of Equities

S&P Dow Jones Indices

Inflation is one of the most significant risks to investment returns over the long term. Core equities and conventional bonds tend to deliver below-average returns in rising inflation environments, which can encourage investors to seek out inflation-sensitive assets, such as commodities, inflation-linked bonds, REITs, natural resource stocks, and gold, to protect their portfolios from inflation shocks.

Currently, the risk of inflation centers on whether the post-pandemic recovery will be merely reflationary or truly inflationary. It may be difficult for market participants to assign a probability to a sustained period of inflation and to adapt portfolio construction, should the probability be sufficiently high.

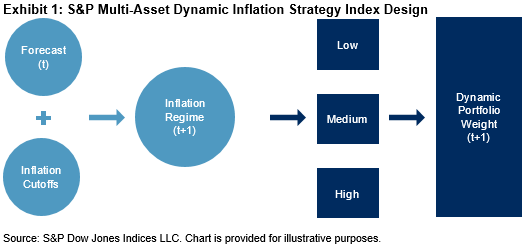
For an investor seeking protection against rising or high inflation, there is no “one-size-fits-all” solution—the portfolio must dynamically adjust to changes in the market environment, and this is exactly what the S&P Multi-Asset Dynamic Inflation Strategy Index is designed to do. The S&P Multi-Asset Dynamic Inflation Strategy Index seeks to measure the performance of a dynamic rotational strategy across a series of subindices designed to reflect the most appropriate response to the prevailing inflation regime in the U.S., as measured by the U.S. CPI. The index switches between three multi-asset strategies that have historically performed well in either a low, medium, or high inflation regime. The component indices within each multi-asset strategy are weighted based on dynamic weighting allocations (see Exhibit 1).

Component indices included in the S&P Multi-Asset Dynamic Inflation Strategy Index include those representing U.S. equities, commodity futures, U.S. sovereign bonds, U.S. inflation-linked bonds, and U.S. REITS.

The inflation regime is identified based on cutoffs for specific levels of inflation, as illustrated in Exhibit 2. For each inflation regime, a suitable strategy is identified based on inflation sensitivity, historical performance, and economic justification. Each month, the inflation regime is determined using the realized U.S. CPI (YoY), and the appropriate allocation is chosen based on the strategy identified for that regime.

The index demonstrated strong inflation beta in the high inflation regime and is relatively easy to implement and manage. The back-tests (though limited in terms of history) show that its performance and turnover were both reasonable. In a low inflation environment, equities tend to perform well, and a traditional 60/40 allocation that is overweight in equities can be expected to provide reasonable returns. During periods of medium inflation, fixed income assets tend to yield better risk-adjusted returns, so the volatility-weighted strategy that overweights them is a reasonable choice. In a high inflation regime, it makes sense to switch to the pro inflation beta strategy, which overweights commodities and real assets, since those asset classes have better inflation-hedging properties.

Exhibit 3 demonstrates that the dynamic index generally outperformed the component strategies on a risk-adjusted basis, and its drawdowns were not as severe. It is also worth noting that it had consistently higher inflation sensitivity than the 60/40 or volatility weighted strategies.

For more information, please visit the index webpage and read the thought leadership research paper.

The posts on this blog are opinions, not advice. Please read our Disclaimers.

A Diverse Approach to Sectors: Examining the S&P BSE SENSEX 50

How does index design influence sector diversification? Look under the hood of the S&P BSE SENSEX 50 Index with S&P DJI’s Ved Malla.

The posts on this blog are opinions, not advice. Please read our Disclaimers.

Industrial Commodities Push the S&P GSCI Lower in August

Contributor Image
Fiona Boal

Managing Director, Global Head of Equities

S&P Dow Jones Indices

The S&P GSCI declined 2.3% in August, as industrial commodities retreated in line with a surge in COVID-19 cases attributed to the Delta variant, as well as signs that China intended to dampen industrial production to curb carbon emissions. In contrast, performance across the soft commodities was impressive, with a variety of production-related disruptions elevating the risk of lower supply.

The S&P GSCI Petroleum fell 5.1% over the month. Oil production picked up across the world, while demand dipped slightly in the wake of a rise in COVID-19 cases. The resumption of aviation, especially long-haul passenger flights, would be critical to the full recovery in petroleum consumption.

Within the industrial metals complex, copper, lead, and nickel fell as China intensified its crackdown on some of the least environmentally friendly components of its economy. The S&P GSCI Aluminum was an exception, reaching a new 10-year high and ending the month up 4.5% and up 34.6% YTD. Supplies of the metal are becoming increasingly tighter as Beijing seeks to curb pollution from the metal’s energy-intensive production process. Environmental concerns are a double-edged sword for industrial metals, as they tend to be some of the worst GHG-emitting commodities, but they are key components in almost every new green technology.

Iron ore prices touched record highs this year, but the S&P GSCI Iron Ore suffered one of its biggest monthly losses ever in August (down 13.3%) as China’s curbs on carbon emissions included limits on the output of steel. Demand for steel has been healthy, but Chinese steel mills are constrained by Beijing’s instruction that production for 2021 should not exceed the record 1.065 billion metric tons produced last year. To meet that goal, steel producers would have to cut output by roughly 10% for the rest of 2021 from their record first-half pace.

The annual U.S. Fed meeting in Jackson Hole came and went without significant market volatility, and the S&P GSCI Gold ended flat for the month. Gold is often viewed as a hedge against inflation and currency debasement, and the Fed’s tapering would tackle both those conditions, thereby diminishing gold’s appeal.

The S&P GSCI Agriculture rose 0.3%, with the softs outperforming. The S&P GSCI Sugar rose 10.8%, marking a new three-year high as estimates for the size of the Brazilian cane crop continued to fall. The S&P GSCI Coffee rose 7.3%, continuing its impressive and volatile two-month rally. Several weather and logistical issues, including new pandemic lockdowns in Vietnam, coalesced to raise the price of a cup of joe.

The combination of stronger-than-expected pork demand and the ongoing lack of labor at U.S. packing plants pushed the S&P GSCI Lean Hogs up 0.9% for the month.

The posts on this blog are opinions, not advice. Please read our Disclaimers.