Get Indexology® Blog updates via email.

In This List

S&P PACT Indices Sector Weight Explanation in Developed and U.S. Markets

Preferred Stock and Senior Loan Solutions for Yield-Starved Investors

Income-Focused Strategy Indices Show Resilience in 2020 (Part 2)

Market Updates on the LIBOR Transition

S&P PACT Indices Sector Weight Explanation in Europe and the Eurozone

S&P PACT Indices Sector Weight Explanation in Developed and U.S. Markets

Contributor Image
Ben Leale-Green

Former Associate Director, Research & Design, ESG Indices

S&P Dow Jones Indices

In April 2020, we launched the S&P PACTTM (Paris-Aligned & Climate Transition) Indices. The indices aim to align with a 1.5oC climate scenario, the EU’s minimum standards for EU Climate Transition Benchmarks and EU Paris-Aligned Benchmarks, and the recommendations of the Task Force on Climate-related Financial Disclosures (TCFD), while maintaining a broad, diversified exposure. The S&P PACT Indices consist of the S&P Paris-Aligned (PA) Climate Indices and S&P Climate Transition (CT) Indices. The index methodology excludes certain companies (exclusion effect), then reweights remaining constituents (reweighting effect) based on their climate performance (see Exhibit 1), as discussed in a previous blog.

We published a paper explaining the weight attribution of constituents in the S&P PACT Indices, where we isolated the transition pathway, environmental score, physical risk, and level of high climate impact revenue as important weight drivers. Elaborating on Barbara’s recent blog, we highlight observations of how sector allocations were driven by climate factors and exclusions within the S&P 500® PACT and S&P Developed Ex-Korea PACT Indices.

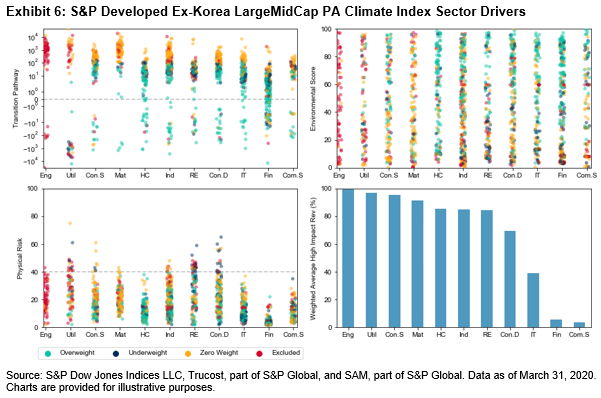
Similar to the S&P Europe LargeMidCap PA Climate Index and the S&P Eurozone LargeMidCap PA Climate Index, the S&P Developed Ex-Korea LargeMidCap PA Climate Index and S&P 500 PA Climate Index saw large Energy exclusions due to oil, gas, and coal exposure. Within the S&P 500 PA Climate Index specifically, no Energy stocks were eligible due to these exclusions. Furthermore, the removal of highly intensive power generation companies affected Utilities.

However, unlike the S&P Europe LargeMidCap CT Index and the S&P Eurozone LargeMidCap CT Index, the Utilities sector of the S&P 500 CT Index experienced underweighting. While this was observed within the S&P 500 PA Climate Index due to additional power generation exclusions, the underweight in the S&P 500 CT Index was likely driven by climate factors, particularly high physical risk. Utilities companies were largely either well above or below their 1.5oC budget (assessed by Trucost’s Transition Pathway dataset). The only overweighted Utilities company in the S&P 500 PA Climate Index had the lowest physical risk among its peers, despite being slightly above its allocated carbon budget.

While companies are not individually required to be 1.5oC compatible for eligibility for the S&P PACT Indices, we observed those well over budget (around 102 in the S&P Developed Ex-Korea LargeMidCap PACT and S&P 500 PACT Indices) rarely saw any weight allocation, whereas those under budget frequently realize large overweighting.

Health Care experienced a large overweight in the S&P 500 and S&P Developed Ex-Korea LargeMidCap PACT Indices. In each region, we observed few Health Care companies well over their 1.5oC budget, and high physical risk was rarely an issue.

High climate impact revenues were constrained to avoid greenwashing. Most sectors had both high and low climate impact revenues streams. High climate impact revenues made the biggest impact on weights at the company level within sectors, rather than at sector level. Within sectors that had a mix of companies with high and low climate impact revenue streams, those with majority low climate impact revenues tended to be underweighted. This is particularly apparent within the Consumer Discretionary and Health Care sectors, as seen on the right-hand charts of Exhibits 2 and 3.

While there are further observations that can be made from the exhibits in this blog, we hope this picks out some key points of interest.


The posts on this blog are opinions, not advice. Please read our Disclaimers.

Preferred Stock and Senior Loan Solutions for Yield-Starved Investors

Contributor Image
Brian Luke

Senior Director, Head of Commodities, Real & Digital Assets

S&P Dow Jones Indices

So far in 2021, the fixed income market certainly hasn’t been very fixed—instead posting negative returns—nor has it offered much income, with yields of just over 1%. U.S. equity and bond indices both posted strong performance in 2020, driving up asset class correlations and dropping yields to new lows. So, when the 10-year U.S. Treasury Bond traded above 1% in January 2021 (incidentally the first time since March 2020), the stock and bond markets both fell, disappointing investors looking to the bond market for portfolio diversification and consistent income stream.

Looking at what is on the menu for yield-focused market participants, options appear limited. Government bonds, while negatively correlated to stocks, tend to have low yield. Credit markets tend to have higher income potential but present additional risks, such as default risk, interest rate risk, and higher correlation to equities.

Analyzing each of these risks, along with their potential rewards, is the key to revealing potential opportunity. For example, the S&P U.S. Investment Grade Corporate Bond Index and S&P U.S. High Yield Corporate Bond Index, which seek to measure the broad U.S.-dollar corporate bond market, have current yields of 1.75% and 4.99%, respectively. Investment-grade bond indices are more credit worthy, but they also carry higher interest rate risk (as measured by the weighted average maturity [WAM] as shown in Exhibit 2). When yields rose in January 2021, the S&P U.S. Investment Grade Corporate Bond Index fell the most among fixed income sectors.

Senior loans don’t have nearly the same degree of sensitivity to rising rates as corporate bonds.1 Because loan rates reset quarterly or semiannually, yields keep pace with changes in prevailing interest rates. Constituents of the S&P/LSTA U.S. Leveraged Loan 100 Index, comprising the largest loans in the market, may not all carry the investment-grade ratings but may benefit from their senior secured status. According to S&P Global’s latest recovery study, bank loan recoveries averaged 79% compared with just 47% for bonds.

The S&P U.S. Preferred Stock QDI Index, comprising preferred stocks whose dividends may be taxed at long-term capital gains rather than punitive ordinary income rates, currently yields 5.66%. Preferred stocks typically do not mature and therefore are less sensitive to interest rates. However, they do have higher correlation to stocks as well as higher volatility relative to bank loans and investment-grade debt. Beyond the tax advantage of these stocks, the index outperformed the broad-based S&P U.S. Preferred Stock Index by 3.5% per year on an annualized basis.

Hunting for income in a yield-starved world comes with many challenges for market participants. By measuring the risk/return profile of various fixed income market segments, yield-hungry market participants will be able to make informed decisions.

1 The degree of sensitivity to rising rates is measured by the weighted average life (WAL) of the S&P/LSTA U.S. Leveraged Loan 100 Index.

The posts on this blog are opinions, not advice. Please read our Disclaimers.

Income-Focused Strategy Indices Show Resilience in 2020 (Part 2)

Contributor Image
Mathieu Pellerin

Researcher

Dimensional Fund Advisors

In part 1 of this blog, we saw how falling real interest rates reduce the retirement income a given account balance can support. In part 2, we focus on how interest rate risk may potentially be managed through an income-focused asset allocation.

The S&P STRIDE (S&P Shift to Retirement Income and Decumulation) indices measure the allocation shown in Exhibit 1. The allocation has two features that differentiate it from the glide path typically followed by regular target date indices. First, in an attempt to better manage market risk, the glide path of S&P STRIDE allocates 25% of index constituents to equities at the target date (or retirement), compared to about 50% for the industry average.1 Second, the S&P STRIDE glide path includes a substantial index constituent allocation to long-maturity TIPS when approaching the target date, which is designed to help manage both interest rate and inflation risk. The S&P STRIDE allocation seeks to hedge this risk by including TIPS constituents with an interest rate sensitivity similar to the cost of 25 inflation-indexed payments starting at the target retirement date. This way, when interest rates decrease, the cost of future consumption goes up, but so does the account balance. With the appropriate TIPS portfolio, the two effects approximately offset each other, making retirement income less volatile.

How did the S&P STRIDE approach fare in 2020? Exhibit 2 considers the hypothetical experience of a cohort of investors retiring in 2020. We compare two index constituent allocations: the S&P STRIDE 2020 Index and the S&P 2020 Target Date Index, which seeks to represent the average asset allocation of U.S.-based 2020 target date funds.2 Starting with a theoretical $1M investment at the beginning of 2020, the bars show the theoretical real income that each allocation can afford, determined by balance amounts and real interest rates at the beginning of each month.

The S&P 2020 Target Date Index performance was –4.3% in theoretical real income terms in 2020. By contrast, the S&P STRIDE 2020 Index performance was 1.6%, an outperformance of 5.9 percentage points. Importantly, this difference was not driven by the S&P STRIDE Index’s lower exposure to equities. Given that equity markets rebounded substantially since March 2020, this outperformance may be attributed to S&P STRIDE’s long-dated TIPS allocation. While bond constituents in the S&P 2020 Target Date Index offered some protection from interest rate risk, their maturities were too short to fully offset the theoretical income loss.

As eventful as 2020 was, S&P STRIDE Index’s income-focused approach proved its potential as a tool to help mitigate interest rate and inflation risk.


1 Figure based on the S&P Target Date 2020 Index, which reflects the average asset allocation across 2020 target date funds. See S&P Target Date Scorecard Year-End 2019 (link) and S&P’s “Making STRIDEs in Evaluating the Performance of Retirement Solutions” (link).

2 See “S&P Target Date Index Series Methodology” (link) for a complete description.

Investments involve risks. The investment return and principal value of an investment may fluctuate so that an investor’s shares, when redeemed, may be worth more or less than their original value. Past performance is not a guarantee of future results. There is no guarantee strategies will be successful.

The S&P STRIDE Index Series was developed in collaboration with Dimensional Fund Advisors LP (“Dimensional”), an investment advisor with the U.S. Securities and Exchange Commission. Dimensional Fund Advisors LP receives compensation from S&P Dow Jones Indices in connection with licensing right to the S&P STRIDE Indices.

The posts on this blog are opinions, not advice. Please read our Disclaimers.

Market Updates on the LIBOR Transition

Contributor Image
Hong Xie

Former Senior Director, Global Research & Design

S&P Dow Jones Indices

This year will be key in the London Inter-Bank Offered Rate (LIBOR) transition. After consultation on ending the publication of LIBOR in USD, GBP, EUR, CHF, and JPY, the administrator of LIBOR, the ICE Benchmark Administration (IBA), may announce its decision soon. The announcement of LIBOR cessation would trigger the spread adjustment to be fixed as a component of the LIBOR fallback rate for derivatives contracts with fallback provisions governed by ISDA.1 For legacy non-consumer cash products referencing USD LIBOR, this fixed spread adjustment would be added to a form of SOFR to replace USD LIBOR as recommended by the ARRC.2

IBA’s consultation in December 2020 indicated its intention to cease the publication of LIBOR in GBP, EUR, CHF, and JPY, as well as 1-week and 2-month USD LIBOR at the end of 2021, along with major USD LIBOR tenors (overnight, 1-month, 3-month, 6-month, and 12-month) in June 2023. Despite the potential delay of USD LIBOR cessation to mid-2023, U.S. regulators are encouraging no new USD LIBOR contracts after the end of 2021, while allowing most legacy contracts to mature before USD LIBOR stops.

On derivatives contracts, progress has been made in LIBOR transition with the ISDA 2020 IBOR Fallbacks Protocol having taken effect on Jan. 25, 2021. The ISDA leads the initiative to improve the derivatives contract robustness to address the risk of LIBOR discontinuation. The ISDA’s protocol provides standard fallback language for IBOR-based derivatives (including LIBOR) on a voluntary basis. It lays out a clear path to transition to replacement rates for the USD 200 trillion USD LIBOR derivatives market.

The other milestone in listed derivatives’ LIBOR transition also took place on Jan. 25 when CME provided details on proposed methodology for transitioning Eurodollar futures and option contracts. Because of Eurodollar futures and options’ close relation to OTC LIBOR-based derivatives, CME aligns with ISDA in its Eurodollar futures and options fallback language. Upon a fallback trigger, Eurodollar futures would be converted to 3-month SOFR futures, with prices adjusted in line with the ISDA approach. Eurodollar futures options would be replaced with corresponding 3-month SOFR options, with strike adjusted using ISDA’s spread adjustment.

On cash products, the ARRC has recommended fallback language for floating-rate notes, bilateral business loans, syndicated loans, and saucerization products for market participants’ voluntary use. For contracts that do not have fallback language or that fall back to a rate based on LIBOR, the ARRC-proposed LIBOR transition legislation was included in the New York State 2022 budget and presented in January 2021. As many cash products referencing USD LIBOR fall under New York law, the proposed legislation will help contracts make an orderly switch to replacements when LIBOR ends.

1 The International Swaps and Derivatives Association (ISDA) is a trade organization of participants in the market for over-the-counter derivatives. It is headquartered in New York City, and has created a standardized contract to enter into derivatives transactions.

2 The Alternative Reference Rates Committee (ARRC) is a group of private market participants convened by the Federal Reserve Board and the New York Fed to help ensure a successful transition from U.S. dollar LIBOR to a more robust reference rate, its recommended alternative, the Secured Overnight Financing Rate (SOFR).

The posts on this blog are opinions, not advice. Please read our Disclaimers.

S&P PACT Indices Sector Weight Explanation in Europe and the Eurozone

Contributor Image
Barbara Velado

Senior Analyst, Research & Design, Sustainability Indices

S&P Dow Jones Indices

In April 2020, we launched the S&P PACTTM (Paris-Aligned Climate Transition) Indices. The indices aim to align with a 1.5oC climate scenario, the EU’s minimum standards for EU Climate Transition Benchmarks and EU Paris-Aligned Benchmarks, and the recommendations of the Task Force on Climate-related Financial Disclosures (TCFD), while maintaining a broad, diversified exposure. The S&P PACT Indices consist of the S&P Paris-Aligned (PA) Climate Indices and S&P Climate Transition (CT) Indices. The index methodology excludes certain companies (exclusion effect), then reweights remaining constituents (reweighting effect) based on their climate performance (see Exhibit 1), as discussed in a previous blog.

We published a paper explaining the weight attribution of constituents in the S&P PACT Indices, where we isolated the transition pathway, environmental score, physical risk, and level of high climate impact revenue as important weight drivers. In this blog, we assess how sector allocations (see Exhibit 2) are driven by the climate factors and exclusions listed above within the S&P Eurozone PACT and the S&P Europe PACT Indices.

The Energy sector was allocated zero weight in the S&P Eurozone LargeMidCap PA Climate Index and the S&P Europe LargeMidCap PA Climate Index, largely due to the methodology’s exclusion of companies that participate in oil operations. Meanwhile, Energy companies were eligible, but still underweighted in the S&P Eurozone LargeMidCap CT Index and S&P Europe LargeMidCap CT Index, as all companies were misaligned with their 1.5oC budget (see Exhibits 7 and 9). Within the S&P Eurozone LargeMidCap CT Index, one Energy company was overweighted. This company showed a strong environmental score, low physical risk, and was the closest to the 1.5oC compatibility goal of all the Energy stocks. Within the S&P Europe LargeMidCap CT Index, another Energy company was overweighted—this was the second-closest stock to the 1.5oC compatibility requirement.

Unlike the S&P Europe LargeMidCap CT Index, no Utilities companies were excluded from the S&P Eurozone LargeMidCap CT Index due to power generation revenues, but many were excluded for gas operations in both indices (see Exhibits 4 and 5). Among the S&P PACT Indices in Europe and the Eurozone, Utilities received an underweight within the PA strategy, but an overweight within the CT series, largely due to differences in exclusion requirements. Energy and Utilities are generally considered among the highest-emitting sectors. Some Utilities companies are on a trajectory in line with the 1.5oC regulation, resulting in a vast weight improvement relative to Energy companies within the CT indices.

Financials was overweighted within the S&P Europe and Eurozone LargeMidCap PA and CT Indices. This is due to Financials being the largest sector within these indices—it was not affected by exclusions, which accounted for 16.5% of excluded weight from other sectors. If this weight is added to each constituent on a pro-rated basis (in line with the index’s objective function), then Financials would receive an overweight by having no excluded companies (represented by the yellow bars in Exhibit 2). We see that Financials receives less weight than a simple redistribution of eligible weight would suggest, due to Financials having a lower climate impact (see charts on the right in Exhibits 2 and 3). This reflects a positive redistribution effect overall, with the climate factors negatively affecting the weight of Financials in the indices.

Consumer Staples was strongly overweighted in both the S&P Eurozone LargeMidCap PA and CT Indices. This is likely due to there being no exclusions for the sector, as those companies are closer to their 1.5oC budget (below 102 as seen in Exhibits 6 and 7) and have high climate impact revenues.

We will follow up with another blog on the S&P 500 PACT and S&P Developed PACT Indices.

The posts on this blog are opinions, not advice. Please read our Disclaimers.